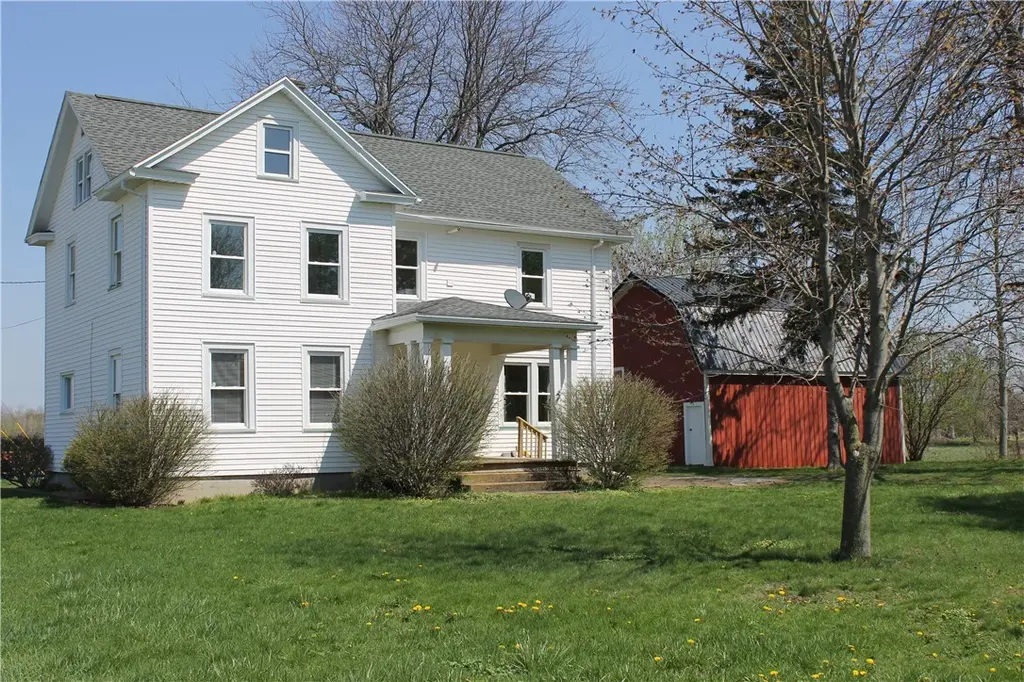
5327 Eagle Harbor Rd · Oakfield, NY
Flood risk 1/10 · Minimal
- FEMA flood zone
- —
- Chance of flooding over 30 yrs
- 0.0%
- Est. flood insurance / yr
- —
Fire risk 1/10 · Minimal
- Est. fire insurance / yr
- $691 – $1,283
Heat risk 2/10 · Minimal
- Hot days now (above 95°F)
- 7 days/yr
- Hot days in 30 yrs
- 15 days/yr
Wind risk 1/10 · Minimal
- Chance of severe wind over 30 yrs
- —
Air-quality risk 2/10 · Minimal
- Unhealthy air days now
- 1 days/yr
- Unhealthy air days in 30 yrs
- 2 days/yr
Risk factors via First Street. Map © Google.
Why this score? — see what drove the D+ grade
The composite is a weighted blend of 9 inputs, each scored 0–100. Each bar is that input's sub-score; the figure is the points it added to the 100-point composite (weight × sub-score).
- Cash flow +19.4/30.0
- ARV discount +7.5/15.0
- DSCR +6.1/10.0
- 1% rule +3.9/10.0
- Schools +3.7/10.0
- Livability +3.2/5.0
- Rent growth +2.5/5.0
- Condition / age +2.5/5.0
- Appreciation +0.0/10.0
$199,900
🖨 Deal sheet (PDF) 📄 Offer letter ✓ Due diligence
Listing remarks
Very well-maintained Solid Colonial in the country. This one is ready for you to move in and enjoy those summer nights on the front porch or do a project in the garage. Speaking of the garage/outbuilding, it has a second floor! Let your imagination wander! Inside you will find 3 bedrooms, a full bath and laundry room all on the 2nd floor! Looking for a home office, library or nursery? The second floor has that too! Downstairs the options are also endless. Formal Dining room or a cozy family room and a living room space that is to die for! The convenience of a half bath is just a bonus! Negotiations are Delayed until Tuesday 4/28, 5pm. Open House is scheduled for Sunday 4/26, 1-3pm.
Key facts
- Second floor
- Formal dining room
- Front porch
Tags
Property features AI
Exterior
- Parking: Detached garage; Circular driveway; 1 garage space
- Utilities: Public water connected; Septic tank; Water connected
- Home design: 2-story existing home; Entry level includes main-level bathroom; Vinyl siding
- Construction: Vinyl siding construction; Asphalt roof; Stone foundation; Existing (previously built)
- Exterior features: Covered porch; Patio/porch; Dirt driveway; Gravel driveway; Corner lot; Rectangular, rural lot; Agricultural lot
Interior
- Kitchen: Electric oven; Electric range; Refrigerator; Eat-in kitchen; Country kitchen
- Bedrooms: Total rooms include living areas and designated spaces (8 total rooms listed: Laundry, Living Room, Office, Entry Foyer, Library)
- Flooring: Carpet; Laminate; Vinyl; Varies
- Bathrooms: 1 full bathroom; 1 half bathroom; 1 main-level bathroom
- Heating & cooling: Oil heating with forced air
- Interior features: Separate formal dining room; Entrance foyer; Eat-in kitchen; Separate formal living room; Home office; Country kitchen; Library; Thermal windows
- Laundry & utility: Washer and dryer included; Laundry located on upper level; Electric water heater
Neighborhood map
What this means for you Summary
Snapshot
- This is a 4-bed/1.0-bath single-family listed at $200k.
Deal economics
- At list price, monthly cash flow is $222 ($3k/yr) — positive.
- The deal already cash-flows at list — no discount required.
- To meet the 1% rule (rent ≥ 1% of price), the offer needs to be $177k (11.4% below list).
- Recommended offer: $177k (11.4% below list) — sets the bar for 1% rule.
Location & tenants
- Location reads 64/100 on livability (#749 in NY) — a middle-class / working-renter tenant base. Strengths: cost of living A+, housing A+, crime A-; Watch: employment D+, amenities F, commute F.
- Albion Central School District (town): math 37% / reading 50% proficiency, ranked #479 of 590 in NY (top 81%) — families likely to look elsewhere, expect single-tenant / working-renter base with shorter leases.
- Zoned schools: Ronald L Sodoma Elementary School (math 31% / reading 49%, grade F, #1,415 of 2,108 statewide, top 67%, 820 students, 57% FRL); Carl I Bergerson Middle School (math 19% / reading 44%, grade F, #522 of 729 statewide, top 73%, 403 students, 62% FRL); Charles D'Amico High School (math 98% / reading 87%, grade A+, #158 of 1,100 statewide, top 15%, 514 students, 63% FRL) — zoned schools average 60% FRL vs 45% district-wide (16 pts higher); higher-poverty schools than district average — tighter screening recommended.
- Market conditions: 44 active listings in the ZIP; 28 units permitted in Orleans County in 2024 (0 in 5+ unit buildings).
Forward outlook
- Local home prices are declining (-3.0%/yr); year-one equity from $1k of loan paydown is wiped out by about $6k of value loss. Plan a longer hold.
- Orleans County population projected at -20% by 2050 — secular population decline; favor cash flow + early exit over multi-decade hold.
Negotiation context
- Only 6 days on market — expect competitive offers; lowballing is unlikely to land.
Risks & watch-outs
- Watch-outs: built in 1900 — expect roof / HVAC / electrical / plumbing capex.
Questions for the listing agent
- Built in 1900 — when were the roof, HVAC, electrical panel, plumbing, and water heater last replaced?
- Is there a deadline driving the sale (1031 exchange, divorce, estate, relocation)? That informs how much negotiation room exists.
- The area grade is low — what's the realistic commute time and amenity access for the typical tenant pool here? Any planned neighborhood developments (good or bad) we should know about?
- What's the average days-on-market for RENTAL listings here right now (not sales)? A rising rental-DOM trend means longer vacancies and softer asking-rent achievability than the comps imply.
- What's the recent tenant-quality profile in this submarket — average credit score on applications, eviction rate, late-payment / NSF rate, and stable-employment percentage? A property-management company in the area should have these aggregated.
- How much new for-sale + rental construction is in the pipeline within 1–3 miles? Heavy new supply typically softens prices + rents 12–24 months out; constrained supply supports both.
Investment metrics
- 1% rule
- 0.89% ✗
- Cap rate
- 7.62%
- Cash-on-cash
- 4.75%
- DSCR
- 1.21
- GRM
- 9.4
CMA / ARV
No comps found within radius.
Projected returns pro-forma
-3.0% appreciation · 3.0% rent growth · sell at horizon
- IRR
- -9.0%
- Equity multiple
- 0.67×
- Total profit
- $-18,380
- Equity at exit
- $29,806
- IRR
- 0.5%
- Equity multiple
- 1.03×
- Total profit
- $1,766
- Equity at exit
- $17,284
Cash invested: $55,972 (down + closing). Projections, not guarantees.
Landlord ↔ Tenant lean methodology
- Overall (STATE)
- 15 Strongly Tenant-Friendly
- State New York
- 15 Strongly Tenant-Friendly · D+10
- County
- — inherits STATE
- City
- — inherits STATE
ZIP-level market 14411
- Home prices YoY
- -11.6%
- Active inventory
- 44
- Price-to-rent
- 9.4×
Monthly cashflow live
- Estimated rent
- $1,771 medium interval (Pro) →
- Mortgage (P&I)
- −$1,048
- Tax from tax record
- −$46 /mo · $556/yr
- Insurance
- −$83
- HOA
- −$0
- Vacancy / Maint / Mgmt
- −$372
- Net cashflow
- $222
Break-even live
Sensitivity live
| Price | -10% $335 | -5% $278 | +0% $222 | +5% $165 | +10% $108 |
|---|---|---|---|---|---|
| Rent | -10% $82 | -5% $152 | +0% $222 | +5% $292 | +10% $362 |
| Rate | -1.0pp $322 | -0.5pp $272 | base $222 | +0.5pp $170 | +1.0pp $117 |
UW: 25.0% down · 7.5% · 30yr · 1.5% tax · 5.0% vac · 8.0% maint · 8.0% mgmt
Financing live
Cash to close
- Down payment
- $49,975
- Closing costs
- $5,997
- Reserves months
- —
- Total cash needed
- —
Loan-product check · same deal, 3 products live
Conventional
25% down · 7.5% · 30yr
- Down + closing
- —
- Monthly P&I
- —
- Monthly cashflow
- —
- DSCR
- —
- Eligible?
- —
Personal DTI + credit; lowest rate.
DSCR
20% down · 8.5% · 30yr
- Down + closing
- —
- Monthly P&I
- —
- Monthly cashflow
- —
- DSCR
- —
- Eligible?
- —
No personal income docs; deal must DSCR.
Hard money
10% down · 12.0% · 12mo
- Down + closing
- —
- Monthly P&I
- —
- Monthly cashflow
- —
- DSCR
- —
- Eligible?
- —
Short-term bridge; refi at stabilization.
Listing history 2 events
-
2026-04-29status Pending
-
2026-04-22$199,900 Active
ⓘ Source: listings_history table (triggers on properties + properties_extension) + one-shot
backfill from property_details.listing_events for pre-trigger history.
Tax reassessment forecast NY · Partial reset (capped growth)
- Current annual tax
- $556 · $46/mo
- Projected year-2 tax
- $1,967 · $164/mo
- Expected delta
- +$1,411/yr (+$118/mo · 254.1%)
ⓘ Screening estimate from a state-policy table — verify with the county assessor before closing.
Climate risk First Street
- Flood 1/10 Low 0% chance over 30 yrs
- Wildfire 1/10 Low
- Heat 2/10 Low 7 d/yr ≥95°F today · 15 d/yr by 30 yrs out
- Wind 1/10 Low
- Air quality 2/10 Low 1 unhealthy d/yr today · 2 by 30 yrs out
Nearby sold comps map
Loading sold comps map…
Walkable amenities ~0.75 mi
Loading nearby amenities…
Taxation est. · year 1
- Rental income
- $21,257
- − Mortgage interest
- −$11,198
- − Property taxes
- −$556
- − Insurance
- −$1,000
- − Repairs & maintenance
- −$1,701
- − Management
- −$1,701
- − Depreciation
- −$5,815
- Taxable loss
- −$712
- Est. tax savings @ 24.0%
- +$171
- After-tax cash flow
- $2,829/yr
For passive investors: Depreciation is non-cash, so a rental often shows a tax loss while cash-flowing — sheltering income. Rental losses are passive: they offset passive income freely, and up to $25,000/yr can offset ordinary (W-2) income if you actively participate and your MAGI is under $100k (phasing out to $0 by $150k); unused losses carry forward. On sale, claimed depreciation is recaptured at up to 25%, and gains may owe capital-gains tax (a 1031 exchange can defer both). Figures are a year-1 estimate at your 24.0% rate — not tax advice; consult a CPA.
Schools (NCES district)
- District
- Albion Central School District
- NCES district ID
- 3602520
- Math proficiency
- 37% ▼ -15.00%
- Reading proficiency
- 50% ▲ 7.00%
- Median HH income
- $45,408
- Composite
- 36.91/100
- National rank
- #4541
- State rank
- #479 of 590 in NY
Livability — Oakfield
- Score
- 64/100
- State rank
- #749
- US rank
- #14329
Category grades
Schools grade is shown separately in the Schools card above.
Census & demographics
- Population (ZIP)
- 12,479
Population outlook (Orleans County) Hauer SSP2
- Today (2025)
- 39,123 people
- By 2030
- 37,648 · -3.8%
- By 2040
- 34,432 · -12.0%
- By 2050
- 31,487 · -19.5%
- By 2075
- 26,544 · -32.2%
- By 2100
- 22,251 · -43.1%
Race, ethnicity, and origin ACS 2023
- Neighborhood character
- Predominantly White (83%)
- Race & ethnicity
- White 83% Black 9% Hispanic / Latino 5% Two or more races 4%
- Common ancestry
- Romanian 5% Iranian 2% Lithuanian 2%
- Foreign-born
- 2% · Canada, China
- Languages at home
- 95% English-only · Spanish 4% Other Indo-European 1%
Political lean MEDSL · Orleans
- 2024 margin
- Solid R (+40.5) · D 29.8% · R 70.2%
- 2008→2024 swing
- -21.8pp toward R · 2008: -18.7pp · 2024: -40.5pp
- All cycles
- 2024: R+40.5 2020: R+36.0 2016: R+43.4 2012: R+19.4 2008: R+18.7
Not yet ingested
- Civics
- —
Market trends
- HPI YoY
- ▼ -39.68%
- Current HPI
- 302.9236
- Rent YoY
- —
- Metro
- —
- State GDP YoY
- ▲ 2.60%
- F500 in state
- 92
Industry mix (Fortune 500 HQ in NY)
| Industry | F500 HQs | Revenue |
|---|---|---|
| Financial Services | 10 | $950B |
|
||
| Consumer Goods | 9 | $162B |
|
||
| Insurance | 4 | $225B |
|
||
| Telecommunications | 2 | $144B |
|
||
| Pharmaceuticals | 2 | $112B |
|
||
| Media / Entertainment | 2 | $69B |
|
||
Price history
2 events — show timeline
- 2026-04-29 Pending — UNYREIS
- 2026-04-22 Listed $199,900 UNYREIS
Property tax history
+0.4%/yrLatest (2025): $556 · -49.6% YoY. Source: county tax records.
Cash-flow waterfall
monthlySold comps — $/sqft
last 12 mo · ≤1 miLoading sold comps…