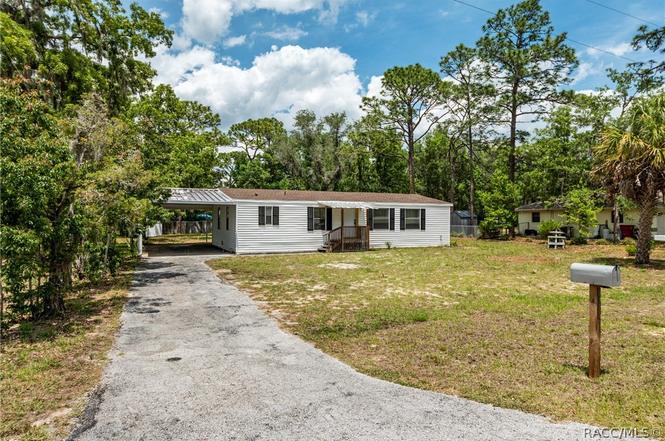
7041 W Grant St · Homosassa Springs, FL
Flood risk 5/10 · Moderate
- FEMA flood zone
- X (unshaded)
- Chance of flooding over 30 yrs
- 0.24%
- Est. flood insurance / yr
- $507 – $1,088
Fire risk 6/10 · Moderate
- Est. fire insurance / yr
- $947 – $1,759
Heat risk 9/10 · Severe
- Hot days now (above 108°F)
- 7 days/yr
- Hot days in 30 yrs
- 25 days/yr
Wind risk 9/10 · Severe
- Chance of severe wind over 30 yrs
- 99.0%
Air-quality risk 1/10 · Minimal
- Unhealthy air days now
- 0 days/yr
- Unhealthy air days in 30 yrs
- 0 days/yr
Risk factors via First Street. Map © Google.
Why this score? — see what drove the C- grade
The composite is a weighted blend of 9 inputs, each scored 0–100. Each bar is that input's sub-score; the figure is the points it added to the 100-point composite (weight × sub-score).
- Cash flow +23.6/30.0
- DSCR +7.6/10.0
- 1% rule +5.3/10.0
- Schools +4.1/10.0
- Livability +3.6/5.0
- ARV discount +3.2/15.0
- Rent growth +2.5/5.0
- Condition / age +2.5/5.0
- Appreciation +0.0/10.0
$189,500
🖨 Deal sheet 📄 Offer letter ✓ Due diligence
Listing remarks
If you’ve been searching for a fully updated, move-in-ready home with modern finishes, outdoor living space, and everyday functionality, this beautifully renovated Homosassa property is one you won’t want to miss. Situated on a spacious 0.38-acre lot, this 3-bedroom, 2-bath manufactured home blends stylish upgrades with comfortable Florida living. Inside, you’ll find fresh interior paint, luxury vinyl plank flooring, and updated lighting and plumbing fixtures throughout, creating a clean and modern feel from the moment you walk in. The heart of the home is the beautifully designed kitchen featuring quartz countertops, a dedicated coffee bar, and a stunning waterfall-edge q
Key facts
- Expansive lot
- Quartz countertops
- Dedicated coffee bar
Tags
Property features AI
Exterior
- Parking: Attached carport; Driveway; Private parking (1 space total)
- Security: Smoke detector(s)
- Utilities: Private well water; Septic tank sewer
- Home design: Manufactured home (double wide); Residential property
- Construction: Asphalt shingle roof
- Exterior features: Cleared lot; County road frontage; No pool
Interior
- Kitchen: Electric oven; Microwave; Refrigerator; Water heater
- Bathrooms: 2 full bathrooms
- Heating & cooling: Central heating (electric); Central air conditioning (electric)
- Interior features: Dryer; Electric oven; Microwave; Refrigerator; Water heater; Washer; Smoke detector(s)
- Laundry & utility: Washer; Dryer
Neighborhood map
What this means for you Summary
Snapshot
- This is a 3-bed/2.0-bath manufactured listed at $190k.
Deal economics
- At list price, monthly cash flow is $356 ($4k/yr) — positive.
- The deal already cash-flows at list — no discount required.
- Meets the 1% rule at list price ($2k rent vs $190k).
- Recommended offer: $178k (6.0% below list) — sets the bar for market timing.
- Cap rate 8.5% vs local median 5.9% in Homosassa Springs — top-decile yield for the area; either an underpriced asset or a hidden risk that comps aren't pricing in. Stress-test before assuming the spread holds.
Location & tenants
- Location reads 71/100 on livability (#391 in FL) — a middle-class / working-renter tenant base. Strengths: cost of living A+, housing A+, health & safety A+; Watch: crime C-, amenities F, commute F.
- Citrus (rural): math 49% / reading 50% proficiency, ranked #44 of 73 in FL (top 60%) — families likely to look elsewhere, expect single-tenant / working-renter base with shorter leases.
- Zoned schools: Rock Crusher Elementary School (math 70% / reading 56%, grade B, #582 of 2,144 statewide, top 28%, 665 students, 68% FRL); Lecanto Middle School (math 49% / reading 49%, grade C-, #265 of 571 statewide, top 48%, 809 students, 55% FRL); Lecanto High School (math 46% / reading 53%, grade D, #179 of 667 statewide, top 29%, 1,630 students, 46% FRL) — zoned schools at 56% FRL track the district average.
- Market conditions: 307 active listings in the ZIP; 1 comparable units currently listed for rent nearby; 2,443 units permitted in Citrus County in 2024 (0 in 5+ unit buildings).
- At $1,949/mo this rent would consume 51% of the median local household income ($46k/yr) (locally 113% of renters already pay >50% of income on rent) — very limited rent-growth headroom before tenants either downsize or default.
Forward outlook
- Local home prices are declining (-3.0%/yr); year-one equity from $1k of loan paydown is wiped out by about $6k of value loss. Plan a longer hold.
- Citrus County population projected to shrink 10% by 2050 — rents likely to lag national; underwrite the cash flow, not the appreciation.
Negotiation context
- It's been on market 68 days — a 6% lower offer ($178k) is reasonable based on typical stale-listing flexibility.
- 2 sale attempts; this cycle's ask has dropped $10k (5%) from the opening price — seller is motivated, your offer sets the floor, not the list.
- Current owner paid $45k; list at $190k implies a 321% gain — meaningful room to come down on a strong offer.
Risks & watch-outs
- Climate carrying-cost: moderate flood risk; severe wind risk, 99% chance of damaging wind over 30y; major wildfire risk; extreme-heat days projected 7→25/yr by 2055 (HVAC capex compounding) — expect insurance premiums to compound above CPI over the hold.
Questions for the listing agent
- It's been on market 68 days. Have you received any prior offers? Is the seller open to a 6% concession, seller financing, or rate buy-down credit?
- Why hasn't it sold? Are there any deal-killer items the seller is aware of (foundation, flood, title, zoning, code violations)?
- Is there a deadline driving the sale (1031 exchange, divorce, estate, relocation)? That informs how much negotiation room exists.
- Schools are F-rated, which usually means shorter tenancies and higher turnover. Who's the typical renter profile here, and what's been the actual vacancy rate?
- What's the average days-on-market for RENTAL listings here right now (not sales)? A rising rental-DOM trend means longer vacancies and softer asking-rent achievability than the comps imply.
- What's the recent tenant-quality profile in this submarket — average credit score on applications, eviction rate, late-payment / NSF rate, and stable-employment percentage? A property-management company in the area should have these aggregated.
- How much new for-sale + rental construction is in the pipeline within 1–3 miles? Heavy new supply typically softens prices + rents 12–24 months out; constrained supply supports both.
Investment metrics
- 1% rule
- 1.03% ✓
- Cap rate
- 8.55%
- Cash-on-cash
- 8.05%
- DSCR
- 1.36
- GRM
- 8.1
CMA / ARV
- ARV (on-the-fly)
- $172,800
- Comps found
- 10
Show comp detail 10 sales within ~0.75 mi
| Address | Dist | Beds/Ba | Sqft | Sold | Price | $/sf | Match |
|---|---|---|---|---|---|---|---|
| 7115 W Grant St | 0.07mi | 3/2.0 | 1,296 (+8%) | 3mo | $145,000 | $112 | 80 |
| 7059 W Jackson Ln | 0.07mi | 2/2.0 (-1) | 1,204 (+0%) | 18mo | $199,000 | $165 | 76 |
| 6781 W Grant St | 0.26mi | 3/2.0 | 1,294 (+8%) | 3mo | $186,000 | $144 | 73 |
| 7038 W Jackson Ln | 0.10mi | 3/2.0 | 1,296 (+8%) | 19mo | $172,000 | $133 | 66 |
| 6594 W Grant St | 0.44mi | 3/2.0 | 1,152 (-4%) | 9mo | $184,000 | $160 | 65 |
| 6394 W Beaumont Ln | 0.66mi | 3/2.0 | 1,153 (-4%) | 9mo | $200,000 | $173 | 55 |
| 3524 S Westmoreland Dr | 0.46mi | 3/2.0 | 1,352 (+13%) | 5mo | $195,000 | $144 | 54 |
| 6904 W Ray Ct | 0.58mi | 4/2.0 (+1) | 1,272 (+6%) | 17mo | $85,000 | $67 | 44 |
| 6589 W Rosedale Dr | 0.53mi | 3/2.0 | 1,344 (+12%) | 15mo | $235,000 | $175 | 42 |
| 3360 S Arundel Ter | 0.50mi | 2/1.5 (-1) | 1,104 (-8%) | 17mo | $75,000 | $68 | 42 |
Match score weights: distance 35% · size 25% · config 20% · recency 20%. Top-matched comps best support the ARV.
Projected returns pro-forma
-3.0% appreciation · 3.0% rent growth · sell at horizon
- IRR
- -4.1%
- Equity multiple
- 0.85×
- Total profit
- $-8,096
- Equity at exit
- $28,255
- IRR
- 5.6%
- Equity multiple
- 1.41×
- Total profit
- $21,934
- Equity at exit
- $16,384
Cash invested: $53,060 (down + closing). Projections, not guarantees.
Landlord ↔ Tenant lean methodology
- Overall (STATE)
- 87 Strongly Landlord-Friendly
- State Florida
- 87 Strongly Landlord-Friendly · R+3
- County
- — inherits STATE
- City
- — inherits STATE
ZIP-level market 34448
- Home prices YoY
- -26.1%
- Active inventory
- 307
- Price-to-rent
- 8.1×
Monthly cashflow live
- Estimated rent
- $1,949 medium interval (Pro) →
- Mortgage (P&I)
- −$994
- Tax from tax record
- −$111 /mo · $1,336/yr
- Insurance
- −$79
- HOA
- −$0
- Vacancy / Maint / Mgmt
- −$409
- Net cashflow
- $356
Break-even live
UW: 25.0% down · 7.5% · 30yr · 1.5% tax · 5.0% vac · 8.0% maint · 8.0% mgmt
Financing live
Cash to close
- Down payment
- $47,375
- Closing costs
- $5,685
- Reserves months
- —
- Total cash needed
- —
Loan-product check · same deal, 3 products live
Conventional
25% down · 7.5% · 30yr
- Down + closing
- —
- Monthly P&I
- —
- Monthly cashflow
- —
- DSCR
- —
- Eligible?
- —
Personal DTI + credit; lowest rate.
DSCR
20% down · 8.5% · 30yr
- Down + closing
- —
- Monthly P&I
- —
- Monthly cashflow
- —
- DSCR
- —
- Eligible?
- —
No personal income docs; deal must DSCR.
Hard money
10% down · 12.0% · 12mo
- Down + closing
- —
- Monthly P&I
- —
- Monthly cashflow
- —
- DSCR
- —
- Eligible?
- —
Short-term bridge; refi at stabilization.
Rent comps 1 comps
| Address | Beds | Baths | Sqft | Rent | $/sqft | DOM | Units | Dist |
|---|---|---|---|---|---|---|---|---|
| 3844 S Swan Ter Homosassa, FL | 3.0 | 2.0 | 1172 | $1,800 | $1.54 | 21d | 1 | 0.93mi |
Listing history 7 events
-
2026-05-15status Pending
-
2026-05-06status Active
-
2026-04-21historical
-
2026-04-12price $189,500
-
2026-02-21$199,900 Active
-
2003-09-01soldstatus $45,000
-
1992-02-01soldstatus $32,000
ⓘ Source: listings_history table (triggers on properties + properties_extension) + one-shot
backfill from property_details.listing_events for pre-trigger history.
Tax reassessment forecast FL · Resets to sale price
- Current annual tax
- $1,336 · $111/mo
- Projected year-2 tax
- $1,573 · $131/mo
- Expected delta
- +$237/yr (+$20/mo · 17.7%)
ⓘ Screening estimate from a state-policy table — verify with the county assessor before closing.
Climate risk First Street
- Flood 5/10 Major FEMA zone X (unshaded) · 24% chance over 30 yrs
- Wildfire 6/10 Major
- Heat 9/10 Extreme 7 d/yr ≥108°F today · 25 d/yr by 30 yrs out
- Wind 9/10 Extreme 99% chance of damaging wind over 30 yrs
- Air quality 1/10 Low 0 unhealthy d/yr today · 0 by 30 yrs out
Nearby sold comps map
Loading sold comps map…
Walkable amenities ~0.75 mi
Loading nearby amenities…
Taxation est. · year 1
- Rental income
- $23,390
- − Mortgage interest
- −$10,615
- − Property taxes
- −$1,336
- − Insurance
- −$948
- − Repairs & maintenance
- −$1,871
- − Management
- −$1,871
- − Depreciation
- −$5,513
- Taxable income
- $1,236
- Est. tax owed @ 24.0%
- −$297
- After-tax cash flow
- $3,973/yr
For passive investors: Depreciation is non-cash, so a rental often shows a tax loss while cash-flowing — sheltering income. Rental losses are passive: they offset passive income freely, and up to $25,000/yr can offset ordinary (W-2) income if you actively participate and your MAGI is under $100k (phasing out to $0 by $150k); unused losses carry forward. On sale, claimed depreciation is recaptured at up to 25%, and gains may owe capital-gains tax (a 1031 exchange can defer both). Figures are a year-1 estimate at your 24.0% rate — not tax advice; consult a CPA.
Schools (NCES district)
- District
- Citrus
- NCES district ID
- 1200270
- Math proficiency
- 49% ▼ -10.00%
- Reading proficiency
- 50% ▼ -6.00%
- Median HH income
- $38,618
- Composite
- 41.28/100
- National rank
- #3519
- State rank
- #44 of 73 in FL
Livability — Homosassa Springs
- Score
- 71/100
- State rank
- #391
- US rank
- #6877
Category grades
Schools grade is shown separately in the Schools card above.
Census & demographics
- Census place
- Homosassa Springs, FL
- County
- Citrus County · 111,314 people
- Metro
- Homosassa Springs, FL
- Population (ZIP)
- 10,817
- Household income
- $45,916
- Rent vs Own
- Severe rent burden
- 113.0
Population outlook (Citrus County) Hauer SSP2
- Today (2025)
- 138,622 people
- By 2030
- 136,886 · -1.3%
- By 2040
- 132,009 · -4.8%
- By 2050
- 125,196 · -9.7%
- By 2075
- 108,570 · -21.7%
- By 2100
- 84,454 · -39.1%
Race, ethnicity, and origin ACS 2023
- Neighborhood character
- Predominantly White (94%)
- Race & ethnicity
- White 94% Two or more races 3% Hispanic / Latino 3% Black 1%
- Common ancestry
- Slovak 3% Scotch-Irish 2% Lithuanian 2%
- Foreign-born
- 2% · Canada
- Languages at home
- 96% English-only · Spanish 2% Russian/Polish/Slavic 1%
Political lean MEDSL · Citrus
- 2024 margin
- Solid R (+45.9) · D 26.8% · R 72.6%
- 2008→2024 swing
- -29.8pp toward R · 2008: -16.1pp · 2024: -45.9pp
- All cycles
- 2024: R+45.9 2020: R+41.0 2016: R+39.7 2012: R+21.9 2008: R+16.1
Not yet ingested
- Civics
- —
Market trends
- HPI YoY
- ▼ -110.27%
- Current HPI
- 312.4302
- Rent YoY
- —
- Metro
- Homosassa Springs, FL
- State GDP YoY
- ▲ 3.28%
- F500 in state
- 36
Industry mix (Fortune 500 HQ in FL)
| Industry | F500 HQs | Revenue |
|---|---|---|
| Industrial Technology | 2 | $29B |
|
||
| Insurance | 2 | $17B |
|
||
| Retail | 1 | $60B |
|
||
| Technology Distribution | 1 | $58B |
|
||
| Homebuilding | 1 | $35B |
|
||
| Technology Manufacturing | 1 | $35B |
|
||
Price history
+492.2% since first listed7 events — show timeline
- 2026-05-15 Pending — RACC
- 2026-05-06 Relisted — RACC
- 2026-04-21 Delisted — RACC
- 2026-04-12 Price Changed $189,500 RACC
- 2026-02-21 Listed $199,900 RACC
- 2003-09-01 Sold (Public Records) $45,000 Public Records
- 1992-02-01 Sold (Public Records) $32,000 Public Records
Property tax history
+7.6%/yrLatest (2025): $1,336 · +9.0% YoY. Source: county tax records.
Cash-flow waterfall
monthlySold comps — $/sqft
last 12 mo · ≤1 miLoading sold comps…