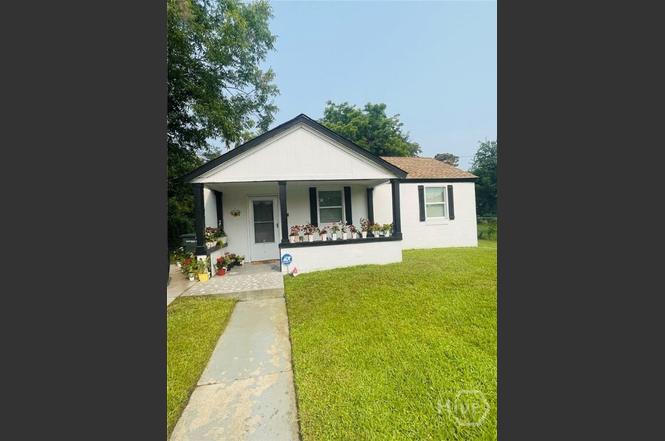
805 Carter St · Savannah, GA
Flood risk 1/10 · Minimal
- FEMA flood zone
- X (unshaded)
- Chance of flooding over 30 yrs
- 0.0%
- Est. flood insurance / yr
- $507 – $1,088
Fire risk 3/10 · Minor
- Est. fire insurance / yr
- $963 – $1,789
Heat risk 9/10 · Severe
- Hot days now (above 109°F)
- 7 days/yr
- Hot days in 30 yrs
- 18 days/yr
Wind risk 9/10 · Severe
- Chance of severe wind over 30 yrs
- 99.0%
Air-quality risk 5/10 · Moderate
- Unhealthy air days now
- 7 days/yr
- Unhealthy air days in 30 yrs
- 8 days/yr
Risk factors via First Street. Map © Google.
Why this score? — see what drove the C grade
The composite is a weighted blend of 9 inputs, each scored 0–100. Each bar is that input's sub-score; the figure is the points it added to the 100-point composite (weight × sub-score).
- Cash flow +29.8/30.0
- DSCR +10.0/10.0
- 1% rule +7.1/10.0
- Livability +4.3/5.0
- Rent growth +2.5/5.0
- Condition / age +2.5/5.0
- Schools +2.0/10.0
- ARV discount +0.0/15.0
- Appreciation +0.0/10.0
$150,000
🖨 Deal sheet (PDF) 📄 Offer letter ✓ Due diligence
Listing remarks MLS
This 2-bedroom, 1-bathroom home is a fantastic opportunity for both investors and homeowners alike. LVP flooring throughout, with a spacious yard and convenient location, just minutes from downtown and SCAD. The property has had a strong previous rental history.
Key facts
- Near shopping
- Near major roadways
- 5,009 sq ft lot
Tags
Property features AI
Exterior
- Parking: On-street parking
- Utilities: Public water; Public sewer; Underground utilities
- Home design: Single-family residence; One story
- Construction: Concrete construction
- Exterior features: Front porch; Property has a view; Lot zoned R6
Interior
- Bathrooms: 1 full bathroom
- Heating & cooling: Central electric heating; Central electric cooling
- Interior features: Electric water heater
- Laundry & utility: Washer hookup
Neighborhood map
What this means for you Summary
Snapshot
- This is a 2-bed/1.0-bath single-family listed at $150k.
Deal economics
- At list price, monthly cash flow is $552 ($7k/yr) — positive.
- The deal already cash-flows at list — no discount required.
- Meets the 1% rule at list price ($2k rent vs $150k).
- Cap rate 10.7% vs local median 4.0% in Savannah — top-decile yield for the area; either an underpriced asset or a hidden risk that comps aren't pricing in. Stress-test before assuming the spread holds.
Location & tenants
- Location reads 86/100 on livability (#1 in GA, #397 nationally) — a professional / high-income tenant draw. Strengths: crime A+, amenities A+, commute A+; Watch: employment D, schools F.
- Savannah-Chatham County (urban): math 20% / reading 26% proficiency, ranked #134 of 174 in GA (top 77%) — low school quality limits family demand, transient renter base, plan for 1-2y turnover.
- Market conditions: 78 active listings in the ZIP; 27 comparable units currently listed for rent nearby; rentals at typical pace (median 25d on market — plan ~3-4 weeks tenant-placement turnaround); 44% of comp listings sitting > 30 days — soft ceiling on asking rent; lower-income renter base — watch delinquency; 2,694 units permitted in Chatham County in 2024 (973 in 5+ unit buildings).
- At $1,815/mo this rent would consume 59% of the median local household income ($37k/yr) (locally 613% of renters already pay >50% of income on rent) — very limited rent-growth headroom before tenants either downsize or default.
Forward outlook
- Local home prices are declining (-3.0%/yr); year-one equity from $1k of loan paydown is wiped out by about $4k of value loss. Plan a longer hold.
- Chatham County population projected at +33% by 2050 — long-run rental-demand tailwind backs the buy-and-hold thesis.
- At projected returns (-3.0% appreciation + 3.0% rent growth), your $42k cash investment doubles in ~8 years — after that, you're playing with house money.
Negotiation context
- Only 4 days on market — expect competitive offers; lowballing is unlikely to land.
- 5 sale attempts since 5y ago with the ask held roughly flat each time — persistent listings suggest the price (not the market) is what's stuck; bring a comps-based counter.
Risks & watch-outs
- Watch-outs: built in 1948 — expect roof / HVAC / electrical / plumbing capex.
- Climate carrying-cost: severe wind risk, 99% chance of damaging wind over 30y; extreme-heat days projected 7→18/yr by 2055 (HVAC capex compounding) — expect insurance premiums to compound above CPI over the hold.
Questions for the listing agent
- Built in 1948 — when were the roof, HVAC, electrical panel, plumbing, and water heater last replaced?
- Is there a deadline driving the sale (1031 exchange, divorce, estate, relocation)? That informs how much negotiation room exists.
- Schools are F-rated, which usually means shorter tenancies and higher turnover. Who's the typical renter profile here, and what's been the actual vacancy rate?
- What's the average days-on-market for RENTAL listings here right now (not sales)? A rising rental-DOM trend means longer vacancies and softer asking-rent achievability than the comps imply.
- What's the recent tenant-quality profile in this submarket — average credit score on applications, eviction rate, late-payment / NSF rate, and stable-employment percentage? A property-management company in the area should have these aggregated.
- How much new for-sale + rental construction is in the pipeline within 1–3 miles? Heavy new supply typically softens prices + rents 12–24 months out; constrained supply supports both.
Investment metrics
- 1% rule
- 1.21% ✓
- Cap rate
- 10.71%
- Cash-on-cash
- 15.76%
- DSCR
- 1.70
- GRM
- 6.9
CMA / ARV
- ARV (on-the-fly)
- $107,880
- Comps found
- 9
Show comp detail 9 sales within ~0.75 mi
| Address | Dist | Beds/Ba | Sqft | Sold | Price | $/sf | Match |
|---|---|---|---|---|---|---|---|
| 815 Carter St | 0.05mi | 2/1.0 | 620 (0%) | 14mo | $108,000 | $174 | 86 |
| 805 Carter St | 0.00mi | 2/1.0 | 620 (0%) | 19mo | $135,000 | $218 | 84 |
| 803 Googe St | 0.15mi | 2/1.0 | 620 (0%) | 14mo | $155,000 | $250 | 82 |
| 14 Dutton St | 0.21mi | 2/1.0 | 672 (+8%) | 1mo | $75,000 | $112 | 76 |
| 716 Fruit St | 0.18mi | 2/1.0 | 672 (+8%) | 4mo | $60,000 | $89 | 74 |
| 812 Carver St | 0.26mi | 2/1.0 | 672 (+8%) | 23mo | $95,000 | $141 | 55 |
| 1015 Porter St | 0.37mi | 2/1.0 | 676 (+9%) | 18mo | $125,000 | $185 | 53 |
| 1007 1/2 Hearn St | 0.40mi | 2/1.0 | 672 (+8%) | 20mo | $95,000 | $141 | 50 |
| 1528 Comer St | 0.74mi | 2/1.0 | 672 (+8%) | 12mo | $200,000 | $298 | 41 |
Match score weights: distance 35% · size 25% · config 20% · recency 20%. Top-matched comps best support the ARV.
Projected returns pro-forma
-3.0% appreciation · 3.0% rent growth · sell at horizon
- IRR
- 6.6%
- Equity multiple
- 1.26×
- Total profit
- $10,758
- Equity at exit
- $22,365
- IRR
- 15.9%
- Equity multiple
- 2.29×
- Total profit
- $54,332
- Equity at exit
- $12,969
Cash invested: $42,000 (down + closing). Projections, not guarantees.
Landlord ↔ Tenant lean methodology
- Overall (STATE)
- 90 Strongly Landlord-Friendly
- State Georgia
- 90 Strongly Landlord-Friendly · R+3
- County
- — inherits STATE
- City
- — inherits STATE
ZIP-level market 31415
- Home prices YoY
- -21.4%
- Active inventory
- 78
- Price-to-rent
- 6.9×
Monthly cashflow live
- Estimated rent
- $1,815 high interval (Pro) →
- Mortgage (P&I)
- −$787
- Tax from tax record
- −$33 /mo · $397/yr
- Insurance
- −$62
- HOA
- −$0
- Vacancy / Maint / Mgmt
- −$381
- Net cashflow
- $552
Break-even live
Sensitivity live
| Price | -10% $637 | -5% $594 | +0% $552 | +5% $509 | +10% $467 |
|---|---|---|---|---|---|
| Rent | -10% $408 | -5% $480 | +0% $552 | +5% $623 | +10% $695 |
| Rate | -1.0pp $627 | -0.5pp $590 | base $552 | +0.5pp $513 | +1.0pp $473 |
UW: 25.0% down · 7.5% · 30yr · 1.5% tax · 5.0% vac · 8.0% maint · 8.0% mgmt
Financing live
Cash to close
- Down payment
- $37,500
- Closing costs
- $4,500
- Reserves months
- —
- Total cash needed
- —
Loan-product check · same deal, 3 products live
Conventional
25% down · 7.5% · 30yr
- Down + closing
- —
- Monthly P&I
- —
- Monthly cashflow
- —
- DSCR
- —
- Eligible?
- —
Personal DTI + credit; lowest rate.
DSCR
20% down · 8.5% · 30yr
- Down + closing
- —
- Monthly P&I
- —
- Monthly cashflow
- —
- DSCR
- —
- Eligible?
- —
No personal income docs; deal must DSCR.
Hard money
10% down · 12.0% · 12mo
- Down + closing
- —
- Monthly P&I
- —
- Monthly cashflow
- —
- DSCR
- —
- Eligible?
- —
Short-term bridge; refi at stabilization.
Rent comps 27 comps
| Address | Beds | Baths | Sqft | Rent | $/sqft | DOM | Units | Dist |
|---|---|---|---|---|---|---|---|---|
| 1402 Comer St Savannah, GA | 2.0 | 1.0 | 690 | $1,200 | $1.74 | 45d | 1 | 0.64mi |
| 40 Eagle St Savannah, GA | 1.0–2.0 | 1.0 | 841 | $1,331 | $1.58 | 25d | 6 | 0.79mi |
| 1415 Richards St Savannah, GA | 2.0 | 1.0 | 672 | $1,200 | $1.79 | 45d | 1 | 0.84mi |
| 1419 Richards St Savannah, GA | 2.0 | 1.0 | 672 | $1,200 | $1.79 | 45d | 1 | 0.84mi |
| 1421 Richards St Savannah, GA | 2.0 | 1.0 | 672 | $1,275 | $1.90 | 45d | 1 | 0.84mi |
| 1423 Richards St Savannah, GA | 2.0 | 1.0 | 672 | $1,275 | $1.90 | 45d | 1 | 0.84mi |
| 540 Selma St Savannah, GA | 2.0–5.0 | 2.0–5.0 | 790 | $949 | $1.20 | 25d | 1 | 0.97mi |
| 2100 Patch St Savannah, GA | 2.0 | 1.0 | 672 | $1,525 | $2.27 | 45d | 1 | 1.04mi |
| 2108 Bulloch St Savannah, GA | 2.0 | 1.0 | 638 | $1,095 | $1.72 | 25d | 1 | 1.08mi |
| 615 Montgomery St Savannah, GA | 1.0–2.0 | 1.0–2.0 | 902 | $3,164 | $3.51 | 15d | 18 | 1.12mi |
| 416 W Wayne St Savannah, GA | 1.0 | 1.0 | 650 | $1,500 | $2.31 | 15d | 1 | 1.14mi |
| 1418 Montgomery St Savannah, GA | 2.0 | 1.0–2.0 | 576 | $1,900 | $3.30 | 15d | 13 | 1.20mi |
| 217 W Taylor St Savannah, GA | 2.0 | 1.0 | 675 | $2,900 | $4.30 | 25d | 1 | 1.24mi |
| 916 Howard St Unit 1386554P Savannah, GA | 1.0 | 1.0 | 495 | $3,534 | $7.14 | 45d | 1 | 1.29mi |
| 205 W Jones Ln Savannah, GA | 1.0 | 1.0 | 500 | $1,900 | $3.80 | 45d | 1 | 1.30mi |
| 106 W Gwinnett St Savannah, GA | 1.0 | 1.0 | 380 | $1,550 | $4.08 | 15d | 1 | 1.30mi |
| 805 Whitaker St #2 Savannah, GA | 1.0 | 1.0 | 723 | $2,500 | $3.46 | 25d | 1 | 1.30mi |
| 601 Indian St Savannah, GA | 2.0 | 1.0–2.0 | 816 | $3,521 | $4.31 | 15d | 19 | 1.37mi |
| 630 Indian St Savannah, GA | 2.0 | 1.0–2.0 | 824 | $3,125 | $3.79 | 15d | 17 | 1.41mi |
| 316 W 40th St Unit E Savannah, GA | 2.0 | 1.5 | 700 | $1,500 | $2.14 | 22d | 1 | 1.45mi |
| 316 W 40th St Unit D Savannah, GA | 2.0 | 1.0 | 700 | $1,500 | $2.14 | 22d | 1 | 1.45mi |
| 804 Drayton St Unit 1 Savannah, GA | 1.0 | 1.0 | 647 | $2,800 | $4.33 | 46d | 1 | 1.46mi |
| 804 Drayton St Unit 3 Savannah, GA | 1.0 | 1.0 | 647 | $2,600 | $4.02 | 46d | 1 | 1.46mi |
| 105 E Gwinnett St Unit 2 Savannah, GA | 1.0 | 1.0 | 647 | $2,500 | $3.86 | 45d | 1 | 1.47mi |
| 8 E 33rd St Unit B Savannah, GA | 1.0 | 1.0 | 558 | $1,500 | $2.69 | 15d | 1 | 1.48mi |
| 17 E 31st St Savannah, GA | 1.0–2.0 | 1.0–2.0 | 848 | $2,940 | $3.46 | 15d | 12 | 1.49mi |
| 110 E Duffy St Savannah, GA | 1.0 | 1.0 | 500 | $1,650 | $3.30 | 45d | 1 | 1.49mi |
Listing history 3 events
-
2026-06-21days on market $150,000 Active 4 DOM
-
2026-06-17remarks 385-char remark
-
2026-06-17$150,000 Active 1 DOM
ⓘ Source: listings_history table (triggers on properties + properties_extension) + one-shot
backfill from property_details.listing_events for pre-trigger history.
Tax reassessment forecast GA · Resets to sale price
- Current annual tax
- $397 · $33/mo
- Projected year-2 tax
- $1,380 · $115/mo
- Expected delta
- +$983/yr (+$82/mo · 247.3%)
ⓘ Screening estimate from a state-policy table — verify with the county assessor before closing.
Climate risk First Street
- Flood 1/10 Low FEMA zone X (unshaded) · 0% chance over 30 yrs
- Wildfire 3/10 Moderate
- Heat 9/10 Extreme 7 d/yr ≥109°F today · 18 d/yr by 30 yrs out
- Wind 9/10 Extreme 99% chance of damaging wind over 30 yrs
- Air quality 5/10 Major 7 unhealthy d/yr today · 8 by 30 yrs out
Nearby sold comps map
Loading sold comps map…
Walkable amenities ~0.75 mi
Loading nearby amenities…
Taxation est. · year 1
- Rental income
- $21,780
- − Mortgage interest
- −$8,402
- − Property taxes
- −$397
- − Insurance
- −$750
- − Repairs & maintenance
- −$1,742
- − Management
- −$1,742
- − Depreciation
- −$4,364
- Taxable income
- $4,382
- Est. tax owed @ 24.0%
- −$1,052
- After-tax cash flow
- $5,568/yr
For passive investors: Depreciation is non-cash, so a rental often shows a tax loss while cash-flowing — sheltering income. Rental losses are passive: they offset passive income freely, and up to $25,000/yr can offset ordinary (W-2) income if you actively participate and your MAGI is under $100k (phasing out to $0 by $150k); unused losses carry forward. On sale, claimed depreciation is recaptured at up to 25%, and gains may owe capital-gains tax (a 1031 exchange can defer both). Figures are a year-1 estimate at your 24.0% rate — not tax advice; consult a CPA.
Schools (NCES district)
- District
- Savannah-Chatham County
- NCES district ID
- 1301020
- Math proficiency
- 20% ▼ -11.00%
- Reading proficiency
- 26% ▼ -5.00%
- Median HH income
- $47,443
- Composite
- 20.14/100
- National rank
- #8639
- State rank
- #134 of 174 in GA
Livability — Savannah
- Score
- 86/100
- State rank
- #1
- US rank
- #397
Category grades
Schools grade is shown separately in the Schools card above.
Census & demographics
- Census place
- Savannah, GA
- County
- Chatham County · 271,602 people
- City population
- 216,564
- Metro
- Savannah, GA
- Population (ZIP)
- 11,082
- Household income
- $37,109
- Rent vs Own
- Severe rent burden
- 613.0
Population outlook (Chatham County) Hauer SSP2
- Today (2025)
- 332,584 people
- By 2030
- 355,508 · +6.9%
- By 2040
- 400,030 · +20.3%
- By 2050
- 443,019 · +33.2%
- By 2075
- 534,579 · +60.7%
- By 2100
- 583,863 · +75.6%
Race, ethnicity, and origin ACS 2023
- Neighborhood character
- Predominantly Black (89%)
- Race & ethnicity
- Black 89% White 5% Hispanic / Latino 5% Two or more races 3%
- Foreign-born
- 2% · Canada
- Languages at home
- 95% English-only · Spanish 4%
Political lean MEDSL · Chatham
- 2024 margin
- D (+18.0) · D 58.6% · R 40.6%
- 2008→2024 swing
- +3.6pp toward D · 2008: 14.4pp · 2024: 18.0pp
- All cycles
- 2024: D+18.0 2020: D+18.8 2016: D+14.5 2012: D+12.0 2008: D+14.4
Not yet ingested
- Civics
- —
Market trends
- HPI YoY
- ▼ -55.36%
- Current HPI
- 203.0696
- Rent YoY
- —
- Metro
- Savannah, GA
- State GDP YoY
- ▲ 2.66%
- F500 in state
- 28
Industry mix (Fortune 500 HQ in GA)
| Industry | F500 HQs | Revenue |
|---|---|---|
| Paper / Packaging | 2 | $29B |
|
||
| Retail | 1 | $160B |
|
||
| Transportation / Logistics | 1 | $91B |
|
||
| Airlines | 1 | $62B |
|
||
| Consumer Goods | 1 | $47B |
|
||
| Utilities | 1 | $25B |
|
||
Price history
+376.2% since first listed12 events — show timeline
- 2026-06-14 Listed $150,000 Hive MLS
- 2024-11-26 Sold (Public Records) $135,000 Public Records
- 2024-11-21 Sold (MLS) $135,000 Hive MLS
- 2024-10-11 Sold (Public Records) $100,000 Public Records
- 2024-10-10 Listed $137,500 Hive MLS
- 2024-10-10 Listed $137,500 Hive MLS
- 2024-09-11 Listing Removed — Hive MLS
- 2024-07-21 Listed $140,000 Hive MLS
- 2022-03-08 Sold (Public Records) $98,000 Public Records
- 2022-02-03 Sold (MLS) $98,000 Hive MLS
- 2021-12-13 Listed $105,000 Hive MLS
- 1998-01-08 Sold (Public Records) $31,500 Public Records
Property tax history
+1.0%/yrLatest (2025): $397 · -73.7% YoY. Source: county tax records.
Cash-flow waterfall
monthlySold comps — $/sqft
last 12 mo · ≤1 miLoading sold comps…