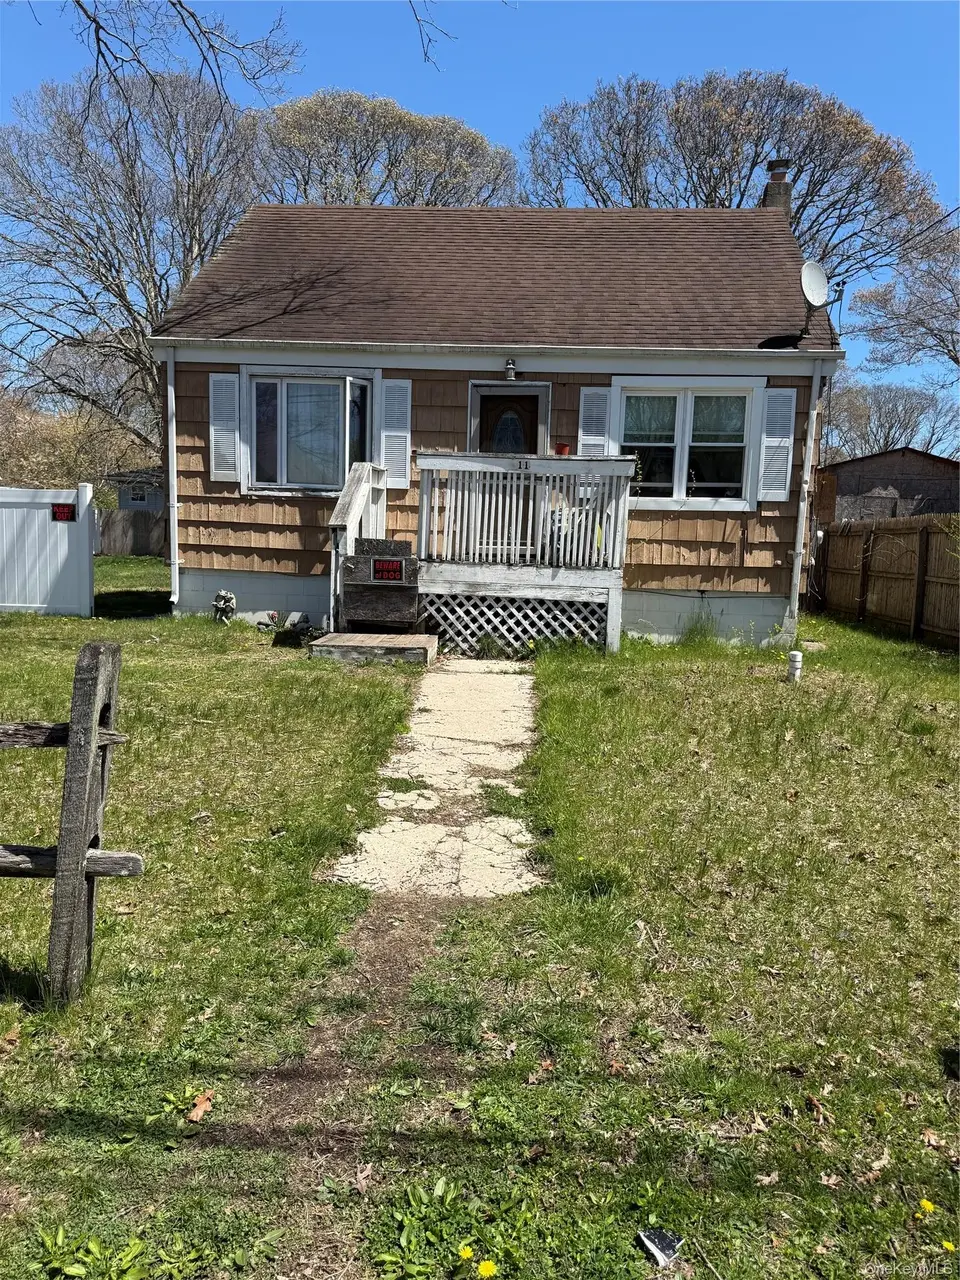
11 George Dr · Mastic, NY
Flood risk 1/10 · Minimal
- FEMA flood zone
- X (unshaded)
- Chance of flooding over 30 yrs
- 0.0%
- Est. flood insurance / yr
- $473 – $860
Fire risk 2/10 · Minimal
- Est. fire insurance / yr
- $691 – $1,283
Heat risk 4/10 · Minor
- Hot days now (above 92°F)
- 7 days/yr
- Hot days in 30 yrs
- 19 days/yr
Wind risk 8/10 · Major
- Chance of severe wind over 30 yrs
- 80.0%
Air-quality risk 4/10 · Minor
- Unhealthy air days now
- 3 days/yr
- Unhealthy air days in 30 yrs
- 5 days/yr
Risk factors via First Street. Map © Google.
Why this score? — see what drove the C+ grade
The composite is a weighted blend of 9 inputs, each scored 0–100. Each bar is that input's sub-score; the figure is the points it added to the 100-point composite (weight × sub-score).
- Cash flow +21.7/30.0
- ARV discount +15.0/15.0
- DSCR +6.9/10.0
- Schools +4.7/10.0
- 1% rule +4.6/10.0
- Livability +3.2/5.0
- Rent growth +2.5/5.0
- Condition / age +2.5/5.0
- Appreciation +0.0/10.0
$400,000
🖨 Deal sheet 📄 Offer letter ✓ Due diligence
Listing remarks
Charming 4-bedroom Cape-style home full of potential! This fixer-upper is perfect for buyers looking to add their personal touch and build equity with cosmetic updates. Major improvements have already been taken care of, including a new roof, new hot water heater, updated furnace, upgraded electrical, 9 new windows and new insulation—giving you peace of mind on the big-ticket items. The home offers a functional layout and a large backyard—ideal for entertaining, gardening, or future expansion. Conveniently located within walking distance to a shopping center, making everyday errands a breeze. Just 6 miles from Smith Point Beach, you can enjoy coastal living and all the outdoor r
Key facts
- Upgraded electrical
- New hot water heater
- 9 new windows
Tags
Property features AI
Exterior
- Parking: Driveway parking
- Utilities: Cesspool sewer; Electricity connected; Public trash collection; Water connected
- Home design: Single-family residence
- Construction: Frame construction
- Exterior features: Frame construction; Not waterfront
Interior
- Kitchen: Electric cooktop; Electric oven; Oven; Refrigerator
- Bedrooms: Includes a first-floor bedroom
- Bathrooms: One full bathroom
- Heating & cooling: Oil heating; No central cooling
- Interior features: First-floor bedroom; First-floor full bathroom; Bilco basement access
Neighborhood map
What this means for you Summary
Snapshot
- This is a 4-bed/1.0-bath single-family listed at $400k.
Deal economics
- At list price, monthly cash flow is $614 ($7k/yr) — positive.
- The deal already cash-flows at list — no discount required.
- To meet the 1% rule (rent ≥ 1% of price), the offer needs to be $384k (4.0% below list).
- Recommended offer: $384k (4.0% below list) — sets the bar for 1% rule.
- Cap rate 8.1% vs local median 4.7% in Mastic — top-decile yield for the area; either an underpriced asset or a hidden risk that comps aren't pricing in. Stress-test before assuming the spread holds.
Location & tenants
- Location reads 63/100 on livability (#816 in NY) — a middle-class / working-renter tenant base. Strengths: employment A+, housing A+, health & safety B; Watch: crime D, amenities F, commute F.
- William Floyd Union Free School District (suburban): math 48% / reading 57% proficiency, ranked #309 of 590 in NY (top 52%) — acceptable for families but not a draw, mixed tenant base, ~2y average lease.
- Zoned schools: Moriches Elementary School (math 52% / reading 57%, grade C, #908 of 2,108 statewide, top 46%, 822 students, 57% FRL); William Floyd Middle School (math 36% / reading 47%, grade F, #394 of 729 statewide, top 55%, 1,053 students, 54% FRL); William Floyd High School (math 65% / reading 87%, grade A-, #616 of 1,100 statewide, top 57%, 3,013 students, 54% FRL).
- Market conditions: 100 active listings in the ZIP; 5 comparable units currently listed for rent nearby; rentals at typical pace (median 19d on market — plan ~3-4 weeks tenant-placement turnaround); 1,366 units permitted in Suffolk County in 2024 (216 in 5+ unit buildings).
Forward outlook
- Local home prices are declining (-3.0%/yr); year-one equity from $3k of loan paydown is wiped out by about $12k of value loss. Plan a longer hold.
- Suffolk County population projected to shrink 5% by 2050 — rents likely to lag national; underwrite the cash flow, not the appreciation.
Negotiation context
- It's been on market 15 days — a 2% lower offer ($394k) is reasonable based on typical stale-listing flexibility.
Risks & watch-outs
- Watch-outs: built in 1950 — expect roof / HVAC / electrical / plumbing capex.
- Climate carrying-cost: severe wind risk, 80% chance of damaging wind over 30y — expect insurance premiums to compound above CPI over the hold.
Questions for the listing agent
- Built in 1950 — when were the roof, HVAC, electrical panel, plumbing, and water heater last replaced?
- Is there a deadline driving the sale (1031 exchange, divorce, estate, relocation)? That informs how much negotiation room exists.
- Schools are F-rated, which usually means shorter tenancies and higher turnover. Who's the typical renter profile here, and what's been the actual vacancy rate?
- Crime grade is D in this area — have there been break-ins, vandalism, or insurance claims at this property in the last 3 years? What carrier currently insures it and at what premium?
- What's the average days-on-market for RENTAL listings here right now (not sales)? A rising rental-DOM trend means longer vacancies and softer asking-rent achievability than the comps imply.
- What's the recent tenant-quality profile in this submarket — average credit score on applications, eviction rate, late-payment / NSF rate, and stable-employment percentage? A property-management company in the area should have these aggregated.
- How much new for-sale + rental construction is in the pipeline within 1–3 miles? Heavy new supply typically softens prices + rents 12–24 months out; constrained supply supports both.
Investment metrics
- 1% rule
- 0.96% ✗
- Cap rate
- 8.14%
- Cash-on-cash
- 6.58%
- DSCR
- 1.29
- GRM
- 8.7
CMA / ARV
- ARV (median comp)
- $503,192
- List price
- $400,000
- Delta
- -20.51%
- Verdict
- UNDERPRICED
- Comps
- 20 within 1.0 mi
Show comp detail 12 sales within ~0.75 mi
| Address | Dist | Beds/Ba | Sqft | Sold | Price | $/sf | Match |
|---|---|---|---|---|---|---|---|
| 25 Gores Dr | 0.25mi | 4/1.5 | 1,165 (+3%) | 1mo | $425,000 | $365 | 81 |
| 22 Garden Pl | 0.37mi | 4/2.5 | 1,182 (+5%) | 3mo | $475,000 | $402 | 67 |
| 70 Patchogue Ave | 0.47mi | 3/2.0 (-1) | 1,130 (+0%) | 5mo | $496,500 | $439 | 65 |
| 29 Wood Ave | 0.26mi | 3/2.0 (-1) | 1,200 (+6%) | 7mo | $495,000 | $413 | 63 |
| 14 Hawthorne St | 0.32mi | 3/2.0 (-1) | 1,200 (+6%) | 7mo | $500,000 | $417 | 60 |
| 97 Maple Ave | 0.68mi | 3/1.0 (-1) | 1,152 (+2%) | 4mo | $403,000 | $350 | 56 |
| 99 Grand Ave | 0.60mi | 3/1.0 (-1) | 1,075 (-5%) | 4mo | $460,000 | $428 | 55 |
| 71 Oak Ave | 0.75mi | 3/1.5 (-1) | 1,056 (-6%) | 1mo | $475,000 | $450 | 46 |
| 2 Dreamland St | 0.69mi | 3/1.0 (-1) | 1,058 (-6%) | 9mo | $525,000 | $496 | 45 |
| 38 Midland Ave | 0.67mi | 3/1.0 (-1) | 1,008 (-11%) | 2mo | $405,000 | $402 | 44 |
| 48 Forrest Ave | 0.70mi | 3/2.0 (-1) | 1,075 (-5%) | 9mo | $450,000 | $419 | 43 |
| 68 Ostend Cir | 0.68mi | 3/2.0 (-1) | 1,277 (+13%) | 7mo | $630,000 | $493 | 32 |
Match score weights: distance 35% · size 25% · config 20% · recency 20%. Top-matched comps best support the ARV.
Projected returns pro-forma
-3.0% appreciation · 3.0% rent growth · sell at horizon
- IRR
- -6.2%
- Equity multiple
- 0.77×
- Total profit
- $-25,860
- Equity at exit
- $59,641
- IRR
- 3.4%
- Equity multiple
- 1.24×
- Total profit
- $27,219
- Equity at exit
- $34,585
Cash invested: $112,000 (down + closing). Projections, not guarantees.
Landlord ↔ Tenant lean methodology
- Overall (STATE)
- 15 Strongly Tenant-Friendly
- State New York
- 15 Strongly Tenant-Friendly · D+10
- County
- — inherits STATE
- City
- — inherits STATE
ZIP-level market 11950
- Home prices YoY
- -33.2%
- Active inventory
- 100
- Price-to-rent
- 8.7×
Monthly cashflow live
- Estimated rent
- $3,841 high interval (Pro) →
- Mortgage (P&I)
- −$2,098
- Tax from tax record
- −$156 /mo · $1,872/yr
- Insurance
- −$167
- HOA
- −$0
- Vacancy / Maint / Mgmt
- −$807
- Net cashflow
- $614
Break-even live
UW: 25.0% down · 7.5% · 30yr · 1.5% tax · 5.0% vac · 8.0% maint · 8.0% mgmt
Financing live
Cash to close
- Down payment
- $100,000
- Closing costs
- $12,000
- Reserves months
- —
- Total cash needed
- —
Loan-product check · same deal, 3 products live
Conventional
25% down · 7.5% · 30yr
- Down + closing
- —
- Monthly P&I
- —
- Monthly cashflow
- —
- DSCR
- —
- Eligible?
- —
Personal DTI + credit; lowest rate.
DSCR
20% down · 8.5% · 30yr
- Down + closing
- —
- Monthly P&I
- —
- Monthly cashflow
- —
- DSCR
- —
- Eligible?
- —
No personal income docs; deal must DSCR.
Hard money
10% down · 12.0% · 12mo
- Down + closing
- —
- Monthly P&I
- —
- Monthly cashflow
- —
- DSCR
- —
- Eligible?
- —
Short-term bridge; refi at stabilization.
Rent comps 5 comps
| Address | Beds | Baths | Sqft | Rent | $/sqft | DOM | Units | Dist |
|---|---|---|---|---|---|---|---|---|
| 14 Titmus Dr Mastic, NY | 4.0 | 1.0 | 1428 | $3,800 | $2.66 | 43d | 1 | 0.26mi |
| 61 Gores Dr Mastic, NY | 4.0 | 2.0 | 1397 | $4,200 | $3.01 | 1d | 1 | 0.33mi |
| 35 Auborn Ave Shirley, NY | 3.0 | 1.0 | 1140 | $3,700 | $3.25 | 1d | 1 | 0.98mi |
| 61 Montgomery Ave Mastic, NY | 3.0 | 2.0 | 1025 | $3,400 | $3.32 | 19d | 1 | 0.99mi |
| 48 Eleanor Ave Mastic, NY | 3.0 | 1.0 | 975 | $3,500 | $3.59 | 24d | 1 | 1.38mi |
Listing history 2 events
-
2026-05-13status Pending 855-char remark
-
2026-04-27$400,000 Active 855-char remark
ⓘ Source: listings_history table (triggers on properties + properties_extension) + one-shot
backfill from property_details.listing_events for pre-trigger history.
Tax reassessment forecast NY · Partial reset (capped growth)
- Current annual tax
- $1,872 · $156/mo
- Projected year-2 tax
- $4,316 · $360/mo
- Expected delta
- +$2,444/yr (+$204/mo · 130.5%)
ⓘ Screening estimate from a state-policy table — verify with the county assessor before closing.
Climate risk First Street
- Flood 1/10 Low FEMA zone X (unshaded) · 0% chance over 30 yrs
- Wildfire 2/10 Low
- Heat 4/10 Moderate 7 d/yr ≥92°F today · 19 d/yr by 30 yrs out
- Wind 8/10 Severe 80% chance of damaging wind over 30 yrs
- Air quality 4/10 Moderate 3 unhealthy d/yr today · 5 by 30 yrs out
Nearby sold comps map
Loading sold comps map…
Walkable amenities ~0.75 mi
Loading nearby amenities…
Taxation est. · year 1
- Rental income
- $46,092
- − Mortgage interest
- −$22,406
- − Property taxes
- −$1,872
- − Insurance
- −$2,000
- − Repairs & maintenance
- −$3,687
- − Management
- −$3,687
- − Depreciation
- −$11,636
- Taxable income
- $803
- Est. tax owed @ 24.0%
- −$193
- After-tax cash flow
- $7,176/yr
For passive investors: Depreciation is non-cash, so a rental often shows a tax loss while cash-flowing — sheltering income. Rental losses are passive: they offset passive income freely, and up to $25,000/yr can offset ordinary (W-2) income if you actively participate and your MAGI is under $100k (phasing out to $0 by $150k); unused losses carry forward. On sale, claimed depreciation is recaptured at up to 25%, and gains may owe capital-gains tax (a 1031 exchange can defer both). Figures are a year-1 estimate at your 24.0% rate — not tax advice; consult a CPA.
Schools (NCES district)
- District
- William Floyd Union Free School District
- NCES district ID
- 3618690
- Math proficiency
- 48% ▲ 3.00%
- Reading proficiency
- 57% ▲ 11.00%
- Median HH income
- $70,564
- Composite
- 46.79/100
- National rank
- #2383
- State rank
- #309 of 590 in NY
Livability — Mastic
- Score
- 63/100
- State rank
- #816
- US rank
- #15786
Category grades
Schools grade is shown separately in the Schools card above.
Census & demographics
- Census place
- Mastic, NY
- City population
- 16,944
- Population (ZIP)
- 16,944
Population outlook (Suffolk County) Hauer SSP2
- Today (2025)
- 1,505,262 people
- By 2030
- 1,498,318 · -0.5%
- By 2040
- 1,471,101 · -2.3%
- By 2050
- 1,424,848 · -5.3%
- By 2075
- 1,337,157 · -11.2%
- By 2100
- 1,217,720 · -19.1%
Race, ethnicity, and origin ACS 2023
- Neighborhood character
- Diverse neighborhood (Simpson 0.59)
- Race & ethnicity
- White 55% Hispanic / Latino 30% Two or more races 15% Black 7% Native American 2% Asian 1%
- Hispanic origin (detail)
- Mexican 6% Puerto Rican 8%
- Common ancestry
- Romanian 3% Scotch-Irish 1%
- Foreign-born
- 18% · Canada, Jamaica
- Languages at home
- 72% English-only · Spanish 20% Other Indo-European 3% Russian/Polish/Slavic 2%
Political lean MEDSL · Suffolk
- 2024 margin
- Lean R (+10.0) · D 45.0% · R 55.0%
- 2008→2024 swing
- -16.0pp toward R · 2008: 6.0pp · 2024: -10.0pp
- All cycles
- 2024: R+10.0 2020: R+0.0 2016: R+8.2 2012: D+2.9 2008: D+6.0
Not yet ingested
- Civics
- —
Market trends
- HPI YoY
- ▼ -228.55%
- Current HPI
- 460.0878
- Rent YoY
- —
- Metro
- —
- State GDP YoY
- ▲ 2.60%
- F500 in state
- 92
Industry mix (Fortune 500 HQ in NY)
| Industry | F500 HQs | Revenue |
|---|---|---|
| Financial Services | 10 | $950B |
|
||
| Consumer Goods | 9 | $162B |
|
||
| Insurance | 4 | $225B |
|
||
| Telecommunications | 2 | $144B |
|
||
| Pharmaceuticals | 2 | $112B |
|
||
| Media / Entertainment | 2 | $69B |
|
||
Price history
2 events — show timeline
- 2026-05-13 Pending — OneKey® MLS as Distributed by MLS Grid
- 2026-04-27 Listed $400,000 OneKey® MLS as Distributed by MLS Grid
Property tax history
-5.2%/yrLatest (2025): $1,872 · +0.0% YoY. Source: county tax records.
Cash-flow waterfall
monthlySold comps — $/sqft
last 12 mo · ≤1 miLoading sold comps…