 Multi-family
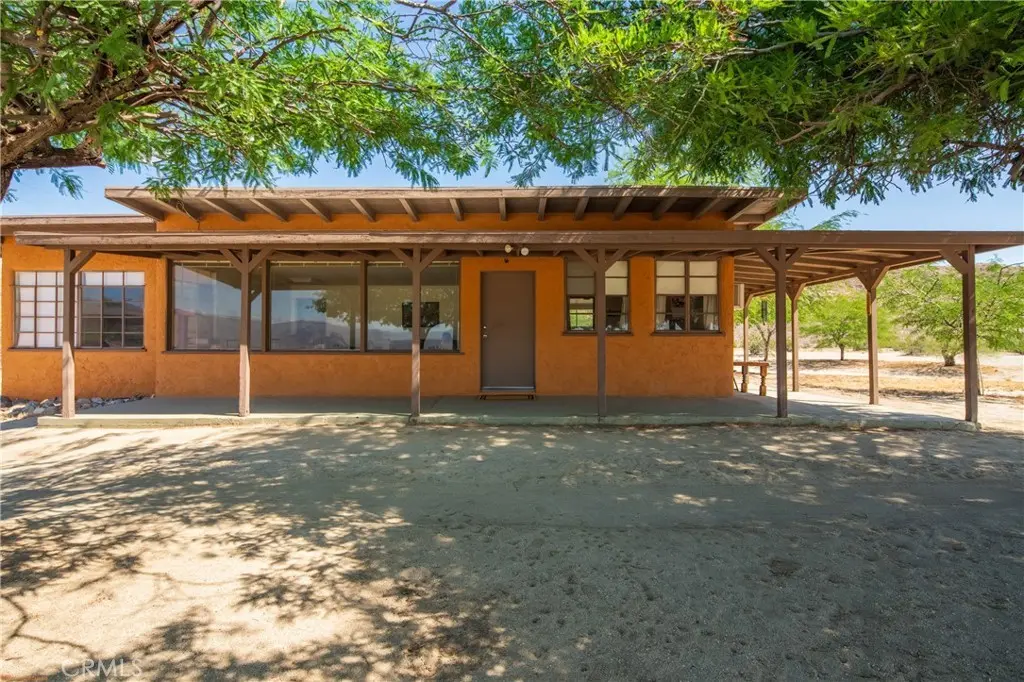
2315 Henderson Cyn · Borrego Springs, CA
Flood risk 1/10 · Minimal
- FEMA flood zone
- X (unshaded)
- Chance of flooding over 30 yrs
- 0.0%
- Est. flood insurance / yr
- $507 – $1,088
Fire risk 1/10 · Minimal
- Est. fire insurance / yr
- $659 – $1,223
Heat risk 9/10 · Severe
- Hot days now (above 111°F)
- 7 days/yr
- Hot days in 30 yrs
- 22 days/yr
Wind risk 1/10 · Minimal
- Chance of severe wind over 30 yrs
- —
Air-quality risk 3/10 · Minor
- Unhealthy air days now
- 3 days/yr
- Unhealthy air days in 30 yrs
- 3 days/yr
Risk factors via First Street. Map © Google.
Why this score? — see what drove the C- grade
The composite is a weighted blend of 9 inputs, each scored 0–100. Each bar is that input's sub-score; the figure is the points it added to the 100-point composite (weight × sub-score).
- Cash flow +18.4/30.0
- ARV discount +15.0/15.0
- DSCR +5.8/10.0
- 1% rule +3.7/10.0
- Livability +2.9/5.0
- Schools +2.6/10.0
- Rent growth +2.5/5.0
- Condition / age +2.5/5.0
- Appreciation +0.0/10.0
$475,000
🖨 Deal sheet 📄 Offer letter ✓ Due diligence
Multi-family units
County records classify this as Multi-Family (2-4 Unit). Listing-text estimate: 1 unit. estimate disagrees with records
Listing remarks
Two Homes on Nearly Five Fully Fenced Acres with Expansive Desert Views. A rare opportunity to own two homes on almost five fully fenced acres, complete with a private well, wide-open desert vistas, and exceptional space and privacy. This setup would work well for an artist retreat or launching point for your unique desert experience. The main house offers 2 bedrooms (one currently configured as a den with a wet bar) and 1 bathroom, plus an indoor laundry room. Saltillo tile flooring enhances the kitchen, laundry room, hallway, and bathroom, while a cozy carpet inset warms the living room. The guest house features a comfortable 1-bedroom, 1-bathroom layout with an inviting open-concept livi
Key facts
- 4.72 acre lot
- 2 garage spots
- Built 1949
Property features AI
Finance
- HOA & community: Rural community with nearby hiking
Exterior
- Parking: Attached garage; 2 garage spaces; Additional parking: driveway (including unpaved) and detached carport
- Utilities: Septic tank sewer; Well water
- Home design: House; Single-story; Property includes an ADU (1 accessory unit); Has a view
- Construction: No common walls
- Exterior features: Wrap-around porch; Has a patio; No pool
Interior
- Bedrooms: 3 bedrooms on main level
- Flooring: Tile flooring; Carpet flooring
- Bathrooms: 2 full bathrooms; Shower-in-tub combos
- Heating & cooling: Wall/window cooling; Evaporative cooling
- Interior features: Level entry; One story; All bedrooms on main level; Main level has 3 bedrooms and 2 bathrooms
- Laundry & utility: Indoor laundry in a dedicated room
Neighborhood map
What this means for you Summary
Snapshot
- This is a 3-bed/2.0-bath multifamily listed at $475k.
Deal economics
- At list price, monthly cash flow is $446 ($5k/yr) — positive.
- The deal already cash-flows at list — no discount required.
- To meet the 1% rule (rent ≥ 1% of price), the offer needs to be $413k (13.1% below list).
- Recommended offer: $413k (13.1% below list) — sets the bar for 1% rule.
- Cap rate 7.4% vs local median 6.0% in Borrego Springs — meaningfully above typical; check what's discounted (condition, days-on-market, listing class) to confirm the premium yield is real.
Location & tenants
- Location reads 58/100 on livability (#712 in CA) — a working-class tenant base; expect higher turnover. Strengths: crime A+, employment A+, housing A+; Watch: schools F, amenities F, commute F.
- Borrego Springs Unified (rural): math 20% / reading 35% proficiency, ranked #1,120 of 1,400 in CA (top 80%) — low school quality limits family demand, transient renter base, plan for 1-2y turnover; 72% free/reduced lunch — lower-income household profile, screen leases tightly.
- Market conditions: 174 active listings in the ZIP; 11,759 units permitted in San Diego County in 2024 (7,244 in 5+ unit buildings).
Forward outlook
- Local home prices are declining (-3.0%/yr); year-one equity from $3k of loan paydown is wiped out by about $14k of value loss. Plan a longer hold.
- San Diego County population projected at +20% by 2050 — long-run rental-demand tailwind backs the buy-and-hold thesis.
Negotiation context
- It's been on market 52 days — a 3% lower offer ($461k) is reasonable based on typical stale-listing flexibility.
- 2 sale attempts since 2y ago with the ask held roughly flat each time — persistent listings suggest the price (not the market) is what's stuck; bring a comps-based counter.
Risks & watch-outs
- Watch-outs: built in 1949 — expect roof / HVAC / electrical / plumbing capex.
- Climate carrying-cost: extreme-heat days projected 7→22/yr by 2055 (HVAC capex compounding) — expect insurance premiums to compound above CPI over the hold.
Questions for the listing agent
- It's been on market 52 days. Have you received any prior offers? Is the seller open to a 13% concession, seller financing, or rate buy-down credit?
- Built in 1949 — when were the roof, HVAC, electrical panel, plumbing, and water heater last replaced?
- Is there a deadline driving the sale (1031 exchange, divorce, estate, relocation)? That informs how much negotiation room exists.
- Schools are F-rated, which usually means shorter tenancies and higher turnover. Who's the typical renter profile here, and what's been the actual vacancy rate?
- What's the average days-on-market for RENTAL listings here right now (not sales)? A rising rental-DOM trend means longer vacancies and softer asking-rent achievability than the comps imply.
- What's the recent tenant-quality profile in this submarket — average credit score on applications, eviction rate, late-payment / NSF rate, and stable-employment percentage? A property-management company in the area should have these aggregated.
- How much new apartment / multifamily construction is in the pipeline within 1–3 miles? Heavy new supply (>2% of stock underway) typically softens rents 12–24 months out; light construction supports rent growth.
Investment metrics
- 1% rule
- 0.87% ✗
- Cap rate
- 7.42%
- Cash-on-cash
- 4.03%
- DSCR
- 1.18
- GRM
- 9.6
CMA / ARV
- ARV (median comp)
- $836,542
- List price
- $475,000
- Delta
- -43.22%
- Verdict
- UNDERPRICED
- Comps
- 1 within 2.0 mi
Projected returns pro-forma
-3.0% appreciation · 3.0% rent growth · sell at horizon
- IRR
- -10.0%
- Equity multiple
- 0.63×
- Total profit
- $-48,758
- Equity at exit
- $70,824
- IRR
- -0.7%
- Equity multiple
- 0.95×
- Total profit
- $-6,753
- Equity at exit
- $41,069
Cash invested: $133,000 (down + closing). Projections, not guarantees.
Landlord ↔ Tenant lean methodology
- Overall (STATE)
- 18 Strongly Tenant-Friendly
- State California
- 18 Strongly Tenant-Friendly · D+13
- County
- — inherits STATE
- City
- — inherits STATE
ZIP-level market 92004
- Home prices YoY
- -18.4%
- Active inventory
- 174
- Price-to-rent
- 18.2×
Monthly cashflow live
- Estimated rent
- $4,129 medium interval (Pro) →
- Mortgage (P&I)
- −$2,491
- Tax from tax record
- −$127 /mo · $1,519/yr
- Insurance
- −$198
- HOA
- −$0
- Vacancy / Maint / Mgmt
- −$867
- Net cashflow
- $446
Break-even live
2-unit breakdown (identical units grouped — click to expand)
| Units | Beds | Baths | Est. rent |
|---|---|---|---|
| 1× unit | 2 | 1 | $2,178 |
| 1× unit | 1 | 1 | $1,951 |
| Total (2 units) | $4,129 | ||
UW: 25.0% down · 7.5% · 30yr · 1.5% tax · 5.0% vac · 8.0% maint · 8.0% mgmt
Financing live
Cash to close
- Down payment
- $118,750
- Closing costs
- $14,250
- Reserves months
- —
- Total cash needed
- —
Loan-product check · same deal, 3 products live
Conventional
25% down · 7.5% · 30yr
- Down + closing
- —
- Monthly P&I
- —
- Monthly cashflow
- —
- DSCR
- —
- Eligible?
- —
Personal DTI + credit; lowest rate.
DSCR
20% down · 8.5% · 30yr
- Down + closing
- —
- Monthly P&I
- —
- Monthly cashflow
- —
- DSCR
- —
- Eligible?
- —
No personal income docs; deal must DSCR.
Hard money
10% down · 12.0% · 12mo
- Down + closing
- —
- Monthly P&I
- —
- Monthly cashflow
- —
- DSCR
- —
- Eligible?
- —
Short-term bridge; refi at stabilization.
Listing history 21 events
-
2026-06-19days on market $475,000 Active 52 DOM
-
2026-06-18days on market $475,000 Active 51 DOM
-
2026-06-17days on market $475,000 Active 50 DOM
-
2026-06-16days on market $475,000 Active 49 DOM
-
2026-06-15days on market $475,000 Active 48 DOM
-
2026-06-14days on market $475,000 Active 46 DOM
-
2026-06-12days on market $475,000 Active 45 DOM
-
2026-06-09days on market $475,000 Active 42 DOM
-
2026-06-08days on market $475,000 Active 41 DOM
-
2026-06-07days on market $475,000 Active 40 DOM
-
2026-06-07days on market $475,000 Active 39 DOM
-
2026-06-04days on market $475,000 Active 36 DOM
-
2026-06-02days on market $475,000 Active 35 DOM
-
2026-06-01days on market $475,000 Active 34 DOM
-
2026-05-31days on market $475,000 Active 33 DOM
-
2026-05-31days on market $475,000 Active 32 DOM
-
2026-04-28$475,000 Active 1402-char remark
-
2024-06-20historical
-
2024-04-23historical Contingent
-
2024-01-28price $299,900
-
2024-01-19$329,900 Active
ⓘ Source: listings_history table (triggers on properties + properties_extension) + one-shot
backfill from property_details.listing_events for pre-trigger history.
Tax reassessment forecast CA · Resets to sale price
- Current annual tax
- $1,519 · $127/mo
- Projected year-2 tax
- $3,610 · $301/mo
- Expected delta
- +$2,091/yr (+$174/mo · 137.7%)
ⓘ Screening estimate from a state-policy table — verify with the county assessor before closing.
Climate risk First Street
- Flood 1/10 Low FEMA zone X (unshaded) · 0% chance over 30 yrs
- Wildfire 1/10 Low
- Heat 9/10 Extreme 7 d/yr ≥111°F today · 22 d/yr by 30 yrs out
- Wind 1/10 Low
- Air quality 3/10 Moderate 3 unhealthy d/yr today · 3 by 30 yrs out
Nearby sold comps map
Loading sold comps map…
Walkable amenities ~0.75 mi
Loading nearby amenities…
Taxation est. · year 1
- Rental income
- $49,548
- − Mortgage interest
- −$26,607
- − Property taxes
- −$1,519
- − Insurance
- −$2,375
- − Repairs & maintenance
- −$3,964
- − Management
- −$3,964
- − Depreciation
- −$13,818
- Taxable loss
- −$2,699
- Est. tax savings @ 24.0%
- +$648
- After-tax cash flow
- $6,006/yr
For passive investors: Depreciation is non-cash, so a rental often shows a tax loss while cash-flowing — sheltering income. Rental losses are passive: they offset passive income freely, and up to $25,000/yr can offset ordinary (W-2) income if you actively participate and your MAGI is under $100k (phasing out to $0 by $150k); unused losses carry forward. On sale, claimed depreciation is recaptured at up to 25%, and gains may owe capital-gains tax (a 1031 exchange can defer both). Figures are a year-1 estimate at your 24.0% rate — not tax advice; consult a CPA.
Schools (NCES district)
- District
- Borrego Springs Unified
- NCES district ID
- 0605700
- Math proficiency
- 20% ▼ -6.00%
- Reading proficiency
- 35% ▼ -6.00%
- Median HH income
- $42,330
- Composite
- 26.31/100
- National rank
- #12684
- State rank
- #1120 of 1400 in CA
Livability — Borrego Springs
- Score
- 58/100
- State rank
- #712
- US rank
- #21334
Category grades
Schools grade is shown separately in the Schools card above.
Census & demographics
- Population (ZIP)
- 3,030
Population outlook (San Diego County) Hauer SSP2
- Today (2025)
- 3,678,185 people
- By 2030
- 3,856,546 · +4.8%
- By 2040
- 4,171,407 · +13.4%
- By 2050
- 4,421,607 · +20.2%
- By 2075
- 4,831,599 · +31.4%
- By 2100
- 4,832,502 · +31.4%
Race, ethnicity, and origin ACS 2023
- Neighborhood character
- Predominantly White (66%)
- Race & ethnicity
- White 66% Hispanic / Latino 33% Two or more races 24%
- Hispanic origin (detail)
- Mexican 29%
- Common ancestry
- Lithuanian 10% Slovak 5% Scotch-Irish 1%
- Foreign-born
- 27% · Canada
- Languages at home
- 70% English-only · Spanish 30%
Political lean MEDSL · San Diego
- 2024 margin
- D (+16.8) · D 56.9% · R 40.1% · Other 2.9%
- 2008→2024 swing
- +6.6pp toward D · 2008: 10.2pp · 2024: 16.8pp
- All cycles
- 2024: D+16.8 2020: D+22.8 2016: D+17.8 2012: D+5.1 2008: D+10.2
Not yet ingested
- Civics
- —
Market trends
- HPI YoY
- ▼ -50.39%
- Current HPI
- 222.8196
- Rent YoY
- —
- Metro
- —
- State GDP YoY
- ▲ 3.21%
- F500 in state
- 116
Industry mix (Fortune 500 HQ in CA)
| Industry | F500 HQs | Revenue |
|---|---|---|
| Technology | 27 | $1,492B |
|
||
| Financial Services | 3 | $174B |
|
||
| Retail | 3 | $44B |
|
||
| Insurance | 3 | $26B |
|
||
| Media / Entertainment | 2 | $115B |
|
||
| Pharmaceuticals / Biotech | 2 | $62B |
|
||
Price history
+44.0% since first listed5 events — show timeline
- 2026-04-28 Listed $475,000 CRMLS
- 2024-06-20 Listing Removed — SDMLS
- 2024-04-23 Contingent — SDMLS
- 2024-01-28 Price Changed $299,900 SDMLS
- 2024-01-19 Listed $329,900 SDMLS
Property tax history
+1.9%/yrLatest (2025): $1,519 · +2.2% YoY. Source: county tax records.
Cash-flow waterfall
monthlySold comps — $/sqft
last 12 mo · ≤1 miLoading sold comps…