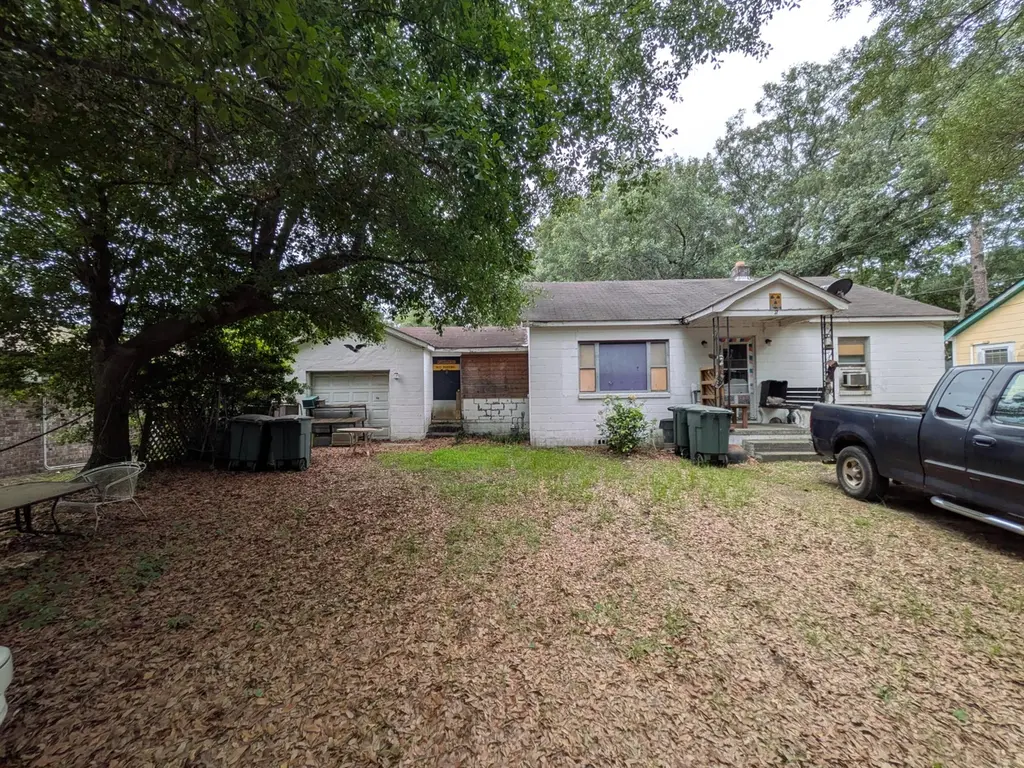
1113 Melvin Dr · Hanahan, SC
Flood risk 1/10 · Minimal
- FEMA flood zone
- X (unshaded)
- Chance of flooding over 30 yrs
- 0.0%
- Est. flood insurance / yr
- $507 – $1,088
Fire risk 3/10 · Minor
- Est. fire insurance / yr
- $783 – $1,453
Heat risk 9/10 · Severe
- Hot days now (above 106°F)
- 7 days/yr
- Hot days in 30 yrs
- 18 days/yr
Wind risk 8/10 · Major
- Chance of severe wind over 30 yrs
- 99.0%
Air-quality risk 3/10 · Minor
- Unhealthy air days now
- 3 days/yr
- Unhealthy air days in 30 yrs
- 3 days/yr
Risk factors via First Street. Map © Google.
Why this score? — see what drove the D grade
The composite is a weighted blend of 9 inputs, each scored 0–100. Each bar is that input's sub-score; the figure is the points it added to the 100-point composite (weight × sub-score).
- Cash flow +13.7/30.0
- ARV discount +7.5/15.0
- DSCR +4.1/10.0
- 1% rule +3.8/10.0
- Rent growth +3.7/5.0
- Schools +3.6/10.0
- Livability +3.6/5.0
- Condition / age +2.5/5.0
- Appreciation +0.0/10.0
$269,900
🖨 Deal sheet (PDF) 📄 Offer letter ✓ Due diligence
Listing remarks MLS
Handyman Special! Spacious home with unlimited potential. This home is being sold AS IS! Roof is only 4 years old. This property also includes TMS#265-16-04-028 to make acerage over .40/acre.
Key facts
- Convenient access
- Generous floor plan
- 0.44 acre lot
Tags
Property features AI
Exterior
- Parking: Off-street parking
- Utilities: Public sewer
- Home design: Single-family detached home; One story; Ground-level entry; Fee simple ownership
- Construction: Asphalt roof
- Exterior features: Shed(s); Interior lot; Lot size under 0.5 acre
Interior
- Bedrooms: 3 bedrooms with the primary bedroom on the lower level
- Bathrooms: 2 bathrooms
- Interior features: Family room
Neighborhood map
What this means for you Summary
Snapshot
- This is a 3-bed/2.0-bath other listed at $270k.
Deal economics
- At list price, monthly cash flow is $18 ($215/yr) — positive.
- The deal already cash-flows at list — no discount required.
- To meet the 1% rule (rent ≥ 1% of price), the offer needs to be $238k (11.7% below list).
- Recommended offer: $238k (11.7% below list) — sets the bar for 1% rule.
- Cap rate 6.4% vs local median 3.6% in Hanahan — top-decile yield for the area; either an underpriced asset or a hidden risk that comps aren't pricing in. Stress-test before assuming the spread holds.
Location & tenants
- Location reads 72/100 on livability (#45 in SC) — a middle-class / working-renter tenant base. Strengths: housing A+, employment A-, health & safety A-; Watch: amenities F, commute F.
- Berkeley 01 (suburban): math 35% / reading 48% proficiency, ranked #30 of 80 in SC (top 38%) — families likely to look elsewhere, expect single-tenant / working-renter base with shorter leases.
- Zoned schools: Hanahan Elementary (math 41% / reading 40%, grade F, #286 of 597 statewide, top 49%, 923 students, 66% FRL); Hanahan Middle (math 43% / reading 47%, grade D, #48 of 229 statewide, top 22%, 793 students, 39% FRL); Hanahan High (math 52% / reading 87%, grade B, #60 of 196 statewide, top 32%, 1,040 students, 29% FRL) — zoned schools at 45% FRL track the district average.
- Market conditions: Rents rising fast (+4.6%/yr); 72 active listings in the ZIP; 8 comparable units currently listed for rent nearby; rentals at typical pace (median 23d on market — plan ~3-4 weeks tenant-placement turnaround); solid renter incomes; 3,183 units permitted in Berkeley County in 2024 (580 in 5+ unit buildings).
- This rent runs 33% of the median local income ($88k/yr) — at the standard rent-burdened threshold; future hikes will face affordability resistance.
Forward outlook
- Local home prices are declining (-3.0%/yr); year-one equity from $2k of loan paydown is wiped out by about $8k of value loss. Plan a longer hold.
- Berkeley County population projected at +48% by 2050 — long-run rental-demand tailwind backs the buy-and-hold thesis.
Negotiation context
- Only 2 days on market — expect competitive offers; lowballing is unlikely to land.
- 3 sale attempts since 19y ago with the ask held roughly flat each time — persistent listings suggest the price (not the market) is what's stuck; bring a comps-based counter.
- Current owner paid $90k; list at $270k implies a 200% gain — meaningful room to come down on a strong offer.
Risks & watch-outs
- Watch-outs: built in 1955 — expect roof / HVAC / electrical / plumbing capex.
- Climate carrying-cost: severe wind risk, 99% chance of damaging wind over 30y; extreme-heat days projected 7→18/yr by 2055 (HVAC capex compounding) — expect insurance premiums to compound above CPI over the hold.
Questions for the listing agent
- Built in 1955 — when were the roof, HVAC, electrical panel, plumbing, and water heater last replaced?
- Is there a deadline driving the sale (1031 exchange, divorce, estate, relocation)? That informs how much negotiation room exists.
- The area grade is low — what's the realistic commute time and amenity access for the typical tenant pool here? Any planned neighborhood developments (good or bad) we should know about?
- What's the average days-on-market for RENTAL listings here right now (not sales)? A rising rental-DOM trend means longer vacancies and softer asking-rent achievability than the comps imply.
- What's the recent tenant-quality profile in this submarket — average credit score on applications, eviction rate, late-payment / NSF rate, and stable-employment percentage? A property-management company in the area should have these aggregated.
- How much new for-sale + rental construction is in the pipeline within 1–3 miles? Heavy new supply typically softens prices + rents 12–24 months out; constrained supply supports both.
Investment metrics
- 1% rule
- 0.88% ✗
- Cap rate
- 6.37%
- Cash-on-cash
- 0.28%
- DSCR
- 1.01
- GRM
- 9.4
CMA / ARV
No comps found within radius.
Projected returns pro-forma
-3.0% appreciation · 4.63% rent growth · sell at horizon
- IRR
- -14.0%
- Equity multiple
- 0.49×
- Total profit
- $-38,585
- Equity at exit
- $40,243
- IRR
- -2.8%
- Equity multiple
- 0.80×
- Total profit
- $-15,129
- Equity at exit
- $23,336
Cash invested: $75,572 (down + closing). Projections, not guarantees.
Landlord ↔ Tenant lean methodology
- Overall (STATE)
- 90 Strongly Landlord-Friendly
- State South Carolina
- 90 Strongly Landlord-Friendly · R+6
- County
- — inherits STATE
- City
- — inherits STATE
ZIP-level market 29410
- Rents YoY
- 4.6%
- Active inventory
- 72
- Price-to-rent
- 9.4×
Monthly cashflow live
- Estimated rent
- $2,384 high interval (Pro) →
- Mortgage (P&I)
- −$1,415
- Tax est. 1.5%
- −$337 /mo · $4,048/yr
- Insurance
- −$112
- HOA
- −$0
- Vacancy / Maint / Mgmt
- −$501
- Net cashflow
- $18
Break-even live
Sensitivity live
| Price | -10% $204 | -5% $111 | +0% $18 | +5% $-75 | +10% $-169 |
|---|---|---|---|---|---|
| Rent | -10% $-170 | -5% $-76 | +0% $18 | +5% $112 | +10% $206 |
| Rate | -1.0pp $154 | -0.5pp $87 | base $18 | +0.5pp $-52 | +1.0pp $-123 |
UW: 25.0% down · 7.5% · 30yr · 1.5% tax · 5.0% vac · 8.0% maint · 8.0% mgmt
Financing live
Cash to close
- Down payment
- $67,475
- Closing costs
- $8,097
- Reserves months
- —
- Total cash needed
- —
Loan-product check · same deal, 3 products live
Conventional
25% down · 7.5% · 30yr
- Down + closing
- —
- Monthly P&I
- —
- Monthly cashflow
- —
- DSCR
- —
- Eligible?
- —
Personal DTI + credit; lowest rate.
DSCR
20% down · 8.5% · 30yr
- Down + closing
- —
- Monthly P&I
- —
- Monthly cashflow
- —
- DSCR
- —
- Eligible?
- —
No personal income docs; deal must DSCR.
Hard money
10% down · 12.0% · 12mo
- Down + closing
- —
- Monthly P&I
- —
- Monthly cashflow
- —
- DSCR
- —
- Eligible?
- —
Short-term bridge; refi at stabilization.
Rent comps 8 comps
| Address | Beds | Baths | Sqft | Rent | $/sqft | DOM | Units | Dist |
|---|---|---|---|---|---|---|---|---|
| 1414 Sumner Ave North Charleston, SC | 3.0 | 2.5 | 1616 | $2,420 | $1.50 | 4d | 3 | 0.41mi |
| 5739 N Murray Ave Lot 7 Hanahan, SC | 3.0 | 2.5 | 1380 | $2,295 | $1.66 | 16d | 1 | 0.44mi |
| 5739 N Murray Ave Lot 7 Hanahan, SC | 3.0 | 2.5 | 1380 | $2,295 | $1.66 | 25d | 1 | 0.44mi |
| 5653 Sablewood St North Charleston, SC | 3.0–4.0 | 2.5–3.5 | 1770 | $2,152 | $1.22 | 5d | 1 | 0.78mi |
| 5682 Sablewood ST Unit Collins Charleston, SC | 3.0 | 2.5 | 1941 | $2,372 | $1.22 | 25d | 1 | 0.80mi |
| 1149 Sumner Ave North Charleston, SC | 3.0 | 2.5 | 2307 | $2,850 | $1.24 | 23d | 1 | 1.07mi |
| 5049 Spaniel Dr North Charleston, SC | 3.0 | 2.5 | 2210 | $4,000 | $1.81 | 16d | 1 | 1.26mi |
| 4840 Upjohn RD North Charleston, SC | 2.0–3.0 | 1.0–2.0 | 1066 | $1,300 | $1.22 | 25d | 1 | 1.49mi |
Listing history 2 events
-
2026-06-21remarks 699-char remark
-
2026-06-21$269,900 Active 2 DOM
ⓘ Source: listings_history table (triggers on properties + properties_extension) + one-shot
backfill from property_details.listing_events for pre-trigger history.
Climate risk First Street
- Flood 1/10 Low FEMA zone X (unshaded) · 0% chance over 30 yrs
- Wildfire 3/10 Moderate
- Heat 9/10 Extreme 7 d/yr ≥106°F today · 18 d/yr by 30 yrs out
- Wind 8/10 Severe 99% chance of damaging wind over 30 yrs
- Air quality 3/10 Moderate 3 unhealthy d/yr today · 3 by 30 yrs out
Nearby sold comps map
Loading sold comps map…
Walkable amenities ~0.75 mi
Loading nearby amenities…
Taxation est. · year 1
- Rental income
- $28,605
- − Mortgage interest
- −$15,119
- − Property taxes
- −$4,048
- − Insurance
- −$1,350
- − Repairs & maintenance
- −$2,288
- − Management
- −$2,288
- − Depreciation
- −$7,852
- Taxable loss
- −$4,340
- Est. tax savings @ 24.0%
- +$1,042
- After-tax cash flow
- $1,257/yr
For passive investors: Depreciation is non-cash, so a rental often shows a tax loss while cash-flowing — sheltering income. Rental losses are passive: they offset passive income freely, and up to $25,000/yr can offset ordinary (W-2) income if you actively participate and your MAGI is under $100k (phasing out to $0 by $150k); unused losses carry forward. On sale, claimed depreciation is recaptured at up to 25%, and gains may owe capital-gains tax (a 1031 exchange can defer both). Figures are a year-1 estimate at your 24.0% rate — not tax advice; consult a CPA.
Schools (NCES district)
- District
- Berkeley 01
- NCES district ID
- 4501170
- Math proficiency
- 35% ▼ -8.00%
- Reading proficiency
- 48% ▼ -2.00%
- Median HH income
- $52,724
- Composite
- 35.95/100
- National rank
- #4799
- State rank
- #30 of 80 in SC
Livability — Hanahan
- Score
- 72/100
- State rank
- #45
- US rank
- #6201
Category grades
Schools grade is shown separately in the Schools card above.
Census & demographics
- Census place
- Hanahan, SC
- County
- Berkeley County · 198,768 people
- City population
- 21,314
- Metro
- Charleston-North Charleston, SC
- Population (ZIP)
- 21,314
- Household income
- $87,984
- Rent vs Own
- Severe rent burden
- 727.0
Population outlook (Berkeley County) Hauer SSP2
- Today (2025)
- 254,184 people
- By 2030
- 279,677 · +10.0%
- By 2040
- 329,379 · +29.6%
- By 2050
- 375,557 · +47.8%
- By 2075
- 476,740 · +87.6%
- By 2100
- 535,945 · +110.8%
Race, ethnicity, and origin ACS 2023
- Neighborhood character
- Predominantly White (72%)
- Race & ethnicity
- White 72% Hispanic / Latino 11% Black 9% Asian 4% Two or more races 4%
- Hispanic origin (detail)
- Mexican 4% Puerto Rican 1% Cuban 1%
- Common ancestry
- Serbian 5% Italian 3% Slovak 2%
- Foreign-born
- 11% · Canada, Vietnam, Jamaica
- Languages at home
- 85% English-only · Spanish 10% Other Asian/Pacific 1% Vietnamese 1%
Political lean MEDSL · Berkeley
- 2024 margin
- R (+16.3) · D 41.1% · R 57.4% · Other 1.4%
- 2008→2024 swing
- -3.2pp toward R · 2008: -13.1pp · 2024: -16.3pp
- All cycles
- 2024: R+16.3 2020: R+11.7 2016: R+17.4 2012: R+18.9 2008: R+13.1
Not yet ingested
- Civics
- —
Market trends
- HPI YoY
- ▼ -222.05%
- Current HPI
- 326.9496
- Rent YoY
- ▲ 4.63%
- Metro
- Charleston-North Charleston, SC
- State GDP YoY
- ▲ 4.51%
- F500 in state
- 2
Industry mix (Fortune 500 HQ in SC)
| Industry | F500 HQs | Revenue |
|---|---|---|
| Packaging | 1 | $7B |
|
||
Price history
+92.9% since first listed6 events — show timeline
- 2026-06-19 Listed $269,900 Charleston Trident MLS
- 2008-05-21 Sold (Public Records) $90,000 Public Records
- 2008-05-16 Sold (MLS) $90,000 Charleston Trident MLS
- 2007-11-13 Listed $99,900 Charleston Trident MLS
- 2007-09-13 Listing Removed — Charleston Trident MLS
- 2007-05-19 Listed $139,900 Charleston Trident MLS
Property tax history
+2.9%/yrLatest (2025): $16 · +3.1% YoY. Source: county tax records.
Cash-flow waterfall
monthlySold comps — $/sqft
last 12 mo · ≤1 miLoading sold comps…