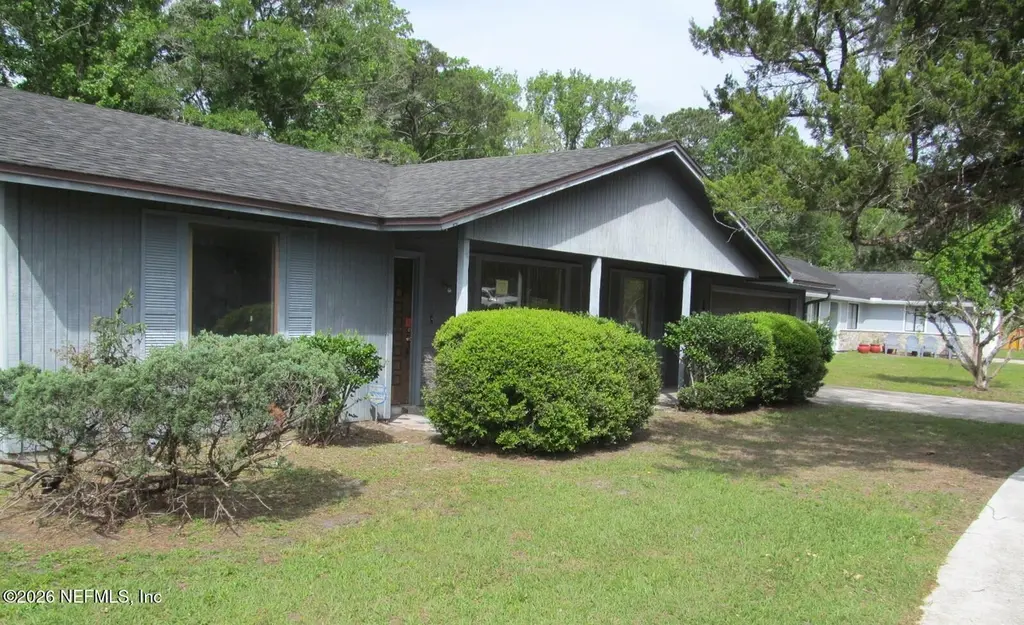
8456 Boysenberry Ln W · Jacksonville, FL
Flood risk 1/10 · Minimal
- FEMA flood zone
- X (unshaded)
- Chance of flooding over 30 yrs
- 0.0%
- Est. flood insurance / yr
- $507 – $1,088
Fire risk 4/10 · Minor
- Est. fire insurance / yr
- $947 – $1,759
Heat risk 8/10 · Major
- Hot days now (above 107°F)
- 7 days/yr
- Hot days in 30 yrs
- 19 days/yr
Wind risk 10/10 · Severe
- Chance of severe wind over 30 yrs
- 99.0%
Air-quality risk 3/10 · Minor
- Unhealthy air days now
- 3 days/yr
- Unhealthy air days in 30 yrs
- 4 days/yr
Risk factors via First Street. Map © Google.
Why this score? — see what drove the D+ grade
The composite is a weighted blend of 9 inputs, each scored 0–100. Each bar is that input's sub-score; the figure is the points it added to the 100-point composite (weight × sub-score).
- ARV discount +15.0/15.0
- Cash flow +11.4/30.0
- Livability +4.2/5.0
- 1% rule +3.9/10.0
- Schools +3.9/10.0
- DSCR +3.3/10.0
- Rent growth +3.1/5.0
- Condition / age +2.5/5.0
- Appreciation +0.0/10.0
$209,000
🖨 Deal sheet 📄 Offer letter ✓ Due diligence
Listing remarks
Sleeping Beauty! Tiled floors, stone fireplace, spacious and private rear yard. This house has unlimited potential, don't wait come see this rare opportunity today. Sold As-Is. Seller/Agent makes no representations / warranties expressed or implied as to condition of property.
Key facts
- Tiled floors
- Private rear yard
- Stone fireplace
Tags
Property features AI
Finance
- Financial info: Tax information provided (amount and year excluded per instructions)
- HOA & community: Not a senior community
Exterior
- Parking: Attached 2-car garage
- Utilities: Public sewer; Electricity available
- Home design: Single family residence; Entry level is 1; Faces east
- Construction: Construction details not specified
- Exterior features: Private pool: No; Other detached structures on the property
Interior
- Kitchen: Other appliances
- Bedrooms: 3 bedrooms
- Bathrooms: 2 full bathrooms
- Heating & cooling: Has cooling (type not specified)
- Interior features: Fireplace (1)
- Laundry & utility: Unfurnished (no built-in laundry information provided)
Neighborhood map
What this means for you Summary
Snapshot
- This is a 3-bed/2.0-bath single-family listed at $209k.
Deal economics
- At list price, monthly cash flow is $-73 ($-880/yr) — negative.
- To cash-flow at today's rent, offer at most $196k (6.2% below list).
- To meet the 1% rule (rent ≥ 1% of price), the offer needs to be $186k (10.8% below list).
- Recommended offer: $186k (10.8% below list) — sets the bar for 1% rule.
- Cap rate 5.9% vs local median 4.0% in Jacksonville — top-decile yield for the area; either an underpriced asset or a hidden risk that comps aren't pricing in. Stress-test before assuming the spread holds.
Location & tenants
- Location reads 83/100 on livability (#50 in FL, #911 nationally) — a professional / high-income tenant draw. Strengths: amenities A+, commute A+, housing A+.
- Duval (urban): math 46% / reading 45% proficiency, ranked #48 of 73 in FL (top 66%) — families likely to look elsewhere, expect single-tenant / working-renter base with shorter leases.
- Market conditions: Rents rising (+2.2%/yr); 349 active listings in the ZIP; 40 comparable units currently listed for rent nearby; rentals at typical pace (median 15d on market — plan ~3-4 weeks tenant-placement turnaround); 6,503 units permitted in Duval County in 2024 (1,131 in 5+ unit buildings).
- This rent runs 36% of the median local income ($62k/yr) — at the standard rent-burdened threshold; future hikes will face affordability resistance.
Forward outlook
- Local home prices are declining (-3.0%/yr); year-one equity from $1k of loan paydown is wiped out by about $6k of value loss. Plan a longer hold.
- Duval County population projected at +19% by 2050 — long-run rental-demand tailwind backs the buy-and-hold thesis.
Negotiation context
- It's been on market 59 days — a 3% lower offer ($203k) is reasonable based on typical stale-listing flexibility.
Risks & watch-outs
- Climate carrying-cost: severe wind risk, 99% chance of damaging wind over 30y; extreme-heat days projected 7→19/yr by 2055 (HVAC capex compounding) — expect insurance premiums to compound above CPI over the hold.
Questions for the listing agent
- What do current leases actually rent for vs. the listed asking? Can we see a recent rent roll and the last 12 months of T-12 income?
- It's been on market 59 days. Have you received any prior offers? Is the seller open to a 11% concession, seller financing, or rate buy-down credit?
- Is there a deadline driving the sale (1031 exchange, divorce, estate, relocation)? That informs how much negotiation room exists.
- Schools are B-rated — typically a magnet for longer-tenancy family renters. What's the average tenant stay here, and is there a school-zone premium baked into asking?
- The area grade is low — what's the realistic commute time and amenity access for the typical tenant pool here? Any planned neighborhood developments (good or bad) we should know about?
- What's the average days-on-market for RENTAL listings here right now (not sales)? A rising rental-DOM trend means longer vacancies and softer asking-rent achievability than the comps imply.
- What's the recent tenant-quality profile in this submarket — average credit score on applications, eviction rate, late-payment / NSF rate, and stable-employment percentage? A property-management company in the area should have these aggregated.
- How much new for-sale + rental construction is in the pipeline within 1–3 miles? Heavy new supply typically softens prices + rents 12–24 months out; constrained supply supports both.
Investment metrics
- 1% rule
- 0.89% ✗
- Cap rate
- 5.87%
- Cash-on-cash
- -1.50%
- DSCR
- 0.93
- GRM
- 9.3
CMA / ARV
- ARV (on-the-fly)
- $287,264
- Comps found
- 12
Show comp detail 12 sales within ~0.75 mi
| Address | Dist | Beds/Ba | Sqft | Sold | Price | $/sf | Match |
|---|---|---|---|---|---|---|---|
| 7353 Boysenberry Ct | 0.10mi | 3/2.0 | 1,446 (-5%) | 1mo | $299,000 | $207 | 86 |
| 7345 Amandas Crossing Dr S | 0.49mi | 3/2.0 | 1,526 (-0%) | 1mo | $265,000 | $174 | 76 |
| 7318 Amandas Crossing Dr S | 0.47mi | 3/2.0 | 1,526 (-0%) | 3mo | $279,000 | $183 | 76 |
| 7150 Fire Fly Dr | 0.55mi | 3/2.0 | 1,567 (+3%) | 2mo | $285,000 | $182 | 68 |
| 8623 Bishopswood Dr | 0.36mi | 3/2.0 | 1,408 (-8%) | 2mo | $315,000 | $224 | 68 |
| 7440 Sweet Rose Ln | 0.54mi | 3/2.0 | 1,442 (-6%) | 1mo | $260,000 | $180 | 64 |
| 8149 Coralberry Ln | 0.67mi | 3/2.0 | 1,464 (-4%) | 1mo | $275,000 | $188 | 61 |
| 8335 Fire Fly Ln | 0.51mi | 3/2.0 | 1,395 (-9%) | 1mo | $288,990 | $207 | 61 |
| 7193 Eagles Perch Dr | 0.49mi | 3/2.0 | 1,710 (+12%) | 1mo | $272,000 | $159 | 56 |
| 8305 Coralberry Ln | 0.60mi | 3/2.0 | 1,350 (-12%) | 2mo | $299,000 | $221 | 51 |
| 8330 Pepperwood Dr | 0.61mi | 3/2.0 | 1,302 (-15%) | 1mo | $285,900 | $220 | 46 |
| 6830 Candyroot Ct | 0.59mi | 4/2.0 (+1) | 1,705 (+12%) | 3mo | $296,000 | $174 | 46 |
Match score weights: distance 35% · size 25% · config 20% · recency 20%. Top-matched comps best support the ARV.
Projected returns pro-forma
-3.0% appreciation · 2.25% rent growth · sell at horizon
- IRR
- -19.6%
- Equity multiple
- 0.32×
- Total profit
- $-39,843
- Equity at exit
- $31,163
- IRR
- -14.1%
- Equity multiple
- 0.21×
- Total profit
- $-45,984
- Equity at exit
- $18,071
Cash invested: $58,520 (down + closing). Projections, not guarantees.
Landlord ↔ Tenant lean methodology
- Overall (STATE)
- 87 Strongly Landlord-Friendly
- State Florida
- 87 Strongly Landlord-Friendly · R+3
- County
- — inherits STATE
- City
- — inherits STATE
ZIP-level market 32244
- Home prices YoY
- -17.8%
- Rents YoY
- 2.2%
- Active inventory
- 349
- Price-to-rent
- 9.3×
Monthly cashflow live
- Estimated rent
- $1,864 high interval (Pro) →
- Mortgage (P&I)
- −$1,096
- Tax from tax record
- −$363 /mo · $4,356/yr
- Insurance
- −$87
- HOA
- −$0
- Vacancy / Maint / Mgmt
- −$391
- Net cashflow
- $-73
Break-even live
UW: 25.0% down · 7.5% · 30yr · 1.5% tax · 5.0% vac · 8.0% maint · 8.0% mgmt
Financing live
Cash to close
- Down payment
- $52,250
- Closing costs
- $6,270
- Reserves months
- —
- Total cash needed
- —
Loan-product check · same deal, 3 products live
Conventional
25% down · 7.5% · 30yr
- Down + closing
- —
- Monthly P&I
- —
- Monthly cashflow
- —
- DSCR
- —
- Eligible?
- —
Personal DTI + credit; lowest rate.
DSCR
20% down · 8.5% · 30yr
- Down + closing
- —
- Monthly P&I
- —
- Monthly cashflow
- —
- DSCR
- —
- Eligible?
- —
No personal income docs; deal must DSCR.
Hard money
10% down · 12.0% · 12mo
- Down + closing
- —
- Monthly P&I
- —
- Monthly cashflow
- —
- DSCR
- —
- Eligible?
- —
Short-term bridge; refi at stabilization.
Rent comps 40 comps
| Address | Beds | Baths | Sqft | Rent | $/sqft | DOM | Units | Dist |
|---|---|---|---|---|---|---|---|---|
| 8407 Rampart Rd Jacksonville, FL | 3.0 | 2.0 | 1412 | $1,885 | $1.33 | 23d | 1 | 0.17mi |
| 8327 Argyle Corners Ct Jacksonville, FL | 3.0 | 2.0 | 1257 | $1,820 | $1.45 | 3d | 1 | 0.29mi |
| 8418 Bottlebrush Ct Jacksonville, FL | 4.0 | 2.0 | 1430 | $1,930 | $1.35 | 23d | 1 | 0.30mi |
| 7270 Argyle Corners Dr Jacksonville, FL | 3.0 | 2.0 | 1136 | $1,595 | $1.40 | 14d | 1 | 0.30mi |
| 7091 Beechfern Ln S Jacksonville, FL | 3.0 | 2.0 | 1360 | $1,699 | $1.25 | 16d | 1 | 0.36mi |
| 8341 Fire Fly Ln Jacksonville, FL | 3.0 | 2.5 | 1676 | $1,695 | $1.01 | 23d | 1 | 0.47mi |
| 8341 Fire Fly Ln Jacksonville, FL | 3.0 | 2.5 | 1676 | $1,695 | $1.01 | 4d | 1 | 0.47mi |
| 6828 Coralberry Ln S Jacksonville, FL | 2.0 | 2.0 | 1108 | $1,600 | $1.44 | 7d | 1 | 0.53mi |
| 6828 Coralberry Ln S Jacksonville, FL | 2.0 | 2.0 | 1100 | $1,600 | $1.45 | 14d | 1 | 0.53mi |
| 7974 Amandas Crossing Dr E Jacksonville, FL | 3.0 | 2.0 | 1300 | $1,790 | $1.38 | 23d | 1 | 0.55mi |
| 8236 Weybridge Dr Jacksonville, FL | 3.0 | 2.0 | 1506 | $1,908 | $1.27 | 20d | 1 | 0.68mi |
| 8340 Westover Ct Jacksonville, FL | 3.0 | 2.0 | 1161 | $1,800 | $1.55 | 23d | 1 | 0.70mi |
| 6970 Tree Frog Ct Jacksonville, FL | 3.0 | 2.0 | 1282 | $1,725 | $1.35 | 23d | 1 | 0.73mi |
| 8150 Loch Lomond Ln Unit NA Jacksonville, FL | 3.0 | 2.0 | 1700 | $2,000 | $1.18 | 10d | 1 | 0.73mi |
| 7548 Allspice Cir S Jacksonville, FL | 3.0 | 2.0 | 1260 | $1,759 | $1.40 | 7d | 1 | 0.74mi |
| 7835 Longhorn Cir E Jacksonville, FL | 3.0 | 2.0 | 1218 | $1,955 | $1.61 | 4d | 1 | 0.77mi |
| 8176 Kilwinning Ln Jacksonville, FL | 3.0 | 2.0 | 1519 | $2,185 | $1.44 | 14d | 1 | 0.79mi |
| 6931 Cane Grass Ln E Jacksonville, FL | 3.0 | 2.0 | 2100 | $2,300 | $1.10 | 4d | 1 | 0.81mi |
| 8064 Honeysuckle Ln Jacksonville, FL | 3.0 | 2.0 | 1279 | $1,955 | $1.53 | 1d | 1 | 0.89mi |
| 8562 Sturbridge Cir W Jacksonville, FL | 2.0 | 2.5 | 1408 | $1,620 | $1.15 | 4d | 1 | 0.91mi |
| 8550 Sturbridge Cir W Jacksonville, FL | 2.0 | 1.5 | 1206 | $1,500 | $1.24 | 7d | 1 | 0.91mi |
| 7760 Allspice Cir W Jacksonville, FL | 3.0 | 2.0 | 1288 | $1,800 | $1.40 | 23d | 1 | 0.93mi |
| 8529 Sturbridge Cir W Jacksonville, FL | 2.0 | 2.5 | 1264 | $1,550 | $1.23 | 23d | 1 | 0.94mi |
| 7559 Ginger Tea Trl W Jacksonville, FL | 3.0 | 2.0 | 1437 | $1,695 | $1.18 | 17d | 1 | 1.08mi |
| 7740 Plantation Bay Dr Jacksonville, FL | 1.0–3.0 | 1.0–2.0 | 927 | $1,776 | $1.92 | 3d | 17 | 1.10mi |
| 7940 Collins Bay Ct Jacksonville, FL | 3.0 | 2.0 | 1554 | $2,025 | $1.30 | 20d | 1 | 1.11mi |
| 8550 Argyle Business Loop Jacksonville, FL | 3.0 | 2.5 | 1486 | $1,735 | $1.17 | 16d | 3 | 1.12mi |
| 8550 Argyle Business Loop Jacksonville, FL | 2.0–3.0 | 2.5–3.0 | 1331 | $1,675 | $1.26 | 2d | 2 | 1.12mi |
| 8550 Argyle Business Loop Jacksonville, FL | 3.0 | 2.5 | 1486 | $1,675 | $1.13 | 14d | 1 | 1.16mi |
| 8106 Byrd Landing Ct Jacksonville, FL | 4.0 | 2.5 | 1889 | $2,315 | $1.23 | 4d | 1 | 1.20mi |
| 6500 Lake Gray Blvd Jacksonville, FL | 1.0–3.0 | 1.0–2.0 | 972 | $1,819 | $1.87 | 1d | 9 | 1.20mi |
| 8321 Crosswind Rd Jacksonville, FL | 3.0 | 2.0 | 1274 | $1,750 | $1.37 | 21d | 1 | 1.23mi |
| 8500 Argyle Business Loop Jacksonville, FL | 1.0–3.0 | 1.0–2.0 | 921 | $1,475 | $1.60 | 23d | 1 | 1.25mi |
| 7811 Invermere Blvd N Jacksonville, FL | 4.0 | 2.0 | 1831 | $1,990 | $1.09 | 20d | 1 | 1.29mi |
| 312 Turtle Dove Dr Orange Park, FL | 4.0 | 2.0 | 1288 | $1,950 | $1.51 | 14d | 1 | 1.37mi |
| 7377 Benes Trl Jacksonville, FL | 4.0 | 2.0 | 1861 | $2,250 | $1.21 | 23d | 1 | 1.38mi |
| 7565 Westland Oaks Dr Jacksonville, FL | 3.0 | 2.0 | 1317 | $2,000 | $1.52 | 14d | 1 | 1.39mi |
| 8077 Cumberland Gap Trl Jacksonville, FL | 3.0 | 2.5 | 1307 | $1,750 | $1.34 | 23d | 1 | 1.39mi |
| 2020 Wells Rd Orange Park, FL | 1.0–3.0 | 1.0–2.0 | 1167 | $1,595 | $1.37 | 21d | 8 | 1.40mi |
| 8131 Cumberland Gap Trl Jacksonville, FL | 3.0 | 2.0 | 1298 | $1,624 | $1.25 | 14d | 1 | 1.41mi |
Listing history 15 events
-
2026-06-18days on market $209,000 Active 59 DOM
-
2026-06-17days on market $209,000 Active 58 DOM
-
2026-06-16days on market $209,000 Active 57 DOM
-
2026-06-15days on market $209,000 Active 56 DOM
-
2026-06-13days on market $209,000 Active 53 DOM
-
2026-06-10days on market $209,000 Active 50 DOM
-
2026-06-08days on market $209,000 Active 49 DOM
-
2026-06-07days on market $209,000 Active 48 DOM
-
2026-06-05pricedays on market $209,000 Active 45 DOM
-
2026-06-03days on market $220,000 Active 44 DOM
-
2026-06-02days on market $220,000 Active 43 DOM
-
2026-06-01days on market $220,000 Active 42 DOM
-
2026-05-31days on market $220,000 Active 41 DOM
-
2026-05-02price $220,000
-
2026-04-20$240,000 Active
ⓘ Source: listings_history table (triggers on properties + properties_extension) + one-shot
backfill from property_details.listing_events for pre-trigger history.
Tax reassessment forecast FL · Resets to sale price
- Current annual tax
- $4,356 · $363/mo
- Projected year-2 tax
- $4,356 · $363/mo
- Expected delta
- $0/yr ($0/mo · 0.0%)
ⓘ Screening estimate from a state-policy table — verify with the county assessor before closing.
Climate risk First Street
- Flood 1/10 Low FEMA zone X (unshaded) · 0% chance over 30 yrs
- Wildfire 4/10 Moderate
- Heat 8/10 Severe 7 d/yr ≥107°F today · 19 d/yr by 30 yrs out
- Wind 10/10 Extreme 99% chance of damaging wind over 30 yrs
- Air quality 3/10 Moderate 3 unhealthy d/yr today · 4 by 30 yrs out
Nearby sold comps map
Loading sold comps map…
Walkable amenities ~0.75 mi
Loading nearby amenities…
Taxation est. · year 1
- Rental income
- $22,371
- − Mortgage interest
- −$11,707
- − Property taxes
- −$4,356
- − Insurance
- −$1,045
- − Repairs & maintenance
- −$1,790
- − Management
- −$1,790
- − Depreciation
- −$6,080
- Taxable loss
- −$4,396
- Est. tax savings @ 24.0%
- +$1,055
- After-tax cash flow
- $175/yr
For passive investors: Depreciation is non-cash, so a rental often shows a tax loss while cash-flowing — sheltering income. Rental losses are passive: they offset passive income freely, and up to $25,000/yr can offset ordinary (W-2) income if you actively participate and your MAGI is under $100k (phasing out to $0 by $150k); unused losses carry forward. On sale, claimed depreciation is recaptured at up to 25%, and gains may owe capital-gains tax (a 1031 exchange can defer both). Figures are a year-1 estimate at your 24.0% rate — not tax advice; consult a CPA.
Schools (NCES district)
- District
- Duval
- NCES district ID
- 1200480
- Math proficiency
- 46% ▼ -11.00%
- Reading proficiency
- 45% ▼ -4.00%
- Median HH income
- $48,987
- Composite
- 38.97/100
- National rank
- #4076
- State rank
- #48 of 73 in FL
Livability — Jacksonville
- Score
- 83/100
- State rank
- #50
- US rank
- #911
Category grades
Schools grade is shown separately in the Schools card above.
Census & demographics
- Census place
- Jacksonville, FL
- County
- Duval County · 1,015,274 people
- City population
- 979,034
- Metro
- Jacksonville, FL
- Population (ZIP)
- 63,592
- Household income
- $62,204
- Rent vs Own
- Severe rent burden
- 2799.0
Population outlook (Duval County) Hauer SSP2
- Today (2025)
- 1,013,010 people
- By 2030
- 1,059,228 · +4.6%
- By 2040
- 1,141,439 · +12.7%
- By 2050
- 1,205,258 · +19.0%
- By 2075
- 1,324,282 · +30.7%
- By 2100
- 1,319,620 · +30.3%
Race, ethnicity, and origin ACS 2023
- Neighborhood character
- Highly diverse neighborhood (Simpson 0.70)
- Race & ethnicity
- White 39% Black 35% Hispanic / Latino 15% Two or more races 10% Asian 6%
- Hispanic origin (detail)
- Mexican 3% Puerto Rican 6% Cuban 3%
- Common ancestry
- Hispanic 1% Lithuanian 1% Romanian 1%
- Foreign-born
- 12% · Canada, Vietnam, China
- Languages at home
- 83% English-only · Spanish 9% Tagalog/Filipino 3% French/Haitian/Cajun 2%
Political lean MEDSL · Duval
- 2024 margin
- Toss-up / Even · D 48.7% · R 50.1% · Other 1.2%
- 2008→2024 swing
- +0.4pp no change · 2008: -1.9pp · 2024: -1.5pp
- All cycles
- 2024: R+1.5 2020: D+3.8 2016: R+1.5 2012: R+3.6 2008: R+1.9
Not yet ingested
- Civics
- —
Market trends
- HPI YoY
- ▼ -64.22%
- Current HPI
- 296.5375
- Rent YoY
- ▲ 2.25%
- Metro
- Jacksonville, FL
- State GDP YoY
- ▲ 3.28%
- F500 in state
- 36
Industry mix (Fortune 500 HQ in FL)
| Industry | F500 HQs | Revenue |
|---|---|---|
| Industrial Technology | 2 | $29B |
|
||
| Insurance | 2 | $17B |
|
||
| Retail | 1 | $60B |
|
||
| Technology Distribution | 1 | $58B |
|
||
| Homebuilding | 1 | $35B |
|
||
| Technology Manufacturing | 1 | $35B |
|
||
Price history
-8.3% since first listed2 events — show timeline
- 2026-05-02 Price Changed $220,000 realMLS
- 2026-04-20 Listed $240,000 realMLS
Property tax history
+13.9%/yrLatest (2025): $4,356 · +10.6% YoY. Source: county tax records.
Cash-flow waterfall
monthlySold comps — $/sqft
last 12 mo · ≤1 miLoading sold comps…