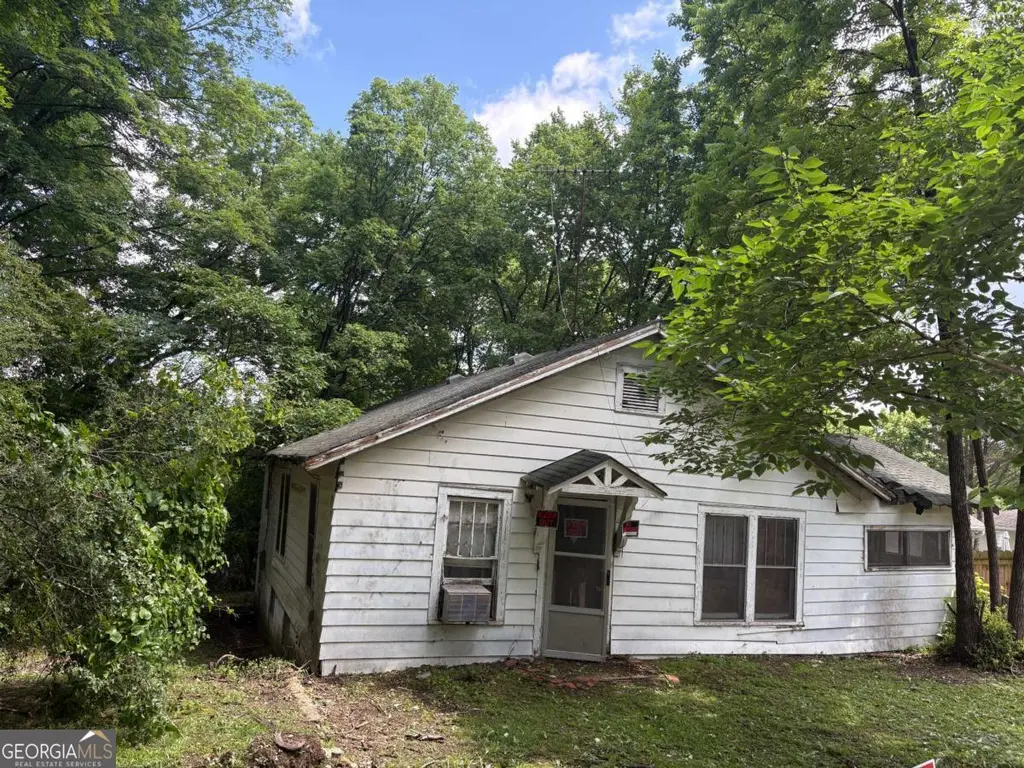
56 Helen Ave · Lakeview, GA
Flood risk 1/10 · Minimal
- FEMA flood zone
- X (unshaded)
- Chance of flooding over 30 yrs
- 0.0%
- Est. flood insurance / yr
- $507 – $1,088
Fire risk 1/10 · Minimal
- Est. fire insurance / yr
- $963 – $1,789
Heat risk 6/10 · Moderate
- Hot days now (above 105°F)
- 7 days/yr
- Hot days in 30 yrs
- 20 days/yr
Wind risk 4/10 · Minor
- Chance of severe wind over 30 yrs
- 12.0%
Air-quality risk 3/10 · Minor
- Unhealthy air days now
- 2 days/yr
- Unhealthy air days in 30 yrs
- 2 days/yr
Risk factors via First Street. Map © Google.
Why this score? — see what drove the B grade
The composite is a weighted blend of 9 inputs, each scored 0–100. Each bar is that input's sub-score; the figure is the points it added to the 100-point composite (weight × sub-score).
- Cash flow +30.0/30.0
- 1% rule +10.0/10.0
- DSCR +10.0/10.0
- ARV discount +7.5/15.0
- Rent growth +4.4/5.0
- Livability +3.5/5.0
- Schools +3.3/10.0
- Condition / age +2.5/5.0
- Appreciation +0.0/10.0
$46,900
🖨 Deal sheet 📄 Offer letter ✓ Due diligence
Listing remarks MLS
Investors wanted. YOU ARE NOT PERMITTED TO NOT ACCESS THE MAIN LEVEL OF THE HOME AS IT IS UNSAFE. DO NOT ENTER THE MAIN LEVEL OF THE HOME UNDER ANY CIRCUMSTANCES. Seller assumes no liability for anyone entering any portion of the Property. This home is in need of a complete rehab. List price accounts for the thousands in framing cost due to water intrusion. You will need to frame and replace the floors in several rooms. Make your offer today! Perfect for fix & flip investors looking to increase the value. It could be a nice addition to a buy-&-hold portfolio. Sold As-Is. NO BLIND OFFERS. Must use seller's closing attorney (Sherman & Phalen, LLC)
Key facts
- 0.28 acre lot
- Built 1925
- Listed 8 days
Property features AI
Exterior
- Parking: Level driveway; Open parking available
- Utilities: Public water; Septic tank sewer; 110-volt electric; Cable available, electricity available, water available
- Home design: One level; Property condition: fixer
- Construction: Composition roof; Construction materials listed as 'Other'; Block foundation; Built/constructed year not provided
- Exterior features: Asphalt road frontage on a city street; Basement exterior entry; Tax/legal description: PT LL 48 9/4 Exhibit A
Interior
- Kitchen: Kitchen features listed as 'Other'; Appliances listed as 'Other'
- Bedrooms: Two main-level bedrooms; Bedroom features listed as 'Other'
- Flooring: Flooring described as 'Other'
- Bathrooms: One full bathroom on the main level; Master bathroom has no special features listed
- Heating & cooling: Heating described as 'Other'; Cooling described as 'Other'
- Interior features: No common walls (detached); Basement with full exterior entry; Some interior features listed as 'Other'
- Laundry & utility: Laundry features listed as 'Other'
Neighborhood map
What this means for you Summary
Snapshot
- This is a 2-bed/1.0-bath single-family listed at $47k.
Deal economics
- At list price, monthly cash flow is $751 ($9k/yr) — positive.
- The deal already cash-flows at list — no discount required.
- Meets the 1% rule at list price ($1k rent vs $47k).
- Cap rate 25.5% vs local median 4.9% in Lakeview — top-decile yield for the area; either an underpriced asset or a hidden risk that comps aren't pricing in. Stress-test before assuming the spread holds.
Location & tenants
- Location reads 69/100 on livability (#106 in GA) — a middle-class / working-renter tenant base. Strengths: cost of living A+, housing A+, crime B; Watch: amenities F, commute F.
- Catoosa County (suburban): math 36% / reading 41% proficiency, ranked #49 of 174 in GA (top 28%) — families likely to look elsewhere, expect single-tenant / working-renter base with shorter leases.
- Zoned schools: Lakeview Middle School (math 24% / reading 32%, grade F, #265 of 470 statewide, top 57%, 690 students, 67% FRL) — zoned schools average 67% FRL vs 41% district-wide (26 pts higher); higher-poverty schools than district average — tighter screening recommended.
- Market conditions: Rents rising fast (+7.4%/yr); 425 active listings in the ZIP; 20 comparable units currently listed for rent nearby; rentals at typical pace (median 23d on market — plan ~3-4 weeks tenant-placement turnaround); 848 units permitted in Catoosa County in 2024 (256 in 5+ unit buildings).
Forward outlook
- Local home prices are declining (-3.0%/yr); year-one equity from $324 of loan paydown is wiped out by about $1k of value loss. Plan a longer hold.
- Catoosa County population projected at +5% by 2050 — modest demand growth; plan on rents tracking national, not racing it.
- At projected returns (-3.0% appreciation + 7.4% rent growth), your $13k cash investment doubles in ~2 years — after that, you're playing with house money.
Negotiation context
- Only 8 days on market — expect competitive offers; lowballing is unlikely to land.
- 2 sale attempts with the ask held roughly flat each time — persistent listings suggest the price (not the market) is what's stuck; bring a comps-based counter.
Risks & watch-outs
- Watch-outs: built in 1925 — expect roof / HVAC / electrical / plumbing capex.
- Climate carrying-cost: extreme-heat days projected 7→20/yr by 2055 (HVAC capex compounding) — expect insurance premiums to compound above CPI over the hold.
Questions for the listing agent
- Built in 1925 — when were the roof, HVAC, electrical panel, plumbing, and water heater last replaced?
- Is there a deadline driving the sale (1031 exchange, divorce, estate, relocation)? That informs how much negotiation room exists.
- Schools are F-rated, which usually means shorter tenancies and higher turnover. Who's the typical renter profile here, and what's been the actual vacancy rate?
- What's the average days-on-market for RENTAL listings here right now (not sales)? A rising rental-DOM trend means longer vacancies and softer asking-rent achievability than the comps imply.
- What's the recent tenant-quality profile in this submarket — average credit score on applications, eviction rate, late-payment / NSF rate, and stable-employment percentage? A property-management company in the area should have these aggregated.
- How much new for-sale + rental construction is in the pipeline within 1–3 miles? Heavy new supply typically softens prices + rents 12–24 months out; constrained supply supports both.
Investment metrics
- 1% rule
- 2.80% ✓
- Cap rate
- 25.51%
- Cash-on-cash
- 68.64%
- DSCR
- 4.05
- GRM
- 3.0
CMA / ARV
- ARV (on-the-fly)
- $230,594
- Comps found
- 12
Show comp detail 12 sales within ~0.75 mi
| Address | Dist | Beds/Ba | Sqft | Sold | Price | $/sf | Match |
|---|---|---|---|---|---|---|---|
| 411 School St | 0.60mi | 2/1.0 | 1,200 (-6%) | 0mo | $244,999 | $204 | 62 |
| 697 Cross St | 0.47mi | 3/1.0 (+1) | 1,200 (-6%) | 2mo | $235,000 | $196 | 61 |
| 151 S Elmwood St | 0.38mi | 2/1.0 | 1,136 (-11%) | 13mo | $195,000 | $172 | 54 |
| 310 School St | 0.66mi | 3/2.0 (+1) | 1,235 (-3%) | 2mo | $230,000 | $186 | 53 |
| 378 Warren St | 0.31mi | 3/1.0 (+1) | 1,101 (-14%) | 9mo | $235,000 | $213 | 51 |
| 222 Longview Dr | 0.45mi | 3/1.5 (+1) | 1,144 (-10%) | 9mo | $207,000 | $181 | 48 |
| 523 Pinewood Cir | 0.69mi | 3/1.5 (+1) | 1,344 (+6%) | 8mo | $200,000 | $149 | 45 |
| 72 Warren St | 0.47mi | 3/1.0 (+1) | 1,120 (-12%) | 13mo | $245,000 | $219 | 42 |
| 273 Grove St | 0.47mi | 3/2.0 (+1) | 1,424 (+12%) | 12mo | $210,000 | $147 | 39 |
| 111 Chambers St | 0.68mi | 2/2.0 | 1,140 (-10%) | 10mo | $195,000 | $171 | 39 |
| 41 Rosemart Cir | 0.73mi | 3/1.5 (+1) | 1,428 (+12%) | 1mo | $190,000 | $133 | 38 |
| 400 Hollywood Dr | 0.73mi | 3/2.0 (+1) | 1,165 (-9%) | 9mo | $200,000 | $172 | 35 |
Match score weights: distance 35% · size 25% · config 20% · recency 20%. Top-matched comps best support the ARV.
Projected returns pro-forma
-3.0% appreciation · 7.44% rent growth · sell at horizon
- IRR
- 72.9%
- Equity multiple
- 4.53×
- Total profit
- $46,365
- Equity at exit
- $6,993
- IRR
- 78.0%
- Equity multiple
- 10.86×
- Total profit
- $129,521
- Equity at exit
- $4,055
Cash invested: $13,132 (down + closing). Projections, not guarantees.
Landlord ↔ Tenant lean methodology
- Overall (STATE)
- 90 Strongly Landlord-Friendly
- State Georgia
- 90 Strongly Landlord-Friendly · R+3
- County
- — inherits STATE
- City
- — inherits STATE
ZIP-level market 30741
- Home prices YoY
- -30.7%
- Rents YoY
- 7.4%
- Active inventory
- 425
- Price-to-rent
- 3.0×
Monthly cashflow live
- Estimated rent
- $1,313 high interval (Pro) →
- Mortgage (P&I)
- −$246
- Tax from tax record
- −$20 /mo · $246/yr
- Insurance
- −$20
- HOA
- −$0
- Vacancy / Maint / Mgmt
- −$276
- Net cashflow
- $751
Break-even live
UW: 25.0% down · 7.5% · 30yr · 1.5% tax · 5.0% vac · 8.0% maint · 8.0% mgmt
Financing live
Cash to close
- Down payment
- $11,725
- Closing costs
- $1,407
- Reserves months
- —
- Total cash needed
- —
Loan-product check · same deal, 3 products live
Conventional
25% down · 7.5% · 30yr
- Down + closing
- —
- Monthly P&I
- —
- Monthly cashflow
- —
- DSCR
- —
- Eligible?
- —
Personal DTI + credit; lowest rate.
DSCR
20% down · 8.5% · 30yr
- Down + closing
- —
- Monthly P&I
- —
- Monthly cashflow
- —
- DSCR
- —
- Eligible?
- —
No personal income docs; deal must DSCR.
Hard money
10% down · 12.0% · 12mo
- Down + closing
- —
- Monthly P&I
- —
- Monthly cashflow
- —
- DSCR
- —
- Eligible?
- —
Short-term bridge; refi at stabilization.
Rent comps 20 comps
| Address | Beds | Baths | Sqft | Rent | $/sqft | DOM | Units | Dist |
|---|---|---|---|---|---|---|---|---|
| 1106 Carline Rd Rossville, GA | 2.0 | 1.5 | 1012 | $1,095 | $1.08 | 13d | 1 | 0.41mi |
| 1106 Carline Rd Apt B Rossville, GA | 2.0 | 1.5 | 877 | $1,095 | $1.25 | 21d | 1 | 0.41mi |
| 301 Corey Cir Fort Oglethorpe, GA | 2.0 | 2.0 | 1100 | $1,300 | $1.18 | 43d | 1 | 0.49mi |
| 704 Corey Cir Fort Oglethorpe, GA | 2.0 | 2.0 | 1100 | $1,300 | $1.18 | 13d | 2 | 0.49mi |
| 15 Greenway Dr Fort Oglethorpe, GA | 2.0 | 1.5 | 1150 | $1,149 | $1.00 | 43d | 2 | 0.63mi |
| 10 Mary Ln Rossville, GA | 3.0 | 1.5 | 1400 | $1,700 | $1.21 | 23d | 1 | 0.83mi |
| 100 Biltford Ave Rossville, GA | 2.0 | 1.0 | 1100 | $1,295 | $1.18 | 13d | 1 | 0.84mi |
| 108 Biltford Ave Rossville, GA | 2.0 | 1.0 | 1100 | $1,295 | $1.18 | 23d | 1 | 0.84mi |
| 819 Asterwood Dr Unit B Rossville, GA | 2.0 | 2.0 | 975 | $1,445 | $1.48 | 13d | 1 | 0.90mi |
| 361 Hogan Rd Unit C Rossville, GA | 2.0 | 2.0 | 1210 | $1,295 | $1.07 | 43d | 1 | 1.05mi |
| 813 Chickamauga Ave Unit A Rossville, GA | 2.0 | 1.0 | 900 | $1,099 | $1.22 | 23d | 1 | 1.05mi |
| 203 Ga Ln Unit 203 , GA | 2.0 | 2.0 | 995 | $1,445 | $1.45 | 13d | 1 | 1.13mi |
| 132 Hogan Rd Rossville, GA | 3.0 | 2.0 | 1248 | $1,975 | $1.58 | 43d | 1 | 1.14mi |
| 135 Hogan Rd Rossville, GA | 3.0 | 2.5 | 1839 | $1,975 | $1.07 | 43d | 1 | 1.18mi |
| 1591 Park City Rd Apt E15 Rossville, GA | 2.0 | 1.0 | 1050 | $1,145 | $1.09 | 23d | 1 | 1.19mi |
| 119 Hogan Rd Rossville, GA | 1.0 | 1.0 | 1242 | $850 | $0.68 | 43d | 1 | 1.23mi |
| 810 Schmitt Rd Rossville, GA | 2.0 | 1.5 | 1147 | $850 | $0.74 | 43d | 1 | 1.32mi |
| 403 Barnhardt Cir Fort Oglethorpe, GA | 2.0 | 1.5 | 1000 | $1,225 | $1.23 | 13d | 2 | 1.40mi |
| 61 Corley Ave Rossville, GA | 3.0 | 2.0 | 1304 | $1,823 | $1.40 | 23d | 1 | 1.46mi |
| 1830 Fant Dr Fort Oglethorpe, GA | 2.0–3.0 | 1.0 | 858 | $999 | $1.16 | 13d | 2 | 1.48mi |
Listing history 6 events
-
2026-06-18days on market $46,900 Active 8 DOM
-
2026-06-17days on market $46,900 Active 7 DOM
-
2026-06-16days on market $46,900 Active 6 DOM
-
2026-06-15days on market $46,900 Active 5 DOM
-
2026-06-14remarks 659-char remark
-
2026-06-14$46,900 Active 3 DOM
ⓘ Source: listings_history table (triggers on properties + properties_extension) + one-shot
backfill from property_details.listing_events for pre-trigger history.
Tax reassessment forecast GA · Resets to sale price
- Current annual tax
- $246 · $20/mo
- Projected year-2 tax
- $431 · $36/mo
- Expected delta
- +$186/yr (+$15/mo · 75.5%)
ⓘ Screening estimate from a state-policy table — verify with the county assessor before closing.
Climate risk First Street
- Flood 1/10 Low FEMA zone X (unshaded) · 0% chance over 30 yrs
- Wildfire 1/10 Low
- Heat 6/10 Major 7 d/yr ≥105°F today · 20 d/yr by 30 yrs out
- Wind 4/10 Moderate 12% chance of damaging wind over 30 yrs
- Air quality 3/10 Moderate 2 unhealthy d/yr today · 2 by 30 yrs out
Nearby sold comps map
Loading sold comps map…
Walkable amenities ~0.75 mi
Loading nearby amenities…
Taxation est. · year 1
- Rental income
- $15,754
- − Mortgage interest
- −$2,627
- − Property taxes
- −$246
- − Insurance
- −$234
- − Repairs & maintenance
- −$1,260
- − Management
- −$1,260
- − Depreciation
- −$1,364
- Taxable income
- $8,761
- Est. tax owed @ 24.0%
- −$2,103
- After-tax cash flow
- $6,911/yr
For passive investors: Depreciation is non-cash, so a rental often shows a tax loss while cash-flowing — sheltering income. Rental losses are passive: they offset passive income freely, and up to $25,000/yr can offset ordinary (W-2) income if you actively participate and your MAGI is under $100k (phasing out to $0 by $150k); unused losses carry forward. On sale, claimed depreciation is recaptured at up to 25%, and gains may owe capital-gains tax (a 1031 exchange can defer both). Figures are a year-1 estimate at your 24.0% rate — not tax advice; consult a CPA.
Schools (NCES district)
- District
- Catoosa County
- NCES district ID
- 1300930
- Math proficiency
- 36% ▼ -15.00%
- Reading proficiency
- 41% ▼ -8.00%
- Median HH income
- $48,913
- Composite
- 33.13/100
- National rank
- #5558
- State rank
- #49 of 174 in GA
Livability — Lakeview
- Score
- 69/100
- State rank
- #106
- US rank
- #8207
Category grades
Schools grade is shown separately in the Schools card above.
Census & demographics
- County
- Walker County · 48,831 people
- Metro
- Chattanooga, TN-GA
- Population (ZIP)
- 30,041
- Household income
- $58,834
- Rent vs Own
- Severe rent burden
- 834.0
Population outlook (Catoosa County) Hauer SSP2
- Today (2025)
- 70,112 people
- By 2030
- 71,621 · +2.2%
- By 2040
- 73,595 · +5.0%
- By 2050
- 73,921 · +5.4%
- By 2075
- 72,135 · +2.9%
- By 2100
- 65,979 · -5.9%
Race, ethnicity, and origin ACS 2023
- Neighborhood character
- Predominantly White (86%)
- Race & ethnicity
- White 86% Black 5% Two or more races 5% Hispanic / Latino 5%
- Common ancestry
- Slovak 3% Iranian 2% Italian 1%
- Foreign-born
- 2% · Canada
- Languages at home
- 96% English-only · Spanish 3%
Political lean MEDSL · Catoosa
- 2024 margin
- Solid R (+55.5) · D 22.0% · R 77.5%
- 2008→2024 swing
- -5.7pp toward R · 2008: -49.8pp · 2024: -55.5pp
- All cycles
- 2024: R+55.5 2020: R+56.0 2016: R+60.7 2012: R+52.8 2008: R+49.8
Not yet ingested
- Civics
- —
Market trends
- HPI YoY
- ▼ -118.05%
- Current HPI
- 267.0047
- Rent YoY
- ▲ 7.44%
- Metro
- Chattanooga, TN-GA
- State GDP YoY
- ▲ 2.66%
- F500 in state
- 28
Industry mix (Fortune 500 HQ in GA)
| Industry | F500 HQs | Revenue |
|---|---|---|
| Paper / Packaging | 2 | $29B |
|
||
| Retail | 1 | $160B |
|
||
| Transportation / Logistics | 1 | $91B |
|
||
| Airlines | 1 | $62B |
|
||
| Consumer Goods | 1 | $47B |
|
||
| Utilities | 1 | $25B |
|
||
Price history
+0.0% since first listed2 events — show timeline
- 2026-06-10 Listed $46,900 GAMLS
- 2026-06-10 Listed $46,900 FMLS
Property tax history
+75.8%/yrLatest (2025): $246 · -5.4% YoY. Source: county tax records.
Cash-flow waterfall
monthlySold comps — $/sqft
last 12 mo · ≤1 miLoading sold comps…