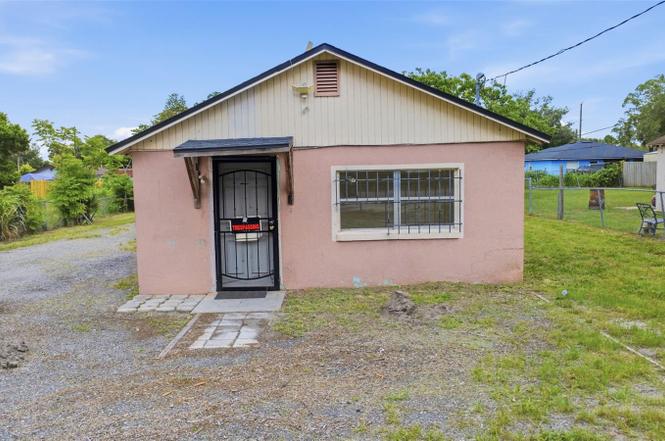
1215 S Delaware Ave · DeLand Southwest, FL
Flood risk 1/10 · Minimal
- FEMA flood zone
- X (unshaded)
- Chance of flooding over 30 yrs
- 0.0%
- Est. flood insurance / yr
- $507 – $1,088
Fire risk 1/10 · Minimal
- Est. fire insurance / yr
- $947 – $1,759
Heat risk 9/10 · Severe
- Hot days now (above 107°F)
- 7 days/yr
- Hot days in 30 yrs
- 20 days/yr
Wind risk 9/10 · Severe
- Chance of severe wind over 30 yrs
- 99.0%
Air-quality risk 2/10 · Minimal
- Unhealthy air days now
- 1 days/yr
- Unhealthy air days in 30 yrs
- 1 days/yr
Risk factors via First Street. Map © Google.
Why this score? — see what drove the B grade
The composite is a weighted blend of 9 inputs, each scored 0–100. Each bar is that input's sub-score; the figure is the points it added to the 100-point composite (weight × sub-score).
- Cash flow +30.0/30.0
- 1% rule +10.0/10.0
- DSCR +10.0/10.0
- ARV discount +7.5/15.0
- Schools +3.9/10.0
- Livability +3.6/5.0
- Rent growth +3.3/5.0
- Condition / age +2.5/5.0
- Appreciation +0.0/10.0
$99,900
🖨 Deal sheet (PDF) 📄 Offer letter ✓ Due diligence
Listing remarks
This 3-bedroom, 1-bath home offers approximately 800 heated square feet on a . 18-acre lot with driveway parking, appliances present, and a spacious backyard with room to make the most of outdoor space. This property is a renovation opportunity for buyers seeking a value-add project, rental investment, resale opportunity, or affordable home renovation. The floor plan is light and bright, offering a manageable footprint for improvement. The large backyard adds appeal for outdoor living, pets, gardening, or future enhancement. Located near Historic Downtown DeLand, Stetson University, local dining, shopping, parks, medical services, and major commuter routes, the property also offers access t
Key facts
- Near dining
- Near shopping
- Near local parks
Tags
Property features AI
Finance
- Other: Zoning: 01R4
- Financial info: No lease restrictions
- HOA & community: No HOA/association; Development not on the list
Exterior
- Parking: No parking information listed
- Security: No security features listed
- Utilities: Public water; Public sewer; Electricity connected
- Home design: Single family residence; Residential property; One story; Faces west; Fixer condition
- Construction: Concrete construction; Shingle roof; Slab foundation; Built on a 50 x 160 lot (approximately 0.18 acres)
- Exterior features: Chain link fencing; Paved road access
Interior
- Kitchen: Range; Refrigerator
- Bedrooms: 2 bedrooms
- Flooring: Tile flooring
- Bathrooms: 1 full bathroom
- Heating & cooling: Central heating; Central air
- Interior features: No interior features listed; Central heating; Central air
- Laundry & utility: No laundry features listed
Neighborhood map
What this means for you Summary
Snapshot
- This is a 2-bed/1.0-bath single-family listed at $100k.
Deal economics
- At list price, monthly cash flow is $465 ($6k/yr) — positive.
- The deal already cash-flows at list — no discount required.
- Meets the 1% rule at list price ($2k rent vs $100k).
Location & tenants
- Location reads 72/100 on livability (#331 in FL) — a middle-class / working-renter tenant base. Strengths: crime A+, cost of living A+, housing A+; Watch: amenities F, commute F, employment D-.
- Volusia (suburban): math 44% / reading 49% proficiency, ranked #47 of 73 in FL (top 64%) — families likely to look elsewhere, expect single-tenant / working-renter base with shorter leases.
- Zoned schools: Woodward Avenue Elementary School (math 44% / reading 45%, grade F, #1,288 of 2,144 statewide, top 62%, 554 students, 70% FRL); Southwestern Middle School (math 38% / reading 44%, grade F, #353 of 571 statewide, top 63%, 697 students, 63% FRL); Deland High School (math 26% / reading 45%, grade F, #367 of 667 statewide, top 57%, 2,926 students, 50% FRL).
- Market conditions: Rents rising (+3.4%/yr); 438 active listings in the ZIP; 12 comparable units currently listed for rent nearby; rentals at typical pace (median 25d on market — plan ~3-4 weeks tenant-placement turnaround); 3,402 units permitted in Volusia County in 2024 (681 in 5+ unit buildings).
Forward outlook
- Local home prices are declining (-3.0%/yr); year-one equity from $691 of loan paydown is wiped out by about $3k of value loss. Plan a longer hold.
- Volusia County population projected at +19% by 2050 — long-run rental-demand tailwind backs the buy-and-hold thesis.
- At projected returns (-3.0% appreciation + 3.4% rent growth), your $28k cash investment doubles in ~6 years — after that, you're playing with house money.
Negotiation context
- Only 4 days on market — expect competitive offers; lowballing is unlikely to land.
Risks & watch-outs
- Watch-outs: built in 1940 — expect roof / HVAC / electrical / plumbing capex.
- Climate carrying-cost: severe wind risk, 99% chance of damaging wind over 30y; extreme-heat days projected 7→20/yr by 2055 (HVAC capex compounding) — expect insurance premiums to compound above CPI over the hold.
Questions for the listing agent
- Built in 1940 — when were the roof, HVAC, electrical panel, plumbing, and water heater last replaced?
- Is there a deadline driving the sale (1031 exchange, divorce, estate, relocation)? That informs how much negotiation room exists.
- Schools are F-rated, which usually means shorter tenancies and higher turnover. Who's the typical renter profile here, and what's been the actual vacancy rate?
- What's the average days-on-market for RENTAL listings here right now (not sales)? A rising rental-DOM trend means longer vacancies and softer asking-rent achievability than the comps imply.
- What's the recent tenant-quality profile in this submarket — average credit score on applications, eviction rate, late-payment / NSF rate, and stable-employment percentage? A property-management company in the area should have these aggregated.
- How much new for-sale + rental construction is in the pipeline within 1–3 miles? Heavy new supply typically softens prices + rents 12–24 months out; constrained supply supports both.
Investment metrics
- 1% rule
- 1.51% ✓
- Cap rate
- 11.87%
- Cash-on-cash
- 19.93%
- DSCR
- 1.89
- GRM
- 5.5
CMA / ARV
No comps found within radius.
Projected returns pro-forma
-3.0% appreciation · 3.36% rent growth · sell at horizon
- IRR
- 12.5%
- Equity multiple
- 1.50×
- Total profit
- $13,996
- Equity at exit
- $14,895
- IRR
- 21.7%
- Equity multiple
- 2.89×
- Total profit
- $52,732
- Equity at exit
- $8,638
Cash invested: $27,972 (down + closing). Projections, not guarantees.
Landlord ↔ Tenant lean methodology
- Overall (STATE)
- 87 Strongly Landlord-Friendly
- State Florida
- 87 Strongly Landlord-Friendly · R+3
- County
- — inherits STATE
- City
- — inherits STATE
ZIP-level market 32720
- Rents YoY
- 3.4%
- Active inventory
- 438
- Price-to-rent
- 5.5×
Monthly cashflow live
- Estimated rent
- $1,505 high interval (Pro) →
- Mortgage (P&I)
- −$524
- Tax from tax record
- −$159 /mo · $1,904/yr
- Insurance
- −$42
- HOA
- −$0
- Vacancy / Maint / Mgmt
- −$316
- Net cashflow
- $465
Break-even live
Sensitivity live
| Price | -10% $521 | -5% $493 | +0% $465 | +5% $436 | +10% $408 |
|---|---|---|---|---|---|
| Rent | -10% $346 | -5% $405 | +0% $465 | +5% $524 | +10% $584 |
| Rate | -1.0pp $515 | -0.5pp $490 | base $465 | +0.5pp $439 | +1.0pp $412 |
UW: 25.0% down · 7.5% · 30yr · 1.5% tax · 5.0% vac · 8.0% maint · 8.0% mgmt
Financing live
Cash to close
- Down payment
- $24,975
- Closing costs
- $2,997
- Reserves months
- —
- Total cash needed
- —
Loan-product check · same deal, 3 products live
Conventional
25% down · 7.5% · 30yr
- Down + closing
- —
- Monthly P&I
- —
- Monthly cashflow
- —
- DSCR
- —
- Eligible?
- —
Personal DTI + credit; lowest rate.
DSCR
20% down · 8.5% · 30yr
- Down + closing
- —
- Monthly P&I
- —
- Monthly cashflow
- —
- DSCR
- —
- Eligible?
- —
No personal income docs; deal must DSCR.
Hard money
10% down · 12.0% · 12mo
- Down + closing
- —
- Monthly P&I
- —
- Monthly cashflow
- —
- DSCR
- —
- Eligible?
- —
Short-term bridge; refi at stabilization.
Rent comps 12 comps
| Address | Beds | Baths | Sqft | Rent | $/sqft | DOM | Units | Dist |
|---|---|---|---|---|---|---|---|---|
| 1312 Water Willow Dr DeLand, FL | 1.0–2.0 | 1.0–2.0 | 785 | $1,324 | $1.69 | 25d | 1 | 0.19mi |
| 101 E New Hampshire Ave Deland, FL | 1.0 | 1.0 | 576 | $1,140 | $1.98 | 12d | 11 | 0.48mi |
| 703 W Chelsea St Deland, FL | 3.0 | 2.0 | 1000 | $1,695 | $1.70 | 15d | 1 | 0.68mi |
| 1516 S Boundary St Deland, FL | 2.0 | 1.0 | 1076 | $1,650 | $1.53 | 22d | 1 | 0.73mi |
| 737 S Stone St Deland, FL | 3.0 | 1.5 | 1050 | $1,695 | $1.61 | 25d | 1 | 0.76mi |
| 117 E Euclid Ave DeLand, FL | 1.0 | 1.0 | 998 | $2,400 | $2.40 | 25d | 1 | 1.05mi |
| 821 Margaret St Apt A DeLand, FL | 2.0 | 2.0 | 810 | $1,450 | $1.79 | 25d | 1 | 1.08mi |
| 307 S Montgomery Ave Apt A DeLand, FL | 1.0 | 1.0 | 850 | $899 | $1.06 | 25d | 1 | 1.36mi |
| 125 S Salisbury Ave Unit B4 DeLand, FL | 2.0 | 1.0 | 800 | $1,200 | $1.50 | 25d | 1 | 1.42mi |
| 125 S Salisbury Ave Deland, FL | 2.0 | 1.0 | 625 | $1,200 | $1.92 | 15d | 2 | 1.42mi |
| 240 E Howry Ave DeLand, FL | 2.0 | 1.0 | 816 | $1,500 | $1.84 | 25d | 1 | 1.43mi |
| 400 E Howry Ave Deland, FL | 1.0–2.0 | 1.0–2.0 | 956 | $1,995 | $2.09 | 12d | 25 | 1.46mi |
Listing history 5 events
-
2026-06-18days on market $99,900 Active 4 DOM
-
2026-06-17days on market $99,900 Active 3 DOM
-
2026-06-16days on market $99,900 Active 2 DOM
-
2026-06-15remarks 699-char remark
-
2026-06-15$99,900 Active 1 DOM
ⓘ Source: listings_history table (triggers on properties + properties_extension) + one-shot
backfill from property_details.listing_events for pre-trigger history.
Tax reassessment forecast FL · Resets to sale price
- Current annual tax
- $1,904 · $159/mo
- Projected year-2 tax
- $1,904 · $159/mo
- Expected delta
- $0/yr ($0/mo · 0.0%)
ⓘ Screening estimate from a state-policy table — verify with the county assessor before closing.
Climate risk First Street
- Flood 1/10 Low FEMA zone X (unshaded) · 0% chance over 30 yrs
- Wildfire 1/10 Low
- Heat 9/10 Extreme 7 d/yr ≥107°F today · 20 d/yr by 30 yrs out
- Wind 9/10 Extreme 99% chance of damaging wind over 30 yrs
- Air quality 2/10 Low 1 unhealthy d/yr today · 1 by 30 yrs out
Nearby sold comps map
Loading sold comps map…
Walkable amenities ~0.75 mi
Loading nearby amenities…
Taxation est. · year 1
- Rental income
- $18,058
- − Mortgage interest
- −$5,596
- − Property taxes
- −$1,904
- − Insurance
- −$500
- − Repairs & maintenance
- −$1,445
- − Management
- −$1,445
- − Depreciation
- −$2,906
- Taxable income
- $4,263
- Est. tax owed @ 24.0%
- −$1,023
- After-tax cash flow
- $4,553/yr
For passive investors: Depreciation is non-cash, so a rental often shows a tax loss while cash-flowing — sheltering income. Rental losses are passive: they offset passive income freely, and up to $25,000/yr can offset ordinary (W-2) income if you actively participate and your MAGI is under $100k (phasing out to $0 by $150k); unused losses carry forward. On sale, claimed depreciation is recaptured at up to 25%, and gains may owe capital-gains tax (a 1031 exchange can defer both). Figures are a year-1 estimate at your 24.0% rate — not tax advice; consult a CPA.
Schools (NCES district)
- District
- Volusia
- NCES district ID
- 1201920
- Math proficiency
- 44% ▼ -9.00%
- Reading proficiency
- 49% ▼ -3.00%
- Median HH income
- $42,946
- Composite
- 39.2/100
- National rank
- #4019
- State rank
- #47 of 73 in FL
Livability — DeLand Southwest
- Score
- 72/100
- State rank
- #331
- US rank
- #5773
Category grades
Schools grade is shown separately in the Schools card above.
Census & demographics
- Census place
- DeLand Southwest, FL
- County
- Volusia County · 556,871 people
- Metro
- Deltona-Daytona Beach-Ormond Beach, FL
- Population (ZIP)
- 36,259
- Household income
- $68,830
- Rent vs Own
- Severe rent burden
- 1145.0
Population outlook (Volusia County) Hauer SSP2
- Today (2025)
- 572,749 people
- By 2030
- 598,695 · +4.5%
- By 2040
- 644,880 · +12.6%
- By 2050
- 681,451 · +19.0%
- By 2075
- 759,957 · +32.7%
- By 2100
- 778,902 · +36.0%
Race, ethnicity, and origin ACS 2023
- Neighborhood character
- Majority White (64%)
- Race & ethnicity
- White 64% Hispanic / Latino 21% Black 11% Two or more races 9%
- Hispanic origin (detail)
- Mexican 6% Puerto Rican 9% Cuban 3%
- Common ancestry
- Lithuanian 1% Slovak 1% Serbian 1%
- Foreign-born
- 7% · Canada, Jamaica, Vietnam
- Languages at home
- 85% English-only · Spanish 13%
Political lean MEDSL · Volusia
- 2024 margin
- Strong R (+21.8) · D 38.7% · R 60.5%
- 2008→2024 swing
- -27.4pp toward R · 2008: 5.7pp · 2024: -21.8pp
- All cycles
- 2024: R+21.8 2020: R+14.1 2016: R+13.1 2012: R+1.2 2008: D+5.7
Not yet ingested
- Civics
- —
Market trends
- HPI YoY
- ▼ -194.54%
- Current HPI
- 330.7324
- Rent YoY
- ▲ 3.36%
- Metro
- Deltona-Daytona Beach-Ormond Beach, FL
- State GDP YoY
- ▲ 3.28%
- F500 in state
- 36
Industry mix (Fortune 500 HQ in FL)
| Industry | F500 HQs | Revenue |
|---|---|---|
| Industrial Technology | 2 | $29B |
|
||
| Insurance | 2 | $17B |
|
||
| Retail | 1 | $60B |
|
||
| Technology Distribution | 1 | $58B |
|
||
| Homebuilding | 1 | $35B |
|
||
| Technology Manufacturing | 1 | $35B |
|
||
Price history
1 event — show timeline
- 2026-06-14 Listed $99,900 Stellar MLS as Distributed by MLS Grid
Property tax history
+11.0%/yrLatest (2025): $1,904 · -0.1% YoY. Source: county tax records.
Cash-flow waterfall
monthlySold comps — $/sqft
last 12 mo · ≤1 miLoading sold comps…