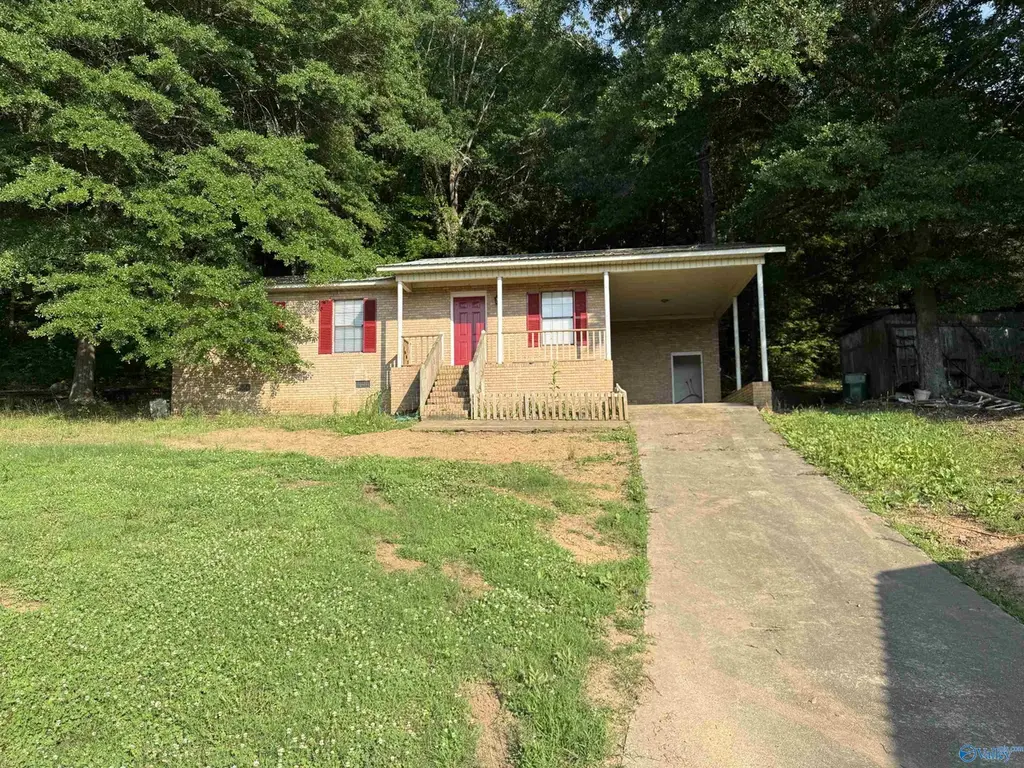
180 County Road 41 · Cedar Bluff, AL
Flood risk 1/10 · Minimal
- FEMA flood zone
- X (unshaded)
- Chance of flooding over 30 yrs
- 0.0%
- Est. flood insurance / yr
- $507 – $1,088
Fire risk 6/10 · Moderate
- Est. fire insurance / yr
- $916 – $1,700
Heat risk 5/10 · Moderate
- Hot days now (above 106°F)
- 7 days/yr
- Hot days in 30 yrs
- 18 days/yr
Wind risk 4/10 · Minor
- Chance of severe wind over 30 yrs
- 18.0%
Air-quality risk 2/10 · Minimal
- Unhealthy air days now
- 1 days/yr
- Unhealthy air days in 30 yrs
- 1 days/yr
Risk factors via First Street. Map © Google.
Why this score? — see what drove the B grade
The composite is a weighted blend of 9 inputs, each scored 0–100. Each bar is that input's sub-score; the figure is the points it added to the 100-point composite (weight × sub-score).
- Cash flow +30.0/30.0
- DSCR +10.0/10.0
- 1% rule +9.6/10.0
- ARV discount +7.5/15.0
- Appreciation +5.5/10.0
- Livability +3.2/5.0
- Schools +2.7/10.0
- Rent growth +2.5/5.0
- Condition / age +2.5/5.0
$119,900
🖨 Deal sheet 📄 Offer letter ✓ Due diligence
Listing remarks MLS
This 3 Bd 1 Ba Brick is a prefect home in a quiet Country setting. Please call the listing agent for instructions. OCCUPANTS ARE ABSOLUTELY NOT TO BE DISTURBED!! * * SOLD SIGHT UNSEEN * * NO SHOWINGS * * NO INTERIOR ACCESS * * Property is being sold occupied with all occupants in AS IS/WHERE IS condition. Cash sale only. Neither the seller nor the listing broker can verify the existence of any lease agreement, either written or verbal, nor any rental amount being paid, due, or owing. The buyer is assuming ALL responsibility for any necessary eviction action. Listing broker & seller assume no responsibility and make no guarantees, warranties, or representations as to the availability or accuracy of the information herein. All info must be verified by the purchaser. The Seller is the USDA.
Key facts
- Outbuilding
- Screened back porch
- 1 acre lot
Tags
Property features AI
Finance
- Other: Subdivision: Metes And Bounds
- HOA & community: No homeowners association
Exterior
- Parking: Attached carport
- Utilities: Septic tank sewer
- Home design: Single-family residence; One story; Built in 1993
- Construction: No fireplaces
- Exterior features: 1-acre lot; Lot dimensions approximately 210' x 210' x 210' x 210'; Public water source
Interior
- Bathrooms: 1 full bathroom
- Heating & cooling: Central heating; Central cooling
- Interior features: Crawl space basement; 5 total rooms
Neighborhood map
What this means for you Summary
Snapshot
- This is a 3-bed/1.0-bath single-family listed at $120k.
Deal economics
- At list price, monthly cash flow is $638 ($8k/yr) — positive.
- The deal already cash-flows at list — no discount required.
- Meets the 1% rule at list price ($2k rent vs $120k).
- Cap rate 12.7% vs local median 0.9% in Cedar Bluff — top-decile yield for the area; either an underpriced asset or a hidden risk that comps aren't pricing in. Stress-test before assuming the spread holds.
Location & tenants
- Location reads 64/100 on livability (#152 in AL) — a middle-class / working-renter tenant base. Strengths: cost of living A+, housing A+; Watch: amenities F, commute F, employment F.
- Cherokee County (rural): math 21% / reading 45% proficiency, ranked #58 of 129 in AL (top 45%) — families likely to look elsewhere, expect single-tenant / working-renter base with shorter leases.
- Zoned schools: Centre Middle School (math 24% / reading 45%, grade F, #90 of 257 statewide, top 38%, 457 students, 74% FRL) — zoned schools average 74% FRL vs 53% district-wide (21 pts higher); higher-poverty schools than district average — tighter screening recommended.
- Market conditions: 24 active listings in the ZIP; 39 units permitted in Cherokee County in 2024 (0 in 5+ unit buildings).
Forward outlook
- In year one you build about $2k of equity ($829 loan paydown + $1k appreciation (1.0% local appreciation)).
- Cherokee County population projected at -17% by 2050 — secular population decline; favor cash flow + early exit over multi-decade hold.
- At projected returns (1.0% appreciation + 3.0% rent growth), your $34k cash investment doubles in ~4 years — after that, you're playing with house money.
Negotiation context
- Only 7 days on market — expect competitive offers; lowballing is unlikely to land.
- 2 sale attempts since 5y ago with the ask held roughly flat each time — persistent listings suggest the price (not the market) is what's stuck; bring a comps-based counter.
- Current owner paid $57k; list at $120k implies a 111% gain — meaningful room to come down on a strong offer.
Risks & watch-outs
- Climate carrying-cost: major wildfire risk; extreme-heat days projected 7→18/yr by 2055 (HVAC capex compounding) — expect insurance premiums to compound above CPI over the hold.
Questions for the listing agent
- Is there a deadline driving the sale (1031 exchange, divorce, estate, relocation)? That informs how much negotiation room exists.
- Schools are D-rated, which usually means shorter tenancies and higher turnover. Who's the typical renter profile here, and what's been the actual vacancy rate?
- What's the average days-on-market for RENTAL listings here right now (not sales)? A rising rental-DOM trend means longer vacancies and softer asking-rent achievability than the comps imply.
- What's the recent tenant-quality profile in this submarket — average credit score on applications, eviction rate, late-payment / NSF rate, and stable-employment percentage? A property-management company in the area should have these aggregated.
- How much new for-sale + rental construction is in the pipeline within 1–3 miles? Heavy new supply typically softens prices + rents 12–24 months out; constrained supply supports both.
Investment metrics
- 1% rule
- 1.46% ✓
- Cap rate
- 12.68%
- Cash-on-cash
- 22.80%
- DSCR
- 2.01
- GRM
- 5.7
CMA / ARV
No comps found within radius.
Projected returns pro-forma
1.01% appreciation · 3.0% rent growth · sell at horizon
- IRR
- 25.0%
- Equity multiple
- 2.28×
- Total profit
- $42,924
- Equity at exit
- $41,017
- IRR
- 27.7%
- Equity multiple
- 4.34×
- Total profit
- $112,209
- Equity at exit
- $54,574
Cash invested: $33,572 (down + closing). Projections, not guarantees.
Landlord ↔ Tenant lean methodology
- Overall (STATE)
- 90 Strongly Landlord-Friendly
- State Alabama
- 90 Strongly Landlord-Friendly · R+15
- County
- — inherits STATE
- City
- — inherits STATE
ZIP-level market 35973
- Home prices YoY
- 0.6%
- Active inventory
- 24
- Price-to-rent
- 5.7×
Monthly cashflow live
- Estimated rent
- $1,755 medium interval (Pro) →
- Mortgage (P&I)
- −$629
- Tax from tax record
- −$70 /mo · $835/yr
- Insurance
- −$50
- HOA
- −$0
- Vacancy / Maint / Mgmt
- −$368
- Net cashflow
- $638
Break-even live
UW: 25.0% down · 7.5% · 30yr · 1.5% tax · 5.0% vac · 8.0% maint · 8.0% mgmt
Financing live
Cash to close
- Down payment
- $29,975
- Closing costs
- $3,597
- Reserves months
- —
- Total cash needed
- —
Loan-product check · same deal, 3 products live
Conventional
25% down · 7.5% · 30yr
- Down + closing
- —
- Monthly P&I
- —
- Monthly cashflow
- —
- DSCR
- —
- Eligible?
- —
Personal DTI + credit; lowest rate.
DSCR
20% down · 8.5% · 30yr
- Down + closing
- —
- Monthly P&I
- —
- Monthly cashflow
- —
- DSCR
- —
- Eligible?
- —
No personal income docs; deal must DSCR.
Hard money
10% down · 12.0% · 12mo
- Down + closing
- —
- Monthly P&I
- —
- Monthly cashflow
- —
- DSCR
- —
- Eligible?
- —
Short-term bridge; refi at stabilization.
Listing history 7 events
-
2026-06-19days on market $119,900 Active 7 DOM
-
2026-06-18days on market $119,900 Active 6 DOM
-
2026-06-17days on market $119,900 Active 5 DOM
-
2026-06-16days on market $119,900 Active 4 DOM
-
2026-06-15days on market $119,900 Active 3 DOM
-
2026-06-13remarks 587-char remark
-
2026-06-13$119,900 Active 1 DOM
ⓘ Source: listings_history table (triggers on properties + properties_extension) + one-shot
backfill from property_details.listing_events for pre-trigger history.
Tax reassessment forecast AL · Resets to sale price
- Current annual tax
- $835 · $70/mo
- Projected year-2 tax
- $835 · $70/mo
- Expected delta
- $0/yr ($0/mo · 0.0%)
ⓘ Screening estimate from a state-policy table — verify with the county assessor before closing.
Climate risk First Street
- Flood 1/10 Low FEMA zone X (unshaded) · 0% chance over 30 yrs
- Wildfire 6/10 Major
- Heat 5/10 Major 7 d/yr ≥106°F today · 18 d/yr by 30 yrs out
- Wind 4/10 Moderate 18% chance of damaging wind over 30 yrs
- Air quality 2/10 Low 1 unhealthy d/yr today · 1 by 30 yrs out
Nearby sold comps map
Loading sold comps map…
Walkable amenities ~0.75 mi
Loading nearby amenities…
Taxation est. · year 1
- Rental income
- $21,055
- − Mortgage interest
- −$6,716
- − Property taxes
- −$835
- − Insurance
- −$600
- − Repairs & maintenance
- −$1,684
- − Management
- −$1,684
- − Depreciation
- −$3,488
- Taxable income
- $6,048
- Est. tax owed @ 24.0%
- −$1,451
- After-tax cash flow
- $6,203/yr
For passive investors: Depreciation is non-cash, so a rental often shows a tax loss while cash-flowing — sheltering income. Rental losses are passive: they offset passive income freely, and up to $25,000/yr can offset ordinary (W-2) income if you actively participate and your MAGI is under $100k (phasing out to $0 by $150k); unused losses carry forward. On sale, claimed depreciation is recaptured at up to 25%, and gains may owe capital-gains tax (a 1031 exchange can defer both). Figures are a year-1 estimate at your 24.0% rate — not tax advice; consult a CPA.
Schools (NCES district)
- District
- Cherokee County
- NCES district ID
- 0100630
- Math proficiency
- 21% ▼ -25.00%
- Reading proficiency
- 45% ▲ 4.00%
- Median HH income
- $37,824
- Composite
- 27.43/100
- National rank
- #6965
- State rank
- #58 of 129 in AL
Livability — Cedar Bluff
- Score
- 64/100
- State rank
- #152
- US rank
- #13868
Category grades
Schools grade is shown separately in the Schools card above.
Census & demographics
- Population (ZIP)
- 3,313
Population outlook (Cherokee County) Hauer SSP2
- Today (2025)
- 24,929 people
- By 2030
- 24,177 · -3.0%
- By 2040
- 22,411 · -10.1%
- By 2050
- 20,595 · -17.4%
- By 2075
- 17,025 · -31.7%
- By 2100
- 13,700 · -45.0%
Race, ethnicity, and origin ACS 2023
- Neighborhood character
- Predominantly White (95%)
- Race & ethnicity
- White 95% Two or more races 3% Native American 2%
- Common ancestry
- Slovak 4% Italian 1% Serbian 1%
- Foreign-born
- 0%
Political lean MEDSL · Cherokee
- 2024 margin
- Solid R (+75.5) · D 12.0% · R 87.5%
- 2008→2024 swing
- -24.3pp toward R · 2008: -51.2pp · 2024: -75.5pp
- All cycles
- 2024: R+75.5 2020: R+72.8 2016: R+69.4 2012: R+55.0 2008: R+51.2
Not yet ingested
- Civics
- —
Market trends
- HPI YoY
- ▲ 1.01%
- Current HPI
- 174.5756
- Rent YoY
- —
- Metro
- —
- State GDP YoY
- ▲ 2.94%
- F500 in state
- 4
Industry mix (Fortune 500 HQ in AL)
| Industry | F500 HQs | Revenue |
|---|---|---|
| Financial Services | 1 | $8B |
|
||
| Healthcare | 1 | $5B |
|
||
Price history
+113.8% since first listed4 events — show timeline
- 2026-06-12 Listed $119,900 VMLS
- 2022-01-14 Sold (MLS) $56,900 Greater Alabama MLS
- 2021-12-22 Delisted — Greater Alabama MLS
- 2021-12-02 Listed $56,090 Greater Alabama MLS
Property tax history
+2.5%/yrLatest (2025): $835 · +1.0% YoY. Source: county tax records.
Cash-flow waterfall
monthlySold comps — $/sqft
last 12 mo · ≤1 miLoading sold comps…