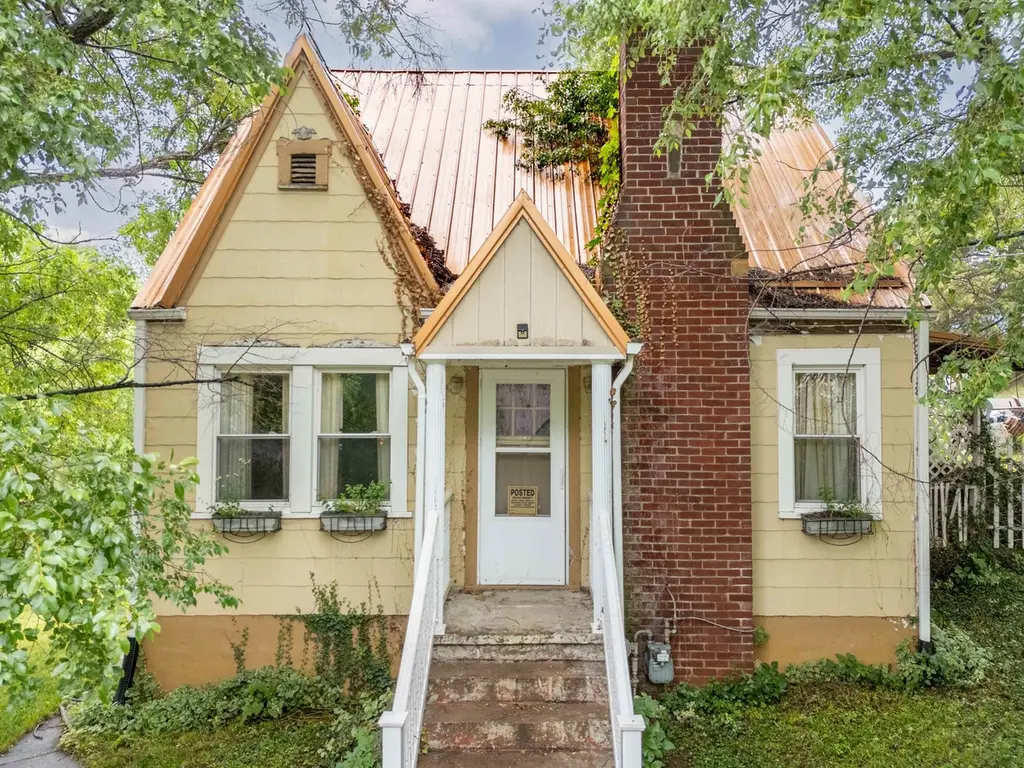
15 Fourth St SE · Pulaski, VA
Flood risk 1/10 · Minimal
- FEMA flood zone
- X (unshaded)
- Chance of flooding over 30 yrs
- 0.0%
- Est. flood insurance / yr
- $507 – $1,088
Fire risk 3/10 · Minor
- Est. fire insurance / yr
- $666 – $1,236
Heat risk 4/10 · Minor
- Hot days now (above 93°F)
- 8 days/yr
- Hot days in 30 yrs
- 23 days/yr
Wind risk 2/10 · Minimal
- Chance of severe wind over 30 yrs
- —
Air-quality risk 1/10 · Minimal
- Unhealthy air days now
- 0 days/yr
- Unhealthy air days in 30 yrs
- 0 days/yr
Risk factors via First Street. Map © Google.
Why this score? — see what drove the B grade
The composite is a weighted blend of 9 inputs, each scored 0–100. Each bar is that input's sub-score; the figure is the points it added to the 100-point composite (weight × sub-score).
- Cash flow +30.0/30.0
- 1% rule +10.0/10.0
- DSCR +10.0/10.0
- ARV discount +7.5/15.0
- Schools +4.6/10.0
- Livability +3.4/5.0
- Rent growth +2.5/5.0
- Condition / age +2.5/5.0
- Appreciation +0.0/10.0
$50,000
🖨 Deal sheet 📄 Offer letter ✓ Due diligence
Listing remarks
Attention investors! Have you been searching for your next project? Look no further than 15 4th Street! Conveniently located to all of the amenities of Historic Pulaski, Virginia, this adorable home is ready to be brought back to life! Featuring 3 bedrooms, 1 bath, a newer metal roof, and a fully fenced yard, this home offers endless potential to make your vision a reality! In addition to being the perfect canvas for your work, this home is a short distance from local attractions such as Calfee Park, Claytor Lake State Park, and the New River Trail. Act fast and don't miss out on the opportunity to add this property to your investment portfolio! Schedule your showing today!
Key facts
- Newer metal roof
- Fully fenced yard
- 8,712 sq ft lot
Tags
Property features AI
Exterior
- Parking: Asphalt parking
- Utilities: Public water; Public sewer
- Home design: Single-family detached residence; Single-story
- Construction: Metal roof
- Exterior features: Patio; Fenced yard; Shed(s)
Interior
- Kitchen: Electric range; Refrigerator
- Bedrooms: Total of 6 rooms (bedrooms included within room count)
- Bathrooms: 1 full bathroom
- Heating & cooling: Baseboard electric heating
- Interior features: Masonry fireplace in the living room; Concrete partial basement
- Laundry & utility: Washer/dryer hookups in the basement; Electric water heater
Neighborhood map
What this means for you Summary
Snapshot
- This is a 3-bed/1.0-bath single-family listed at $50k.
Deal economics
- At list price, monthly cash flow is $753 ($9k/yr) — positive.
- The deal already cash-flows at list — no discount required.
- Meets the 1% rule at list price ($1k rent vs $50k).
- Cap rate 24.4% vs local median 5.5% in Pulaski — top-decile yield for the area; either an underpriced asset or a hidden risk that comps aren't pricing in. Stress-test before assuming the spread holds.
Location & tenants
- Location reads 67/100 on livability (#297 in VA) — a middle-class / working-renter tenant base. Strengths: cost of living A+, housing A+, health & safety A+; Watch: employment D+, crime F, amenities F.
- Pulaski County Public School District (rural): math 48% / reading 61% proficiency, ranked #86 of 131 in VA (top 66%) — acceptable for families but not a draw, mixed tenant base, ~2y average lease.
- Zoned schools: Critzer Elementary (math 42% / reading 47%, grade F, #827 of 1,108 statewide, top 77%, 402 students, 80% FRL); Pulaski County Middle (math 38% / reading 60%, grade C-, #238 of 342 statewide, top 71%, 807 students, 77% FRL); Pulaski County Senior High (math 63% / reading 70%, grade B, #195 of 319 statewide, top 62%, 1,246 students, 76% FRL) — zoned schools average 78% FRL vs 47% district-wide (31 pts higher); higher-poverty schools than district average — tighter screening recommended.
- Market conditions: 114 active listings in the ZIP; 2 comparable units currently listed for rent nearby; 39 units permitted in Pulaski County in 2024 (0 in 5+ unit buildings).
Forward outlook
- Local home prices are declining (-3.0%/yr); year-one equity from $346 of loan paydown is wiped out by about $2k of value loss. Plan a longer hold.
- Pulaski County population projected at -19% by 2050 — secular population decline; favor cash flow + early exit over multi-decade hold.
- At projected returns (-3.0% appreciation + 3.0% rent growth), your $14k cash investment doubles in ~2 years — after that, you're playing with house money.
Negotiation context
- Only 4 days on market — expect competitive offers; lowballing is unlikely to land.
Risks & watch-outs
- Watch-outs: built in 1943 — expect roof / HVAC / electrical / plumbing capex.
Questions for the listing agent
- Built in 1943 — when were the roof, HVAC, electrical panel, plumbing, and water heater last replaced?
- Is there a deadline driving the sale (1031 exchange, divorce, estate, relocation)? That informs how much negotiation room exists.
- Schools are B-rated — typically a magnet for longer-tenancy family renters. What's the average tenant stay here, and is there a school-zone premium baked into asking?
- Crime grade is F in this area — have there been break-ins, vandalism, or insurance claims at this property in the last 3 years? What carrier currently insures it and at what premium?
- What's the average days-on-market for RENTAL listings here right now (not sales)? A rising rental-DOM trend means longer vacancies and softer asking-rent achievability than the comps imply.
- What's the recent tenant-quality profile in this submarket — average credit score on applications, eviction rate, late-payment / NSF rate, and stable-employment percentage? A property-management company in the area should have these aggregated.
- How much new for-sale + rental construction is in the pipeline within 1–3 miles? Heavy new supply typically softens prices + rents 12–24 months out; constrained supply supports both.
Investment metrics
- 1% rule
- 2.71% ✓
- Cap rate
- 24.38%
- Cash-on-cash
- 64.58%
- DSCR
- 3.87
- GRM
- 3.1
CMA / ARV
- ARV (on-the-fly)
- $141,110
- Comps found
- 12
Show comp detail 12 sales within ~0.75 mi
| Address | Dist | Beds/Ba | Sqft | Sold | Price | $/sf | Match |
|---|---|---|---|---|---|---|---|
| 138 Pierce Ave | 0.23mi | 3/2.0 | 1,000 (-3%) | 2mo | $199,000 | $199 | 78 |
| 502 Dora Hwy | 0.36mi | 2/1.0 (-1) | 1,040 (+1%) | 3mo | $68,000 | $65 | 74 |
| 538 Graham St | 0.35mi | 2/1.0 (-1) | 1,040 (+1%) | 4mo | $169,000 | $163 | 74 |
| 522 Bellevue Ave | 0.17mi | 4/1.0 (+1) | 952 (-8%) | 4mo | $130,000 | $137 | 71 |
| 128 Pierce Ave | 0.24mi | 3/1.0 | 1,110 (+8%) | 7mo | $45,000 | $41 | 70 |
| 311 S Washington Ave | 0.04mi | 3/2.0 | 1,158 (+12%) | 5mo | $140,000 | $121 | 69 |
| 202 Pierce Ave | 0.23mi | 2/1.0 (-1) | 956 (-7%) | 9mo | $55,000 | $58 | 65 |
| 127 State Aly | 0.58mi | 3/2.0 | 1,000 (-3%) | 1mo | $199,000 | $199 | 63 |
| 127 State | 0.58mi | 3/2.0 | 1,000 (-3%) | 1mo | $190,000 | $190 | 63 |
| 40 2nd St SE | 0.11mi | 2/1.0 (-1) | 892 (-13%) | 9mo | $38,000 | $43 | 60 |
| 143 Lake St | 0.45mi | 3/1.0 | 1,119 (+9%) | 7mo | $151,000 | $135 | 59 |
| 107 Holly St | 0.50mi | 2/1.0 (-1) | 904 (-12%) | 7mo | $125,000 | $138 | 46 |
Match score weights: distance 35% · size 25% · config 20% · recency 20%. Top-matched comps best support the ARV.
Projected returns pro-forma
-3.0% appreciation · 3.0% rent growth · sell at horizon
- IRR
- 63.7%
- Equity multiple
- 3.85×
- Total profit
- $39,888
- Equity at exit
- $7,455
- IRR
- 68.1%
- Equity multiple
- 7.90×
- Total profit
- $96,537
- Equity at exit
- $4,323
Cash invested: $14,000 (down + closing). Projections, not guarantees.
Landlord ↔ Tenant lean methodology
- Overall (STATE)
- 55 Moderately Landlord-Leaning
- State Virginia
- 55 Moderately Landlord-Leaning · D+2
- County
- — inherits STATE
- City
- — inherits STATE
ZIP-level market 24301
- Active inventory
- 114
- Price-to-rent
- 3.1×
Monthly cashflow live
- Estimated rent
- $1,356 medium interval (Pro) →
- Mortgage (P&I)
- −$262
- Tax from tax record
- −$34 /mo · $413/yr
- Insurance
- −$21
- HOA
- −$0
- Vacancy / Maint / Mgmt
- −$285
- Net cashflow
- $753
Break-even live
UW: 25.0% down · 7.5% · 30yr · 1.5% tax · 5.0% vac · 8.0% maint · 8.0% mgmt
Financing live
Cash to close
- Down payment
- $12,500
- Closing costs
- $1,500
- Reserves months
- —
- Total cash needed
- —
Loan-product check · same deal, 3 products live
Conventional
25% down · 7.5% · 30yr
- Down + closing
- —
- Monthly P&I
- —
- Monthly cashflow
- —
- DSCR
- —
- Eligible?
- —
Personal DTI + credit; lowest rate.
DSCR
20% down · 8.5% · 30yr
- Down + closing
- —
- Monthly P&I
- —
- Monthly cashflow
- —
- DSCR
- —
- Eligible?
- —
No personal income docs; deal must DSCR.
Hard money
10% down · 12.0% · 12mo
- Down + closing
- —
- Monthly P&I
- —
- Monthly cashflow
- —
- DSCR
- —
- Eligible?
- —
Short-term bridge; refi at stabilization.
Rent comps 2 comps
| Address | Beds | Baths | Sqft | Rent | $/sqft | DOM | Units | Dist |
|---|---|---|---|---|---|---|---|---|
| 500 Pico Ter Pulaski, VA | 3.0 | 1.0–2.0 | 882 | $1,580 | $1.79 | 44d | 11 | 0.77mi |
| 1009 High St Unit A Pulaski, VA | 2.0 | 1.0 | 800 | $875 | $1.09 | 44d | 1 | 1.49mi |
Listing history 4 events
-
2026-05-31status $50,000 Pending 4 DOM
-
2026-05-31days on market $50,000 Active 4 DOM
-
2026-05-30days on market $50,000 Active 3 DOM
-
2026-05-28$50,000 Active
ⓘ Source: listings_history table (triggers on properties + properties_extension) + one-shot
backfill from property_details.listing_events for pre-trigger history.
Tax reassessment forecast VA · Resets to sale price
- Current annual tax
- $413 · $34/mo
- Projected year-2 tax
- $413 · $34/mo
- Expected delta
- $0/yr ($0/mo · 0.0%)
ⓘ Screening estimate from a state-policy table — verify with the county assessor before closing.
Climate risk First Street
- Flood 1/10 Low FEMA zone X (unshaded) · 0% chance over 30 yrs
- Wildfire 3/10 Moderate
- Heat 4/10 Moderate 8 d/yr ≥93°F today · 23 d/yr by 30 yrs out
- Wind 2/10 Low
- Air quality 1/10 Low 0 unhealthy d/yr today · 0 by 30 yrs out
Nearby sold comps map
Loading sold comps map…
Walkable amenities ~0.75 mi
Loading nearby amenities…
Taxation est. · year 1
- Rental income
- $16,267
- − Mortgage interest
- −$2,801
- − Property taxes
- −$413
- − Insurance
- −$250
- − Repairs & maintenance
- −$1,301
- − Management
- −$1,301
- − Depreciation
- −$1,455
- Taxable income
- $8,746
- Est. tax owed @ 24.0%
- −$2,099
- After-tax cash flow
- $6,942/yr
For passive investors: Depreciation is non-cash, so a rental often shows a tax loss while cash-flowing — sheltering income. Rental losses are passive: they offset passive income freely, and up to $25,000/yr can offset ordinary (W-2) income if you actively participate and your MAGI is under $100k (phasing out to $0 by $150k); unused losses carry forward. On sale, claimed depreciation is recaptured at up to 25%, and gains may owe capital-gains tax (a 1031 exchange can defer both). Figures are a year-1 estimate at your 24.0% rate — not tax advice; consult a CPA.
Schools (NCES district)
- District
- Pulaski County Public School District
- NCES district ID
- 5103150
- Math proficiency
- 48% ▼ -31.00%
- Reading proficiency
- 61% ▼ -13.00%
- Median HH income
- $44,912
- Composite
- 45.98/100
- National rank
- #2537
- State rank
- #86 of 131 in VA
Livability — Pulaski
- Score
- 67/100
- State rank
- #297
- US rank
- #10639
Category grades
Schools grade is shown separately in the Schools card above.
Census & demographics
- Census place
- Pulaski, VA
- Population (ZIP)
- 13,370
Population outlook (Pulaski County) Hauer SSP2
- Today (2025)
- 32,949 people
- By 2030
- 31,812 · -3.5%
- By 2040
- 29,224 · -11.3%
- By 2050
- 26,691 · -19.0%
- By 2075
- 21,312 · -35.3%
- By 2100
- 15,697 · -52.4%
Race, ethnicity, and origin ACS 2023
- Neighborhood character
- Predominantly White (89%)
- Race & ethnicity
- White 89% Two or more races 5% Black 4% Hispanic / Latino 3%
- Common ancestry
- Serbian 2% Italian 2% Iranian 1%
- Foreign-born
- 2% · Vietnam, Canada
- Languages at home
- 97% English-only · Spanish 1%
Political lean MEDSL · Pulaski
- 2024 margin
- Solid R (+44.7) · D 27.3% · R 72.0%
- 2008→2024 swing
- -25.1pp toward R · 2008: -19.5pp · 2024: -44.7pp
- All cycles
- 2024: R+44.7 2020: R+41.5 2016: R+40.7 2012: R+24.8 2008: R+19.5
Not yet ingested
- Civics
- —
Market trends
- HPI YoY
- ▼ -88.98%
- Current HPI
- 144.6556
- Rent YoY
- —
- Metro
- —
- State GDP YoY
- ▲ 2.40%
- F500 in state
- 50
Industry mix (Fortune 500 HQ in VA)
| Industry | F500 HQs | Revenue |
|---|---|---|
| Aerospace / Defense | 4 | $236B |
|
||
| Technology / Defense | 3 | $32B |
|
||
| Financial Services | 2 | $176B |
|
||
| Utilities | 2 | $27B |
|
||
| Insurance | 2 | $25B |
|
||
| Technology | 2 | $15B |
|
||
Price history
1 event — show timeline
- 2026-05-28 Listed $50,000 NRVMLS
Property tax history
+2.4%/yrLatest (2026): $413 · +0.0% YoY. Source: county tax records.
Cash-flow waterfall
monthlySold comps — $/sqft
last 12 mo · ≤1 miLoading sold comps…