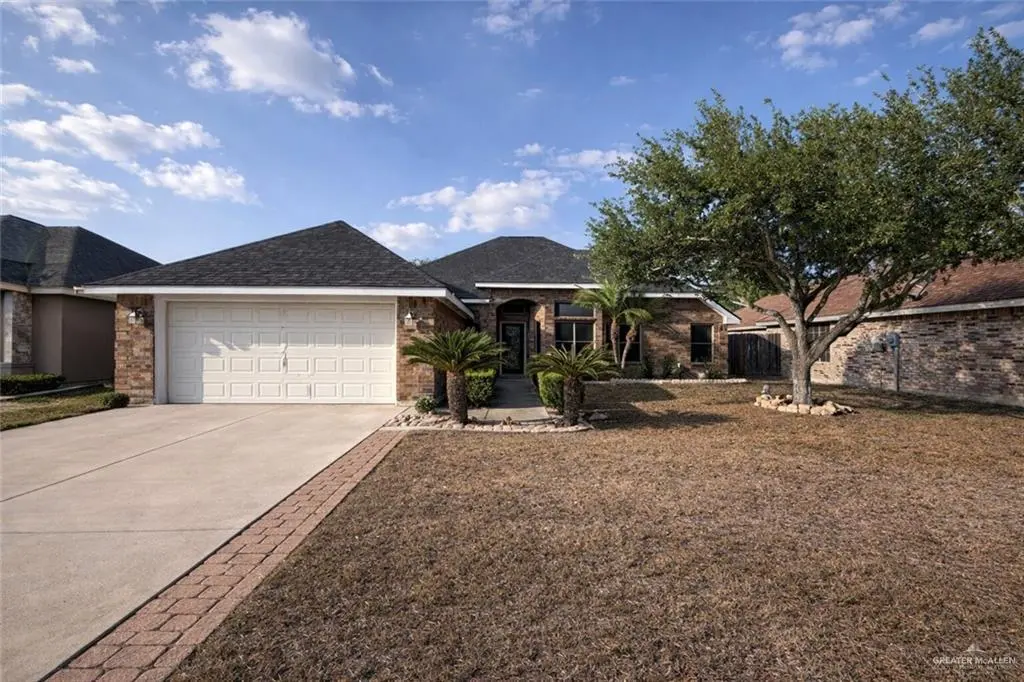
2716 Duke Ave · McAllen, TX
Flood risk 1/10 · Minimal
- FEMA flood zone
- X
- Chance of flooding over 30 yrs
- 0.0%
- Est. flood insurance / yr
- $507 – $1,088
Fire risk 4/10 · Minor
- Est. fire insurance / yr
- $1,222 – $2,270
Heat risk 9/10 · Severe
- Hot days now (above 111°F)
- 7 days/yr
- Hot days in 30 yrs
- 22 days/yr
Wind risk 8/10 · Major
- Chance of severe wind over 30 yrs
- 99.0%
Air-quality risk 2/10 · Minimal
- Unhealthy air days now
- 0 days/yr
- Unhealthy air days in 30 yrs
- 1 days/yr
Risk factors via First Street. Map © Google.
Why this score? — see what drove the D grade
The composite is a weighted blend of 9 inputs, each scored 0–100. Each bar is that input's sub-score; the figure is the points it added to the 100-point composite (weight × sub-score).
- Cash flow +11.2/30.0
- ARV discount +10.1/15.0
- 1% rule +4.2/10.0
- Livability +3.8/5.0
- DSCR +3.3/10.0
- Schools +3.3/10.0
- Rent growth +3.1/5.0
- Condition / age +2.5/5.0
- Appreciation +0.0/10.0
$249,999
🖨 Deal sheet (PDF) 📄 Offer letter ✓ Due diligence
Listing remarks MLS
Move-in ready and ideally located, this inviting home offers a flexible layout designed for both comfort and everyday living. A versatile fourth room can easily serve as a home office or guest space. The interior features a spacious design with a separate dining area, breakfast nook, and a split-bedroom arrangement for added privacy. All bedrooms include walk-in closets, providing ample storage throughout. The primary suite offers dual closets, a relaxing jacuzzi tub, and a separate walk-in shower. Step outside to a generously sized backyard perfect for gatherings, complete with a covered patio ideal for entertaining or enjoying warm South Texas evenings. The property also features a separate dog run, making it perfect for pet owners. A storage shed adds extra space for tools and outdoor equipment. Conveniently located near schools, parks, and shopping, this home offers both functionality and convenience. Schedule your showing today!
Key facts
- 7,819 sq ft lot
- 2 garage spots
- Built 2005
Neighborhood map
What this means for you Summary
Snapshot
- This is a 4-bed/2.0-bath single-family listed at $250k.
Deal economics
- At list price, monthly cash flow is $-97 ($-1k/yr) — negative.
- To cash-flow at today's rent, offer at most $233k (6.8% below list).
- To meet the 1% rule (rent ≥ 1% of price), the offer needs to be $230k (8.2% below list).
- Recommended offer: $230k (8.2% below list) — sets the bar for 1% rule.
- Cap rate 5.8% vs local median 3.7% in McAllen — top-decile yield for the area; either an underpriced asset or a hidden risk that comps aren't pricing in. Stress-test before assuming the spread holds.
Location & tenants
- Location reads 76/100 on livability (#119 in TX, #3,771 nationally) — a middle-class / working-renter tenant base. Strengths: cost of living A+, housing A+, health & safety A+; Watch: employment D, amenities F, commute F.
- Mcallen ISD (urban): math 34% / reading 45% proficiency, ranked #440 of 826 in TX (top 53%) — families likely to look elsewhere, expect single-tenant / working-renter base with shorter leases.
- Zoned schools: Blanca E Sanchez (math 42% / reading 42%, grade F, #1,335 of 4,322 statewide, top 33%, 515 students, 61% FRL); Michael E Fossum Middle (math 40% / reading 45%, grade D-, #553 of 1,662 statewide, top 34%, 780 students, 59% FRL); Mcallen H S (math 30% / reading 57%, grade F, #704 of 1,632 statewide, top 43%, 2,133 students, 63% FRL).
- Market conditions: Rents rising (+2.6%/yr); 898 active listings in the ZIP; 35 comparable units currently listed for rent nearby; rentals lingering (median 46d on market — plan ~5-8 weeks vacancy on turnover, expect pricing pressure); 51% of comp listings sitting > 30 days — soft ceiling on asking rent; solid renter incomes; 7,378 units permitted in Hidalgo County in 2024 (641 in 5+ unit buildings).
- This rent runs 34% of the median local income ($82k/yr) — at the standard rent-burdened threshold; future hikes will face affordability resistance.
Forward outlook
- Local home prices are declining (-3.0%/yr); year-one equity from $2k of loan paydown is wiped out by about $8k of value loss. Plan a longer hold.
- Hidalgo County population projected at +28% by 2050 — long-run rental-demand tailwind backs the buy-and-hold thesis.
Negotiation context
- It's been on market 87 days — a 6% lower offer ($235k) is reasonable based on typical stale-listing flexibility.
- 8 sale attempts since 2y ago with the ask held roughly flat each time — persistent listings suggest the price (not the market) is what's stuck; bring a comps-based counter.
Risks & watch-outs
- Climate carrying-cost: severe wind risk, 99% chance of damaging wind over 30y; extreme-heat days projected 7→22/yr by 2055 (HVAC capex compounding) — expect insurance premiums to compound above CPI over the hold.
Questions for the listing agent
- What do current leases actually rent for vs. the listed asking? Can we see a recent rent roll and the last 12 months of T-12 income?
- It's been on market 87 days. Have you received any prior offers? Is the seller open to a 8% concession, seller financing, or rate buy-down credit?
- Why hasn't it sold? Are there any deal-killer items the seller is aware of (foundation, flood, title, zoning, code violations)?
- Is there a deadline driving the sale (1031 exchange, divorce, estate, relocation)? That informs how much negotiation room exists.
- Schools are B-rated — typically a magnet for longer-tenancy family renters. What's the average tenant stay here, and is there a school-zone premium baked into asking?
- The area grade is low — what's the realistic commute time and amenity access for the typical tenant pool here? Any planned neighborhood developments (good or bad) we should know about?
- What's the average days-on-market for RENTAL listings here right now (not sales)? A rising rental-DOM trend means longer vacancies and softer asking-rent achievability than the comps imply.
- What's the recent tenant-quality profile in this submarket — average credit score on applications, eviction rate, late-payment / NSF rate, and stable-employment percentage? A property-management company in the area should have these aggregated.
- How much new for-sale + rental construction is in the pipeline within 1–3 miles? Heavy new supply typically softens prices + rents 12–24 months out; constrained supply supports both.
Investment metrics
- 1% rule
- 0.92% ✗
- Cap rate
- 5.83%
- Cash-on-cash
- -1.66%
- DSCR
- 0.93
- GRM
- 9.1
CMA / ARV
- ARV (median comp)
- $265,340
- List price
- $249,999
- Delta
- -5.78%
- Verdict
- FAIR
- Comps
- 20 within 1.0 mi
Show comp detail 12 sales within ~0.75 mi
| Address | Dist | Beds/Ba | Sqft | Sold | Price | $/sf | Match |
|---|---|---|---|---|---|---|---|
| 8107 N 27th Ln | 0.04mi | 4/2.5 | 2,209 (+9%) | 4mo | $269,000 | $122 | 77 |
| 2809 Verdin Ave | 0.55mi | 4/2.0 | 1,961 (-3%) | 3mo | $300,000 | $153 | 67 |
| 9101 N 28th St | 0.52mi | 3/2.0 (-1) | 1,954 (-3%) | 1mo | $255,000 | $131 | 64 |
| 3705 Zenker Ave | 0.73mi | 3/2.5 (-1) | 2,093 (+4%) | 0mo | $345,000 | $165 | 52 |
| 3413 Emory Ave | 0.50mi | 4/3.0 | 1,784 (-12%) | 4mo | $245,000 | $137 | 50 |
| 9106 N 25th Ln | 0.54mi | 3/2.5 (-1) | 1,785 (-12%) | 1mo | $319,000 | $179 | 48 |
| 3205 Northgate Ln | 0.59mi | 4/2.0 | 1,716 (-15%) | 1mo | $325,000 | $189 | 47 |
| 3317 Kingsborough Ave | 0.60mi | 3/2.0 (-1) | 1,778 (-12%) | 1mo | $262,500 | $148 | 46 |
| 9119 N 25th St | 0.58mi | 3/2.5 (-1) | 1,768 (-12%) | 0mo | $315,000 | $178 | 45 |
| 3501 Harvard Ave | 0.57mi | 4/3.0 | 1,716 (-15%) | 1mo | $285,000 | $166 | 44 |
| 7820 N 38th St | 0.73mi | 4/3.0 | 2,238 (+11%) | 3mo | $435,000 | $194 | 41 |
| 3100 Toucan Ave | 0.72mi | 3/2.0 (-1) | 2,237 (+11%) | 3mo | $272,900 | $122 | 41 |
Match score weights: distance 35% · size 25% · config 20% · recency 20%. Top-matched comps best support the ARV.
Projected returns pro-forma
-3.0% appreciation · 2.57% rent growth · sell at horizon
- IRR
- -19.5%
- Equity multiple
- 0.32×
- Total profit
- $-47,506
- Equity at exit
- $37,276
- IRR
- -13.1%
- Equity multiple
- 0.25×
- Total profit
- $-52,718
- Equity at exit
- $21,615
Cash invested: $70,000 (down + closing). Projections, not guarantees.
Landlord ↔ Tenant lean methodology
- Overall (STATE)
- 87 Strongly Landlord-Friendly
- State Texas
- 87 Strongly Landlord-Friendly · R+5
- County
- — inherits STATE
- City
- — inherits STATE
ZIP-level market 78504
- Home prices YoY
- -29.4%
- Rents YoY
- 2.6%
- Active inventory
- 898
- Price-to-rent
- 9.1×
Monthly cashflow live
- Estimated rent
- $2,296 high interval (Pro) →
- Mortgage (P&I)
- −$1,311
- Tax from tax record
- −$495 /mo · $5,945/yr
- Insurance
- −$104
- HOA
- −$0
- Vacancy / Maint / Mgmt
- −$482
- Net cashflow
- $-97
Break-even live
Sensitivity live
| Price | -10% $45 | -5% $-26 | +0% $-97 | +5% $-167 | +10% $-238 |
|---|---|---|---|---|---|
| Rent | -10% $-278 | -5% $-187 | +0% $-97 | +5% $-6 | +10% $85 |
| Rate | -1.0pp $29 | -0.5pp $-33 | base $-97 | +0.5pp $-161 | +1.0pp $-227 |
UW: 25.0% down · 7.5% · 30yr · 1.5% tax · 5.0% vac · 8.0% maint · 8.0% mgmt
Financing live
Cash to close
- Down payment
- $62,500
- Closing costs
- $7,500
- Reserves months
- —
- Total cash needed
- —
Loan-product check · same deal, 3 products live
Conventional
25% down · 7.5% · 30yr
- Down + closing
- —
- Monthly P&I
- —
- Monthly cashflow
- —
- DSCR
- —
- Eligible?
- —
Personal DTI + credit; lowest rate.
DSCR
20% down · 8.5% · 30yr
- Down + closing
- —
- Monthly P&I
- —
- Monthly cashflow
- —
- DSCR
- —
- Eligible?
- —
No personal income docs; deal must DSCR.
Hard money
10% down · 12.0% · 12mo
- Down + closing
- —
- Monthly P&I
- —
- Monthly cashflow
- —
- DSCR
- —
- Eligible?
- —
Short-term bridge; refi at stabilization.
Rent comps 35 comps
| Address | Beds | Baths | Sqft | Rent | $/sqft | DOM | Units | Dist |
|---|---|---|---|---|---|---|---|---|
| 2613 Fairmont Ave McAllen, TX | 3.0 | 2.0 | 1735 | $2,000 | $1.15 | 45d | 1 | 0.05mi |
| 2809 Grambling Ave McAllen, TX | 3.0 | 2.5 | 2152 | $2,500 | $1.16 | 45d | 1 | 0.12mi |
| 8101 N 23rd St Unit 29 McAllen, TX | 3.0 | 2.5 | 1600 | $1,900 | $1.19 | 45d | 1 | 0.29mi |
| 8101 N 23rd St Unit 27 McAllen, TX | 3.0 | 2.5 | 1600 | $1,900 | $1.19 | 25d | 1 | 0.29mi |
| 8406 N 33rd Ln McAllen, TX | 3.0 | 2.0 | 1448 | $2,000 | $1.38 | 16d | 1 | 0.41mi |
| 2629 Warbler Ave McAllen, TX | 3.0 | 2.5 | 1420 | $2,100 | $1.48 | 45d | 1 | 0.49mi |
| 9104 N 28th St McAllen, TX | 3.0 | 2.0 | 1747 | $1,900 | $1.09 | 16d | 1 | 0.53mi |
| 2717 Umbrellabird Ave McAllen, TX | 3.0 | 2.0 | 1521 | $1,695 | $1.11 | 45d | 1 | 0.60mi |
| 7601 N 21st St McAllen, TX | 3.0 | 2.5 | 1888 | $2,600 | $1.38 | 45d | 1 | 0.65mi |
| 4923 N 35th Ln McAllen, TX | 2.0–4.0 | 2.0–2.5 | 1373 | $2,435 | $1.77 | 16d | 11 | 0.68mi |
| 7504 N 21st St McAllen, TX | 3.0 | 2.0 | 1746 | $1,800 | $1.03 | 16d | 1 | 0.70mi |
| 1901 Duke Ave McAllen, TX | 4.0 | 3.0 | 2702 | $2,400 | $0.89 | 45d | 1 | 0.73mi |
| 3213 Princeton Ave McAllen, TX | 3.0 | 2.5 | 1868 | $1,850 | $0.99 | 16d | 1 | 0.78mi |
| 2908 Providence Ave McAllen, TX | 3.0 | 2.5 | 1646 | $1,750 | $1.06 | 45d | 1 | 0.78mi |
| 2920 Providence Ave McAllen, TX | 3.0 | 2.5 | 1848 | $1,600 | $0.87 | 25d | 1 | 0.79mi |
| 3601 Warbler Ave McAllen, TX | 3.0 | 2.0 | 1568 | $1,500 | $0.96 | 25d | 1 | 0.80mi |
| 3908 Zenker Ave McAllen, TX | 4.0 | 2.5 | 1946 | $3,500 | $1.80 | 45d | 1 | 0.87mi |
| 4012 Auburn Ave McAllen, TX | 3.0 | 2.0 | 1843 | $2,000 | $1.09 | 45d | 1 | 0.89mi |
| 4012 Auburn Ave McAllen, TX | 3.0 | 2.0 | 1843 | $1,900 | $1.03 | 16d | 1 | 0.89mi |
| 1800 Kingsborough Ave McAllen, TX | 3.0 | 2.0 | 2027 | $2,200 | $1.09 | 25d | 1 | 0.90mi |
| 3509 Robin Ave McAllen, TX | 3.0 | 2.0 | 1827 | $1,795 | $0.98 | 16d | 1 | 1.00mi |
| 3212 Oriole Ave McAllen, TX | 3.0 | 2.0 | 1543 | $1,850 | $1.20 | 21d | 1 | 1.03mi |
| 9807 N 24th Ln McAllen, TX | 4.0 | 3.5 | 2300 | $3,700 | $1.61 | 16d | 1 | 1.06mi |
| 9806 N 24th Ln McAllen, TX | 4.0 | 3.5 | 2300 | $3,700 | $1.61 | 45d | 1 | 1.07mi |
| 2625 Mynah Ave McAllen, TX | 3.0 | 2.0 | 1506 | $2,150 | $1.43 | 45d | 1 | 1.08mi |
| 9805 N 24th St McAllen, TX | 4.0 | 3.5 | 2300 | $3,700 | $1.61 | 45d | 1 | 1.09mi |
| 9809 N 24th St McAllen, TX | 4.0 | 3.5 | 2300 | $4,500 | $1.96 | 45d | 1 | 1.10mi |
| 9813 N 24th St McAllen, TX | 4.0 | 3.5 | 2300 | $3,700 | $1.61 | 45d | 1 | 1.11mi |
| 3409 Martin Ave McAllen, TX | 4.0 | 2.0 | 1958 | $1,895 | $0.97 | 16d | 1 | 1.28mi |
| 10315 N 26th Ln McAllen, TX | 3.0 | 2.5 | 2124 | $2,300 | $1.08 | 16d | 1 | 1.34mi |
| 1304 Providence Ave McAllen, TX | 3.0 | 2.5 | 2029 | $3,750 | $1.85 | 45d | 1 | 1.38mi |
| 1205 Ozark Ave McAllen, TX | 3.0 | 3.0 | 1955 | $2,800 | $1.43 | 25d | 1 | 1.38mi |
| 4416 Thunderbird Ave McAllen, TX | 4.0 | 2.5 | 2076 | $2,200 | $1.06 | 16d | 1 | 1.39mi |
| 1216 Quail Ave McAllen, TX | 3.0 | 2.0 | 1842 | $1,700 | $0.92 | 45d | 1 | 1.46mi |
| 10338 N 23rd Ln McAllen, TX | 4.0 | 3.5 | 2563 | $2,700 | $1.05 | 46d | 1 | 1.50mi |
Listing history 37 events
-
2026-06-21days on market $249,999 Active 87 DOM
-
2026-06-18days on market $249,999 Active 84 DOM
-
2026-06-17days on market $249,999 Active 83 DOM
-
2026-06-16days on market $249,999 Active 82 DOM
-
2026-06-15days on market $249,999 Active 81 DOM
-
2026-06-14days on market $249,999 Active 79 DOM
-
2026-06-10days on market $249,999 Active 76 DOM
-
2026-06-09days on market $249,999 Active 75 DOM
-
2026-06-08days on market $249,999 Active 74 DOM
-
2026-06-07days on market $249,999 Active 73 DOM
-
2026-06-05days on market $249,999 Active 70 DOM
-
2026-06-03days on market $249,999 Active 69 DOM
-
2026-06-02days on market $249,999 Active 68 DOM
-
2026-06-01days on market $249,999 Active 67 DOM
-
2026-05-31days on market $249,999 Active 66 DOM
-
2026-05-31days on market $249,999 Active 65 DOM
-
2026-03-26$249,999 Active 947-char remark
Show marketing remark (947 chars)
Move-in ready and ideally located, this inviting home offers a flexible layout designed for both comfort and everyday living. A versatile fourth room can easily serve as a home office or guest space. The interior features a spacious design with a separate dining area, breakfast nook, and a split-bedroom arrangement for added privacy. All bedrooms include walk-in closets, providing ample storage throughout. The primary suite offers dual closets, a relaxing jacuzzi tub, and a separate walk-in shower. Step outside to a generously sized backyard perfect for gatherings, complete with a covered patio ideal for entertaining or enjoying warm South Texas evenings. The property also features a separate dog run, making it perfect for pet owners. A storage shed adds extra space for tools and outdoor equipment. Conveniently located near schools, parks, and shopping, this home offers both functionality and convenience. Schedule your showing today!
-
2026-02-16price $249,000
-
2026-01-19status Active
-
2026-01-19status Pending
-
2026-01-12historical Option
-
2025-12-15price $259,000
-
2025-09-26price $269,000
-
2025-07-31$275,000 Active
-
2025-04-03$260,000 Active
-
2025-02-25price $269,000
-
2024-12-23$275,000 Active
-
2024-11-07price $260,000
-
2024-10-14$275,000 Active
-
2024-06-18status Active
-
2024-06-18status Pending
-
2024-06-12historical Option
-
2024-05-27price $275,000
-
2024-04-13price $300,000
-
2024-03-04$310,000 Active
-
2005-08-15soldstatus
-
2003-12-19soldstatus
ⓘ Source: listings_history table (triggers on properties + properties_extension) + one-shot
backfill from property_details.listing_events for pre-trigger history.
Tax reassessment forecast TX · Resets to sale price
- Current annual tax
- $5,945 · $495/mo
- Projected year-2 tax
- $5,945 · $495/mo
- Expected delta
- $0/yr ($0/mo · 0.0%)
ⓘ Screening estimate from a state-policy table — verify with the county assessor before closing.
Climate risk First Street
- Flood 1/10 Low FEMA zone X · 0% chance over 30 yrs
- Wildfire 4/10 Moderate
- Heat 9/10 Extreme 7 d/yr ≥111°F today · 22 d/yr by 30 yrs out
- Wind 8/10 Severe 99% chance of damaging wind over 30 yrs
- Air quality 2/10 Low 0 unhealthy d/yr today · 1 by 30 yrs out
Nearby sold comps map
Loading sold comps map…
Walkable amenities ~0.75 mi
Loading nearby amenities…
Taxation est. · year 1
- Rental income
- $27,554
- − Mortgage interest
- −$14,004
- − Property taxes
- −$5,945
- − Insurance
- −$1,250
- − Repairs & maintenance
- −$2,204
- − Management
- −$2,204
- − Depreciation
- −$7,273
- Taxable loss
- −$5,326
- Est. tax savings @ 24.0%
- +$1,278
- After-tax cash flow
- $119/yr
For passive investors: Depreciation is non-cash, so a rental often shows a tax loss while cash-flowing — sheltering income. Rental losses are passive: they offset passive income freely, and up to $25,000/yr can offset ordinary (W-2) income if you actively participate and your MAGI is under $100k (phasing out to $0 by $150k); unused losses carry forward. On sale, claimed depreciation is recaptured at up to 25%, and gains may owe capital-gains tax (a 1031 exchange can defer both). Figures are a year-1 estimate at your 24.0% rate — not tax advice; consult a CPA.
Schools (NCES district)
- District
- Mcallen ISD
- NCES district ID
- 4829670
- Math proficiency
- 34% ▼ -22.00%
- Reading proficiency
- 45% ▼ -5.00%
- Median HH income
- $40,805
- Composite
- 33.16/100
- National rank
- #5551
- State rank
- #440 of 826 in TX
Livability — McAllen
- Score
- 76/100
- State rank
- #119
- US rank
- #3771
Category grades
Schools grade is shown separately in the Schools card above.
Census & demographics
- Census place
- McAllen, TX
- County
- Hidalgo County · 623,128 people
- City population
- 144,650
- Metro
- McAllen-Edinburg-Mission, TX
- Population (ZIP)
- 63,094
- Household income
- $81,905
- Rent vs Own
- Severe rent burden
- 1468.0
Population outlook (Hidalgo County) Hauer SSP2
- Today (2025)
- 955,232 people
- By 2030
- 1,009,774 · +5.7%
- By 2040
- 1,120,332 · +17.3%
- By 2050
- 1,225,036 · +28.2%
- By 2075
- 1,439,189 · +50.7%
- By 2100
- 1,533,429 · +60.5%
Race, ethnicity, and origin ACS 2023
- Neighborhood character
- Predominantly Hispanic (82%)
- Race & ethnicity
- Hispanic / Latino 82% Two or more races 39% White 11% Asian 5%
- Hispanic origin (detail)
- Mexican 75%
- Common ancestry
- Lithuanian 1% Italian 1%
- Foreign-born
- 24% · Canada, South Korea, Vietnam
- Languages at home
- 34% English-only · Spanish 62% Other Asian/Pacific 1% Tagalog/Filipino 1%
Political lean MEDSL · Hidalgo
- 2024 margin
- Toss-up / Even · D 48.1% · R 51.0%
- 2008→2024 swing
- -41.6pp toward R · 2008: 38.7pp · 2024: -2.9pp
- All cycles
- 2024: R+2.9 2020: D+17.1 2016: D+40.5 2012: D+41.8 2008: D+38.7
Not yet ingested
- Civics
- —
Market trends
- HPI YoY
- ▼ -80.87%
- Current HPI
- 194.1764
- Rent YoY
- ▲ 2.57%
- Metro
- McAllen-Edinburg-Mission, TX
- State GDP YoY
- ▲ 3.95%
- F500 in state
- 110
Industry mix (Fortune 500 HQ in TX)
| Industry | F500 HQs | Revenue |
|---|---|---|
| Energy | 16 | $1,198B |
|
||
| Technology | 5 | $198B |
|
||
| Engineering / Construction | 4 | $72B |
|
||
| Energy Services | 3 | $60B |
|
||
| Utilities | 3 | $41B |
|
||
| Healthcare | 2 | $330B |
|
||
Price history
-19.4% since first listed21 events — show timeline
- 2026-03-26 Listed $249,999 MCALLENMLS
- 2026-02-16 Price Changed $249,000 MCALLENMLS
- 2026-01-19 Relisted — MCALLENMLS
- 2026-01-19 Pending — MCALLENMLS
- 2026-01-12 Contingent — MCALLENMLS
- 2025-12-15 Price Changed $259,000 MCALLENMLS
- 2025-09-26 Price Changed $269,000 MCALLENMLS
- 2025-07-31 Listed $275,000 MCALLENMLS
- 2025-04-03 Listed $260,000 MCALLENMLS
- 2025-02-25 Price Changed $269,000 MCALLENMLS
- 2024-12-23 Listed $275,000 MCALLENMLS
- 2024-11-07 Price Changed $260,000 MCALLENMLS
- 2024-10-14 Listed $275,000 SPIBOR
- 2024-06-18 Relisted — MCALLENMLS
- 2024-06-18 Pending — MCALLENMLS
- 2024-06-12 Contingent — MCALLENMLS
- 2024-05-27 Price Changed $275,000 MCALLENMLS
- 2024-04-13 Price Changed $300,000 MCALLENMLS
- 2024-03-04 Listed $310,000 MCALLENMLS
- 2005-08-15 Sold (Public Records) — Public Records
- 2003-12-19 Sold (Public Records) — Public Records
Property tax history
+5.0%/yrLatest (2025): $5,945 · +1.3% YoY. Source: county tax records.
Cash-flow waterfall
monthlySold comps — $/sqft
last 12 mo · ≤1 miLoading sold comps…