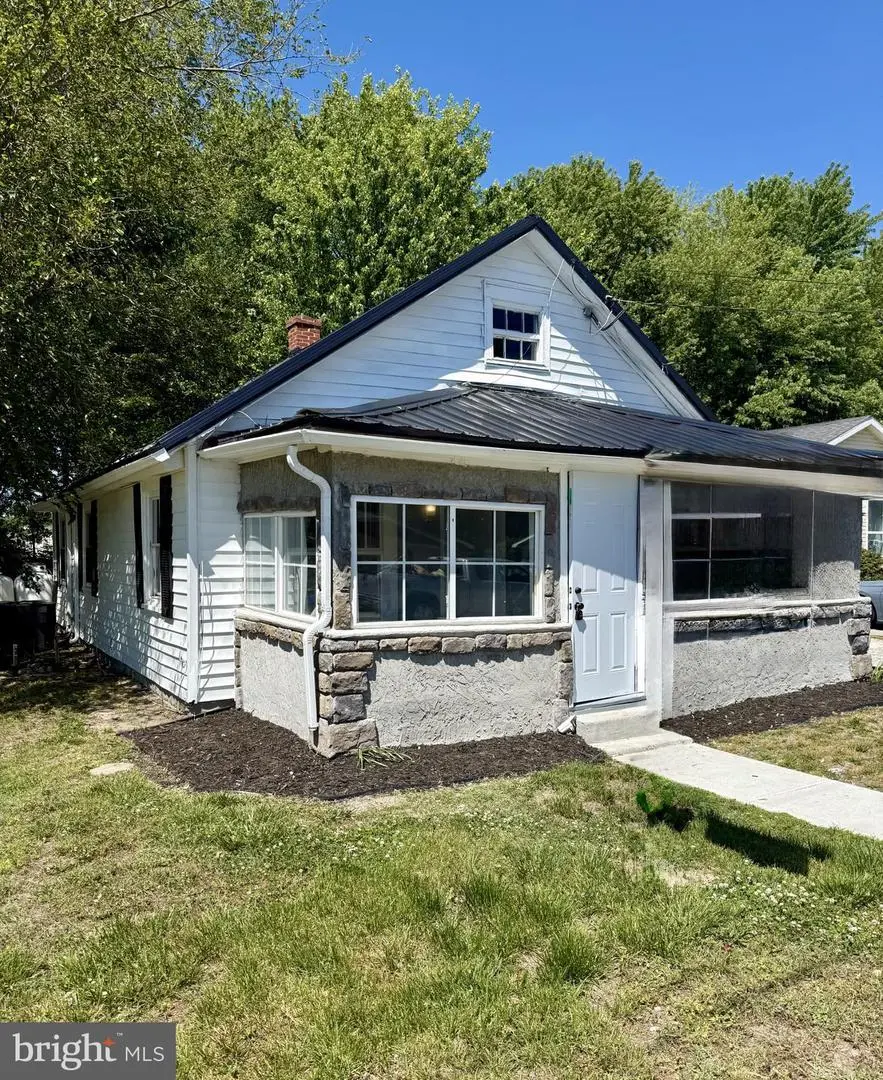
118 W Milby St · Harrington, DE
Flood risk 1/10 · Minimal
- FEMA flood zone
- X (unshaded)
- Chance of flooding over 30 yrs
- 0.0%
- Est. flood insurance / yr
- $507 – $1,088
Fire risk 1/10 · Minimal
- Est. fire insurance / yr
- $476 – $884
Heat risk 8/10 · Major
- Hot days now (above 102°F)
- 7 days/yr
- Hot days in 30 yrs
- 16 days/yr
Wind risk 6/10 · Moderate
- Chance of severe wind over 30 yrs
- 64.0%
Air-quality risk 2/10 · Minimal
- Unhealthy air days now
- 1 days/yr
- Unhealthy air days in 30 yrs
- 1 days/yr
Risk factors via First Street. Map © Google.
Why this score? — see what drove the F grade
The composite is a weighted blend of 9 inputs, each scored 0–100. Each bar is that input's sub-score; the figure is the points it added to the 100-point composite (weight × sub-score).
- Cash flow +9.7/30.0
- Appreciation +4.0/10.0
- Livability +3.7/5.0
- Schools +3.0/10.0
- DSCR +2.7/10.0
- Rent growth +2.5/5.0
- Condition / age +2.5/5.0
- 1% rule +1.7/10.0
- ARV discount +1.1/15.0
$220,000
🖨 Deal sheet 📄 Offer letter ✓ Due diligence
Listing remarks MLS
Mr-6657 Two Bedroom Cape, Would Be Great For First Time Starter Home.
Key facts
- 9,148 sq ft lot
- Built 1930
- Listed 23 days
Property features AI
Exterior
- Parking: Driveway; Off-street parking
- Utilities: Public water; Public sewer; Electric service
- Home design: Detached property; Built year reported by assessor
- Construction: Block foundation; Above-grade and below-grade structures noted
- Exterior features: Lot dimensions approximately 50 x 182.5; Ground rent paid annually; No tidal water
Interior
- Bedrooms: Two bedrooms on the main level
- Bathrooms: One full bathroom on the main level
- Heating & cooling: Central heating; Electric baseboard heating; Central air conditioning; Electric hot water
- Interior features: No basement; Finished above-grade living area reported by assessor
Neighborhood map
What this means for you Summary
Snapshot
- This is a 2-bed/1.0-bath single-family listed at $220k.
Deal economics
- At list price, monthly cash flow is $-146 ($-2k/yr) — negative.
- To cash-flow at today's rent, offer at most $194k (11.7% below list).
- To meet the 1% rule (rent ≥ 1% of price), the offer needs to be $148k (32.9% below list).
- Recommended offer: $148k (32.9% below list) — sets the bar for 1% rule.
- Cap rate 5.5% vs local median 3.9% in Harrington — top-decile yield for the area; either an underpriced asset or a hidden risk that comps aren't pricing in. Stress-test before assuming the spread holds.
Location & tenants
- Location reads 73/100 on livability (#9 in DE) — a middle-class / working-renter tenant base. Strengths: cost of living A+, housing A+, health & safety A+; Watch: crime D+, amenities F, commute F.
- Lake Forest School District (rural): math 26% / reading 44% proficiency, ranked #13 of 26 in DE (top 50%) — families likely to look elsewhere, expect single-tenant / working-renter base with shorter leases.
- Zoned schools: Lake Forest High School (math 27% / reading 47%, grade F, #16 of 40 statewide, top 38%, 870 students, 0% FRL) — zoned schools average 0% FRL vs 47% district-wide (47 pts lower); this property's tenant base skews higher-income than the district average.
- Market conditions: 72 active listings in the ZIP; 1,201 units permitted in Kent County in 2024 (116 in 5+ unit buildings).
Forward outlook
- Local home prices are declining (-2.1%/yr); year-one equity from $2k of loan paydown is wiped out by about $5k of value loss. Plan a longer hold.
- Kent County population projected at +22% by 2050 — long-run rental-demand tailwind backs the buy-and-hold thesis.
Negotiation context
- It's been on market 24 days — a 2% lower offer ($217k) is reasonable based on typical stale-listing flexibility.
- 2 sale attempts since 29y ago with the ask held roughly flat each time — persistent listings suggest the price (not the market) is what's stuck; bring a comps-based counter.
- Current owner paid $16k; list at $220k implies a 1275% gain — meaningful room to come down on a strong offer.
Risks & watch-outs
- Watch-outs: built in 1930 — expect roof / HVAC / electrical / plumbing capex.
- Climate carrying-cost: major wind risk, 64% chance of damaging wind over 30y; extreme-heat days projected 7→16/yr by 2055 (HVAC capex compounding) — expect insurance premiums to compound above CPI over the hold.
Questions for the listing agent
- What do current leases actually rent for vs. the listed asking? Can we see a recent rent roll and the last 12 months of T-12 income?
- Built in 1930 — when were the roof, HVAC, electrical panel, plumbing, and water heater last replaced?
- Is there a deadline driving the sale (1031 exchange, divorce, estate, relocation)? That informs how much negotiation room exists.
- Crime grade is D in this area — have there been break-ins, vandalism, or insurance claims at this property in the last 3 years? What carrier currently insures it and at what premium?
- The area grade is low — what's the realistic commute time and amenity access for the typical tenant pool here? Any planned neighborhood developments (good or bad) we should know about?
- What's the average days-on-market for RENTAL listings here right now (not sales)? A rising rental-DOM trend means longer vacancies and softer asking-rent achievability than the comps imply.
- What's the recent tenant-quality profile in this submarket — average credit score on applications, eviction rate, late-payment / NSF rate, and stable-employment percentage? A property-management company in the area should have these aggregated.
- How much new for-sale + rental construction is in the pipeline within 1–3 miles? Heavy new supply typically softens prices + rents 12–24 months out; constrained supply supports both.
Investment metrics
- 1% rule
- 0.67% ✗
- Cap rate
- 5.50%
- Cash-on-cash
- -2.85%
- DSCR
- 0.87
- GRM
- 12.4
CMA / ARV
- ARV (on-the-fly)
- $192,576
- Comps found
- 3
Show comp detail 3 sales within ~0.75 mi
| Address | Dist | Beds/Ba | Sqft | Sold | Price | $/sf | Match |
|---|---|---|---|---|---|---|---|
| 304 Calvin St | 0.59mi | 2/1.0 | 812 (-0%) | 15mo | $245,000 | $302 | 59 |
| 141 W Mispillion St | 0.15mi | 2/1.0 | 900 (+10%) | 22mo | $212,000 | $236 | 57 |
| 101 East St | 0.48mi | 2/1.5 | 881 (+8%) | 10mo | $140,000 | $159 | 54 |
Match score weights: distance 35% · size 25% · config 20% · recency 20%. Top-matched comps best support the ARV.
Projected returns pro-forma
-2.07% appreciation · 3.0% rent growth · sell at horizon
- IRR
- -15.2%
- Equity multiple
- 0.41×
- Total profit
- $-36,394
- Equity at exit
- $42,035
- IRR
- -7.9%
- Equity multiple
- 0.41×
- Total profit
- $-36,406
- Equity at exit
- $35,264
Cash invested: $61,600 (down + closing). Projections, not guarantees.
Landlord ↔ Tenant lean methodology
- Overall (STATE)
- 70 Landlord-Friendly
- State Delaware
- 70 Landlord-Friendly · D+7
- County
- — inherits STATE
- City
- — inherits STATE
ZIP-level market 19952
- Home prices YoY
- -0.8%
- Active inventory
- 72
- Price-to-rent
- 12.4×
Monthly cashflow live
- Estimated rent
- $1,475 medium interval (Pro) →
- Mortgage (P&I)
- −$1,154
- Tax from tax record
- −$66 /mo · $797/yr
- Insurance
- −$92
- HOA
- −$0
- Vacancy / Maint / Mgmt
- −$310
- Net cashflow
- $-146
Break-even live
UW: 25.0% down · 7.5% · 30yr · 1.5% tax · 5.0% vac · 8.0% maint · 8.0% mgmt
Financing live
Cash to close
- Down payment
- $55,000
- Closing costs
- $6,600
- Reserves months
- —
- Total cash needed
- —
Loan-product check · same deal, 3 products live
Conventional
25% down · 7.5% · 30yr
- Down + closing
- —
- Monthly P&I
- —
- Monthly cashflow
- —
- DSCR
- —
- Eligible?
- —
Personal DTI + credit; lowest rate.
DSCR
20% down · 8.5% · 30yr
- Down + closing
- —
- Monthly P&I
- —
- Monthly cashflow
- —
- DSCR
- —
- Eligible?
- —
No personal income docs; deal must DSCR.
Hard money
10% down · 12.0% · 12mo
- Down + closing
- —
- Monthly P&I
- —
- Monthly cashflow
- —
- DSCR
- —
- Eligible?
- —
Short-term bridge; refi at stabilization.
Listing history 23 events
-
2026-06-19days on market $220,000 Active 24 DOM
-
2026-06-18days on market $220,000 Active 23 DOM
-
2026-06-17days on market $220,000 Active 22 DOM
-
2026-06-16days on market $220,000 Active 21 DOM
-
2026-06-15remarks 428-char remark
-
2026-06-15days on market $220,000 Active 20 DOM
-
2026-06-14days on market $220,000 Active 18 DOM
-
2026-06-13days on market $220,000 Active 17 DOM
-
2026-06-10days on market $220,000 Active 15 DOM
-
2026-06-09days on market $220,000 Active 14 DOM
-
2026-06-08days on market $220,000 Active 13 DOM
-
2026-06-07days on market $220,000 Active 12 DOM
-
2026-06-05days on market $220,000 Active 9 DOM
-
2026-06-03days on market $220,000 Active 8 DOM
-
2026-06-02days on market $220,000 Active 7 DOM
-
2026-06-01days on market $220,000 Active 6 DOM
-
2026-05-31days on market $220,000 Active 5 DOM
-
2026-05-30days on market $220,000 Active 4 DOM
-
2026-05-26$220,000 Active
-
1999-10-25soldstatus $16,000
-
1999-10-07soldstatus $16,000 70-char remark
Show marketing remark (70 chars)
Mr-6657 Two Bedroom Cape, Would Be Great For First Time Starter Home.
-
1999-09-21historical 70-char remark
Show marketing remark (70 chars)
Mr-6657 Two Bedroom Cape, Would Be Great For First Time Starter Home.
-
1997-12-10$16,000 70-char remark
Show marketing remark (70 chars)
Mr-6657 Two Bedroom Cape, Would Be Great For First Time Starter Home.
ⓘ Source: listings_history table (triggers on properties + properties_extension) + one-shot
backfill from property_details.listing_events for pre-trigger history.
Tax reassessment forecast DE · Partial reset (capped growth)
- Current annual tax
- $797 · $66/mo
- Projected year-2 tax
- $1,037 · $86/mo
- Expected delta
- +$239/yr (+$20/mo · 30.0%)
ⓘ Screening estimate from a state-policy table — verify with the county assessor before closing.
Climate risk First Street
- Flood 1/10 Low FEMA zone X (unshaded) · 0% chance over 30 yrs
- Wildfire 1/10 Low
- Heat 8/10 Severe 7 d/yr ≥102°F today · 16 d/yr by 30 yrs out
- Wind 6/10 Major 64% chance of damaging wind over 30 yrs
- Air quality 2/10 Low 1 unhealthy d/yr today · 1 by 30 yrs out
Nearby sold comps map
Loading sold comps map…
Walkable amenities ~0.75 mi
Loading nearby amenities…
Taxation est. · year 1
- Rental income
- $17,704
- − Mortgage interest
- −$12,323
- − Property taxes
- −$797
- − Insurance
- −$1,100
- − Repairs & maintenance
- −$1,416
- − Management
- −$1,416
- − Depreciation
- −$6,400
- Taxable loss
- −$5,749
- Est. tax savings @ 24.0%
- +$1,380
- After-tax cash flow
- $-376/yr
For passive investors: Depreciation is non-cash, so a rental often shows a tax loss while cash-flowing — sheltering income. Rental losses are passive: they offset passive income freely, and up to $25,000/yr can offset ordinary (W-2) income if you actively participate and your MAGI is under $100k (phasing out to $0 by $150k); unused losses carry forward. On sale, claimed depreciation is recaptured at up to 25%, and gains may owe capital-gains tax (a 1031 exchange can defer both). Figures are a year-1 estimate at your 24.0% rate — not tax advice; consult a CPA.
Schools (NCES district)
- District
- Lake Forest School District
- NCES district ID
- 1000790
- Math proficiency
- 26% ▼ -23.00%
- Reading proficiency
- 44% ▼ -14.00%
- Median HH income
- $52,034
- Composite
- 30.47/100
- National rank
- #6225
- State rank
- #13 of 26 in DE
Livability — Harrington
- Score
- 73/100
- State rank
- #9
- US rank
- #5270
Category grades
Schools grade is shown separately in the Schools card above.
Census & demographics
- Census place
- Harrington, DE
- Population (ZIP)
- 10,730
Population outlook (Kent County) Hauer SSP2
- Today (2025)
- 194,477 people
- By 2030
- 204,351 · +5.1%
- By 2040
- 222,135 · +14.2%
- By 2050
- 236,483 · +21.6%
- By 2075
- 266,327 · +36.9%
- By 2100
- 275,335 · +41.6%
Race, ethnicity, and origin ACS 2023
- Neighborhood character
- Predominantly White (84%)
- Race & ethnicity
- White 84% Black 8% Hispanic / Latino 5% Two or more races 4% Asian 1%
- Hispanic origin (detail)
- Mexican 2% Puerto Rican 3%
- Common ancestry
- Slovak 2% Romanian 1% Portuguese 1%
- Foreign-born
- 3% · Canada, Vietnam, South Korea
- Languages at home
- 93% English-only · Spanish 4% Vietnamese 1% German/W. Germanic 1%
Political lean MEDSL · Kent
- 2024 margin
- Toss-up / Even · D 50.2% · R 48.2% · Other 1.7%
- 2008→2024 swing
- -7.8pp toward R · 2008: 9.8pp · 2024: 2.0pp
- All cycles
- 2024: D+2.0 2020: D+4.1 2016: R+4.9 2012: D+4.9 2008: D+9.8
Not yet ingested
- Civics
- —
Market trends
- HPI YoY
- ▼ -2.07%
- Current HPI
- 268.56
- Rent YoY
- —
- Metro
- —
- State GDP YoY
- —
- F500 in state
- 0
Price history
+1275.0% since first listed5 events — show timeline
- 2026-05-26 Listed $220,000 BRIGHT MLS
- 1999-10-25 Sold (Public Records) $16,000 Public Records
- 1999-10-07 Sold (MLS) $16,000 BRIGHT MLS
- 1999-09-21 Listing Removed — BRIGHT MLS
- 1997-12-10 Listed $16,000 BRIGHT MLS
Property tax history
+8.7%/yrLatest (2025): $797 · +0.4% YoY. Source: county tax records.
Cash-flow waterfall
monthlySold comps — $/sqft
last 12 mo · ≤1 miLoading sold comps…