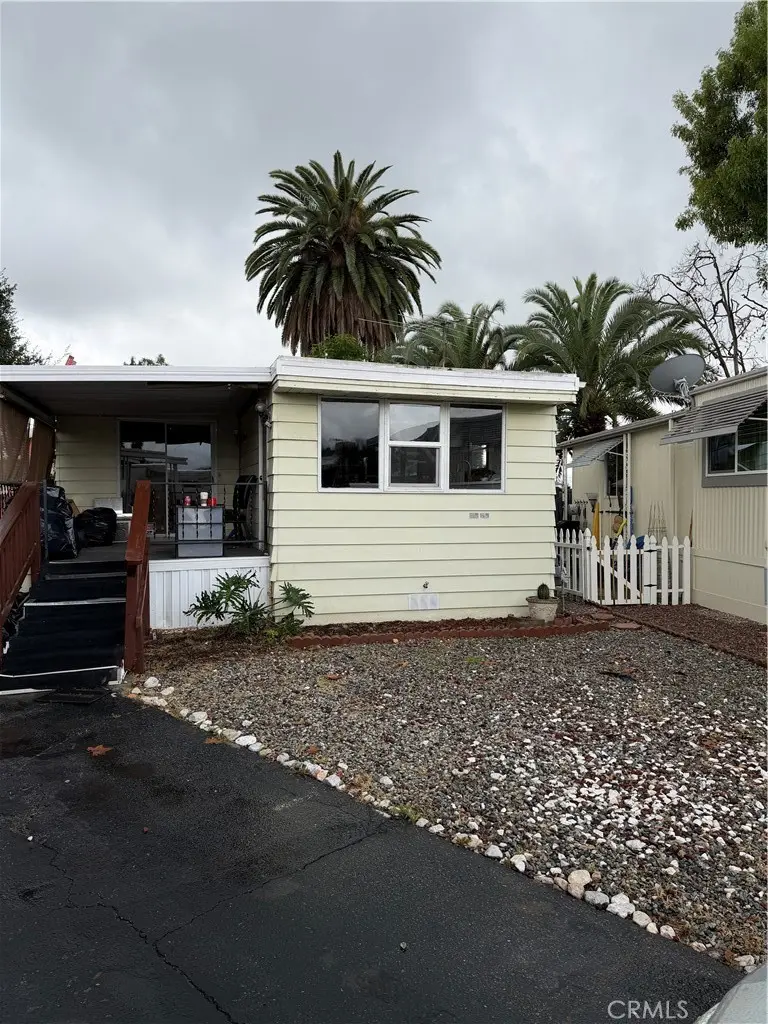
301 E Foothill #6 · Pomona, CA
Flood risk 1/10 · Minimal
- FEMA flood zone
- X (unshaded)
- Chance of flooding over 30 yrs
- 0.0%
- Est. flood insurance / yr
- $507 – $1,088
Fire risk 8/10 · Major
- Est. fire insurance / yr
- $659 – $1,223
Heat risk 6/10 · Moderate
- Hot days now (above 98°F)
- 7 days/yr
- Hot days in 30 yrs
- 17 days/yr
Wind risk 1/10 · Minimal
- Chance of severe wind over 30 yrs
- —
Air-quality risk 8/10 · Major
- Unhealthy air days now
- 16 days/yr
- Unhealthy air days in 30 yrs
- 19 days/yr
Risk factors via First Street. Map © Google.
Why this score? — see what drove the B+ grade
The composite is a weighted blend of 9 inputs, each scored 0–100. Each bar is that input's sub-score; the figure is the points it added to the 100-point composite (weight × sub-score).
- Cash flow +30.0/30.0
- ARV discount +11.4/15.0
- 1% rule +10.0/10.0
- DSCR +10.0/10.0
- Schools +5.3/10.0
- Rent growth +4.4/5.0
- Livability +2.9/5.0
- Condition / age +2.2/5.0
- Appreciation +0.0/10.0
$75,000
🖨 Deal sheet 📄 Offer letter ✓ Due diligence
Key facts
- Built 1965
- Listed 121 days
Neighborhood map
What this means for you Summary
Snapshot
- This is a 2-bed/2.0-bath manufactured listed at $75k. Condition is rated fair.
Deal economics
- At list price, monthly cash flow is $1k ($17k/yr) — positive.
- The deal already cash-flows at list — no discount required.
- Meets the 1% rule at list price ($2k rent vs $75k).
- Recommended offer: $66k (12.0% below list) — sets the bar for market timing.
- Cap rate 29.5% vs local median 2.8% in Pomona — top-decile yield for the area; either an underpriced asset or a hidden risk that comps aren't pricing in. Stress-test before assuming the spread holds.
Location & tenants
- Location reads 58/100 on livability (#676 in CA) — a working-class tenant base; expect higher turnover. Strengths: commute A+; Watch: schools D, crime F, amenities F.
- Claremont Unified (suburban): math 50% / reading 64% proficiency, ranked #259 of 1,400 in CA (top 18%) — acceptable for families but not a draw, mixed tenant base, ~2y average lease.
- Market conditions: Rents rising fast (+7.4%/yr); 87 active listings in the ZIP; 27 comparable units currently listed for rent nearby; rentals leasing fast (median 7d on market — plan ~1-2 weeks tenant-placement turnaround); solid renter incomes; 19,697 units permitted in Los Angeles County in 2024 (9,426 in 5+ unit buildings).
- This rent runs 38% of the median local income ($79k/yr) — at the standard rent-burdened threshold; future hikes will face affordability resistance.
Forward outlook
- Local home prices are declining (-3.0%/yr); year-one equity from $519 of loan paydown is wiped out by about $2k of value loss. Plan a longer hold.
- Los Angeles County population projected at +9% by 2050 — modest demand growth; plan on rents tracking national, not racing it.
- At projected returns (-3.0% appreciation + 7.4% rent growth), your $21k cash investment doubles in ~2 years — after that, you're playing with house money.
Negotiation context
- It's been on market 121 days — a 12% lower offer ($66k) is reasonable based on typical stale-listing flexibility.
Risks & watch-outs
- Climate carrying-cost: severe wildfire risk; extreme-heat days projected 7→17/yr by 2055 (HVAC capex compounding) — expect insurance premiums to compound above CPI over the hold.
Questions for the listing agent
- It's been on market 121 days. Have you received any prior offers? Is the seller open to a 12% concession, seller financing, or rate buy-down credit?
- Have any recent inspections been done? Can we get a copy of the seller's disclosures and any deferred-maintenance estimates?
- Built in 1965 — when were the roof, HVAC, electrical panel, plumbing, and water heater last replaced?
- Why hasn't it sold? Are there any deal-killer items the seller is aware of (foundation, flood, title, zoning, code violations)?
- Is there a deadline driving the sale (1031 exchange, divorce, estate, relocation)? That informs how much negotiation room exists.
- Schools are D-rated, which usually means shorter tenancies and higher turnover. Who's the typical renter profile here, and what's been the actual vacancy rate?
- Crime grade is F in this area — have there been break-ins, vandalism, or insurance claims at this property in the last 3 years? What carrier currently insures it and at what premium?
- What's the average days-on-market for RENTAL listings here right now (not sales)? A rising rental-DOM trend means longer vacancies and softer asking-rent achievability than the comps imply.
- What's the recent tenant-quality profile in this submarket — average credit score on applications, eviction rate, late-payment / NSF rate, and stable-employment percentage? A property-management company in the area should have these aggregated.
- How much new for-sale + rental construction is in the pipeline within 1–3 miles? Heavy new supply typically softens prices + rents 12–24 months out; constrained supply supports both.
Investment metrics
- 1% rule
- 3.32% ✓
- Cap rate
- 29.51%
- Cash-on-cash
- 82.90%
- DSCR
- 4.69
- GRM
- 2.5
CMA / ARV
- ARV (median comp)
- $82,031
- List price
- $75,000
- Delta
- -8.57%
- Verdict
- FAIR
- Comps
- 16 within 1.0 mi
Show comp detail 3 sales within ~0.75 mi
| Address | Dist | Beds/Ba | Sqft | Sold | Price | $/sf | Match |
|---|---|---|---|---|---|---|---|
| 301 E Foothill Blvd #94 | 0.00mi | 2/1.0 | 800 (-2%) | 3mo | $78,000 | $98 | 90 |
| 3727 Equation Rd #126 | 0.09mi | 2/1.0 | 800 (-2%) | 11mo | $165,000 | $206 | 79 |
| 301 E Foothill Blvd #28 | 0.00mi | 2/1.0 | 936 (+15%) | 9mo | $152,500 | $163 | 64 |
Match score weights: distance 35% · size 25% · config 20% · recency 20%. Top-matched comps best support the ARV.
Projected returns pro-forma
-3.0% appreciation · 7.41% rent growth · sell at horizon
- IRR
- 88.2%
- Equity multiple
- 5.37×
- Total profit
- $91,835
- Equity at exit
- $11,183
- IRR
- 92.2%
- Equity multiple
- 12.95×
- Total profit
- $251,021
- Equity at exit
- $6,485
Cash invested: $21,000 (down + closing). Projections, not guarantees.
Landlord ↔ Tenant lean methodology
- Overall (STATE)
- 18 Strongly Tenant-Friendly
- State California
- 18 Strongly Tenant-Friendly · D+13
- County
- — inherits STATE
- City
- — inherits STATE
ZIP-level market 91767
- Rents YoY
- 7.4%
- Active inventory
- 87
- Price-to-rent
- 2.5×
Monthly cashflow live
- Estimated rent
- $2,492 high interval (Pro) →
- Mortgage (P&I)
- −$393
- Tax est. 1.5%
- −$94 /mo · $1,125/yr
- Insurance
- −$31
- HOA
- −$0
- Vacancy / Maint / Mgmt
- −$523
- Net cashflow
- $1,451
Break-even live
UW: 25.0% down · 7.5% · 30yr · 1.5% tax · 5.0% vac · 8.0% maint · 8.0% mgmt
Financing live
Cash to close
- Down payment
- $18,750
- Closing costs
- $2,250
- Reserves months
- —
- Total cash needed
- —
Loan-product check · same deal, 3 products live
Conventional
25% down · 7.5% · 30yr
- Down + closing
- —
- Monthly P&I
- —
- Monthly cashflow
- —
- DSCR
- —
- Eligible?
- —
Personal DTI + credit; lowest rate.
DSCR
20% down · 8.5% · 30yr
- Down + closing
- —
- Monthly P&I
- —
- Monthly cashflow
- —
- DSCR
- —
- Eligible?
- —
No personal income docs; deal must DSCR.
Hard money
10% down · 12.0% · 12mo
- Down + closing
- —
- Monthly P&I
- —
- Monthly cashflow
- —
- DSCR
- —
- Eligible?
- —
Short-term bridge; refi at stabilization.
Rent comps 27 comps
| Address | Beds | Baths | Sqft | Rent | $/sqft | DOM | Units | Dist |
|---|---|---|---|---|---|---|---|---|
| 150 Drake St Pomona, CA | 2.0 | 2.0 | 924 | $2,514 | $2.72 | 1d | 2 | 0.43mi |
| 235 W Grove St Pomona, CA | 1.0–2.0 | 1.0–2.0 | 800 | $2,576 | $3.22 | 1d | 10 | 0.52mi |
| 3054 Gladstone St #4 Pomona, CA | 2.0 | 1.0 | 933 | $2,500 | $2.68 | 7d | 1 | 0.53mi |
| 2855 Foothill Blvd La Verne, CA | 1.0 | 1.0 | 765 | $2,622 | $3.43 | 1d | 3 | 0.57mi |
| 450 W Foothill Blvd Pomona, CA | 2.0 | 1.0–2.0 | 773 | $2,565 | $3.32 | 1d | 8 | 0.66mi |
| 2886 Sumner Ave Pomona, CA | 1.0 | 1.0 | 550 | $1,900 | $3.45 | 3d | 1 | 0.72mi |
| 2870 N Towne Ave Pomona, CA | 2.0 | 1.0–2.0 | 725 | $2,500 | $3.45 | 4d | 4 | 0.95mi |
| 2771 N Garey Ave Pomona, CA | 1.0–3.0 | 1.0–2.0 | 1065 | $2,930 | $2.75 | 1d | 8 | 0.98mi |
| 2429 College Ln La Verne, CA | 2.0 | 1.0 | 836 | $2,350 | $2.81 | 43d | 1 | 0.98mi |
| 1365 Lafayette Rd Unit C Claremont, CA | 2.0 | 1.0 | 900 | $2,750 | $3.06 | 3d | 1 | 1.05mi |
| 2366 Lomeli Ln La Verne, CA | 2.0 | 1.0 | 836 | $2,470 | $2.95 | 43d | 1 | 1.07mi |
| 2408 Pepper St La Verne, CA | 2.0 | 1.0 | 836 | $2,650 | $3.17 | 24d | 1 | 1.09mi |
| 2710 N Towne Ave Pomona, CA | 1.0 | 1.0 | 770 | $2,635 | $3.42 | 1d | 11 | 1.11mi |
| 960 E Bonita Ave #129 Pomona, CA | 1.0 | 1.0 | 680 | $2,500 | $3.68 | 2d | 1 | 1.14mi |
| 960 E Bonita Ave Pomona, CA | 1.0 | 1.0 | 607 | $2,300 | $3.79 | 6d | 2 | 1.17mi |
| 245 E Grevillia St Pomona, CA | 2.0 | 1.0 | 988 | $2,400 | $2.43 | 43d | 1 | 1.19mi |
| 777 Baylor Ave Unit 777 Claremont, CA | 2.0 | 1.0 | 672 | $2,500 | $3.72 | 7d | 1 | 1.19mi |
| 755 Baylor Ave Claremont, CA | 1.0 | 1.0 | 660 | $2,000 | $3.03 | 43d | 1 | 1.20mi |
| 2559 Yorkshire Way Pomona, CA | 2.0 | 2.0 | 1100 | $2,400 | $2.18 | 24d | 1 | 1.22mi |
| 167 N Cambridge Ave Unit 149 Claremont, CA | 2.0 | 2.0 | 1100 | $2,595 | $2.36 | 7d | 1 | 1.32mi |
| 145 N Cambridge Ave Unit 129 Claremont, CA | 2.0 | 2.0 | 1045 | $2,850 | $2.73 | 43d | 1 | 1.33mi |
| 2064 Evergreen St La Verne, CA | 2.0 | 2.0 | 960 | $2,400 | $2.50 | 17d | 1 | 1.33mi |
| 114 N Mountain Ave Unit 114 Claremont, CA | 2.0 | 2.0 | 1045 | $2,850 | $2.73 | 24d | 1 | 1.34mi |
| 2318 5th St La Verne, CA | 1.0 | 1.0 | 600 | $1,995 | $3.33 | 24d | 1 | 1.35mi |
| 2042 Evergreen St La Verne, CA | 2.0 | 1.0 | 825 | $2,150 | $2.61 | 43d | 1 | 1.36mi |
| 660 W Bonita Ave Claremont, CA | 1.0 | 1.0 | 650 | $2,175 | $3.35 | 7d | 1 | 1.38mi |
| 1250 N Indian Hill Blvd Claremont, CA | 2.0 | 2.0 | 1000 | $2,375 | $2.38 | 5d | 1 | 1.41mi |
Listing history 15 events
-
2026-06-18days on market $75,000 Active 121 DOM
-
2026-06-17days on market $75,000 Active 120 DOM
-
2026-06-16days on market $75,000 Active 119 DOM
-
2026-06-15days on market $75,000 Active 118 DOM
-
2026-06-13days on market $75,000 Active 116 DOM
-
2026-06-13days on market $75,000 Active 115 DOM
-
2026-06-09days on market $75,000 Active 112 DOM
-
2026-06-08days on market $75,000 Active 111 DOM
-
2026-06-07days on market $75,000 Active 110 DOM
-
2026-06-04days on market $75,000 Active 107 DOM
-
2026-06-03days on market $75,000 Active 106 DOM
-
2026-06-02days on market $75,000 Active 105 DOM
-
2026-06-01days on market $75,000 Active 104 DOM
-
2026-05-31days on market $75,000 Active 103 DOM
-
2026-02-17$75,000 Active
ⓘ Source: listings_history table (triggers on properties + properties_extension) + one-shot
backfill from property_details.listing_events for pre-trigger history.
Climate risk First Street
- Flood 1/10 Low FEMA zone X (unshaded) · 0% chance over 30 yrs
- Wildfire 8/10 Severe
- Heat 6/10 Major 7 d/yr ≥98°F today · 17 d/yr by 30 yrs out
- Wind 1/10 Low
- Air quality 8/10 Severe 16 unhealthy d/yr today · 19 by 30 yrs out
Nearby sold comps map
Loading sold comps map…
Walkable amenities ~0.75 mi
Loading nearby amenities…
Taxation est. · year 1
- Rental income
- $29,910
- − Mortgage interest
- −$4,201
- − Property taxes
- −$1,125
- − Insurance
- −$375
- − Repairs & maintenance
- −$2,393
- − Management
- −$2,393
- − Depreciation
- −$2,182
- Taxable income
- $17,241
- Est. tax owed @ 24.0%
- −$4,138
- After-tax cash flow
- $13,271/yr
For passive investors: Depreciation is non-cash, so a rental often shows a tax loss while cash-flowing — sheltering income. Rental losses are passive: they offset passive income freely, and up to $25,000/yr can offset ordinary (W-2) income if you actively participate and your MAGI is under $100k (phasing out to $0 by $150k); unused losses carry forward. On sale, claimed depreciation is recaptured at up to 25%, and gains may owe capital-gains tax (a 1031 exchange can defer both). Figures are a year-1 estimate at your 24.0% rate — not tax advice; consult a CPA.
Condition & rehab AI · 6 photos
This manufactured home requires moderate renovations, including kitchen and bathroom updates, and flooring replacement. The home has potential for significant value increase with these improvements.
Repairs flagged
- Major Kitchen cabinets — Cabinets removed, likely structural issues
- Major Bathroom fixtures — Likely plumbing issues
- Major Flooring — Subfloor exposed, likely structural issues
Value-add opportunities
- Resale Kitchen renovation — Modern kitchen design increases appeal
- Resale Bathroom renovation — Modern bathroom design increases appeal
- Resale Flooring replacement — New flooring improves aesthetics and functionality
Renovation cost estimate screening
| Repair item | Severity | Est. cost |
|---|---|---|
| Kitchen cabinets · Cabinets removed, likely structural issues | Major | $15,000–50,000 |
| Bathroom fixtures · Likely plumbing issues | Major | $15,000–50,000 |
| Flooring · Subfloor exposed, likely structural issues | Major | $15,000–50,000 |
| Total estimated repair cost · 3 items | $45,000–150,000 |
Value-add ROI direction
- Resale Kitchen renovation — Modern kitchen design increases appeal ↑
- Resale Bathroom renovation — Modern bathroom design increases appeal ↑
- Resale Flooring replacement — New flooring improves aesthetics and functionality ↑
ⓘ Cost ranges are severity-bucket heuristics (US national rule-of-thumb). Get contractor quotes + a written scope before underwriting a rehab budget.
Schools (NCES district)
- District
- Claremont Unified
- NCES district ID
- 0608760
- Math proficiency
- 50% ▼ -1.00%
- Reading proficiency
- 64% ▬ 0.00%
- Median HH income
- $80,091
- Composite
- 53.17/100
- National rank
- #3209
- State rank
- #259 of 1400 in CA
Livability — Pomona
- Score
- 58/100
- State rank
- #676
- US rank
- #20782
Category grades
Schools grade is shown separately in the Schools card above.
Census & demographics
- Census place
- Pomona, CA
- County
- Los Angeles County · 9,444,647 people
- City population
- 152,679
- Metro
- Los Angeles-Long Beach-Anaheim, CA
- Population (ZIP)
- 49,152
- Household income
- $79,245
- Rent vs Own
- Severe rent burden
- 2224.0
Population outlook (Los Angeles County) Hauer SSP2
- Today (2025)
- 10,940,515 people
- By 2030
- 11,256,481 · +2.9%
- By 2040
- 11,729,929 · +7.2%
- By 2050
- 11,948,407 · +9.2%
- By 2075
- 11,818,114 · +8.0%
- By 2100
- 10,842,928 · -0.9%
Race, ethnicity, and origin ACS 2023
- Neighborhood character
- Predominantly Hispanic (69%)
- Race & ethnicity
- Hispanic / Latino 69% Two or more races 20% White 13% Asian 9% Black 6% Native American 2%
- Hispanic origin (detail)
- Mexican 61%
- Common ancestry
- Italian 1% Lithuanian 1% Russian 1%
- Foreign-born
- 29% · Canada, China, South Korea
- Languages at home
- 42% English-only · Spanish 48% Chinese 3% Korean 2%
Political lean MEDSL · Los Angeles
- 2024 margin
- Solid D (+32.9) · D 64.8% · R 31.9% · Other 3.3%
- 2008→2024 swing
- -7.4pp toward R · 2008: 40.4pp · 2024: 32.9pp
- All cycles
- 2024: D+32.9 2020: D+44.2 2016: D+48.0 2012: D+40.0 2008: D+40.4
Not yet ingested
- Civics
- —
Market trends
- HPI YoY
- ▼ -655.99%
- Current HPI
- 486.823
- Rent YoY
- ▲ 7.41%
- Metro
- Los Angeles-Long Beach-Anaheim, CA
- State GDP YoY
- ▲ 3.21%
- F500 in state
- 116
Industry mix (Fortune 500 HQ in CA)
| Industry | F500 HQs | Revenue |
|---|---|---|
| Technology | 27 | $1,492B |
|
||
| Financial Services | 3 | $174B |
|
||
| Retail | 3 | $44B |
|
||
| Insurance | 3 | $26B |
|
||
| Media / Entertainment | 2 | $115B |
|
||
| Pharmaceuticals / Biotech | 2 | $62B |
|
||
Price history
1 event — show timeline
- 2026-02-17 Listed $75,000 CRMLS
Cash-flow waterfall
monthlySold comps — $/sqft
last 12 mo · ≤1 miLoading sold comps…