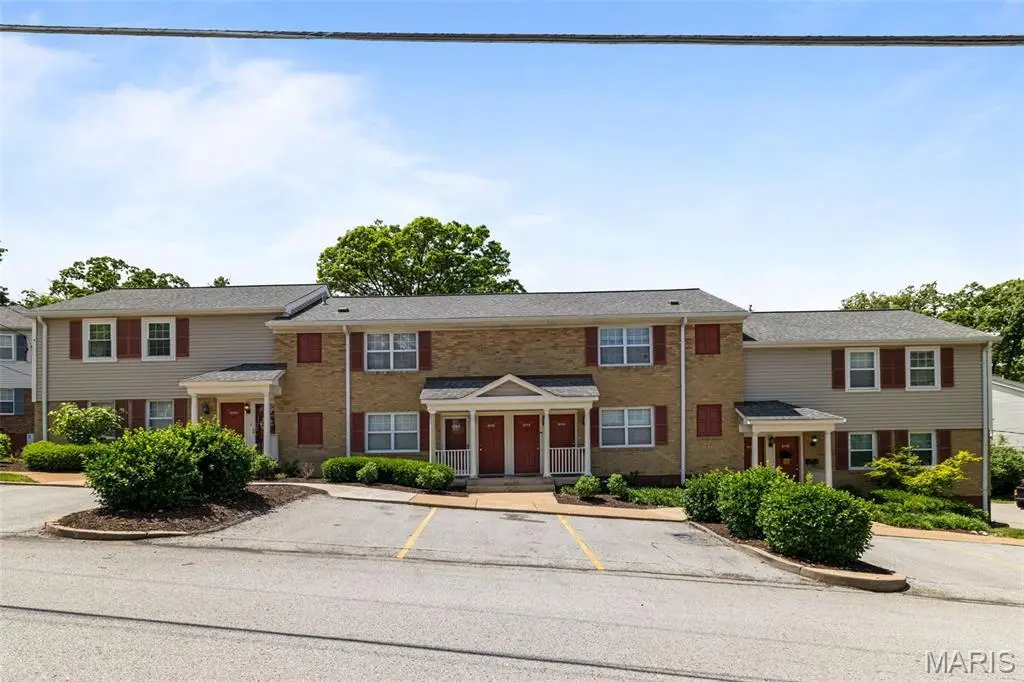
9106 W Swan Cir · Brentwood, MO
Flood risk 1/10 · Minimal
- FEMA flood zone
- X (unshaded)
- Chance of flooding over 30 yrs
- 0.0%
- Est. flood insurance / yr
- $507 – $1,088
Fire risk 1/10 · Minimal
- Est. fire insurance / yr
- $1,054 – $1,958
Heat risk 5/10 · Moderate
- Hot days now (above 107°F)
- 7 days/yr
- Hot days in 30 yrs
- 20 days/yr
Wind risk 2/10 · Minimal
- Chance of severe wind over 30 yrs
- 1.0%
Air-quality risk 3/10 · Minor
- Unhealthy air days now
- 2 days/yr
- Unhealthy air days in 30 yrs
- 4 days/yr
Risk factors via First Street. Map © Google.
Why this score? — see what drove the C- grade
The composite is a weighted blend of 9 inputs, each scored 0–100. Each bar is that input's sub-score; the figure is the points it added to the 100-point composite (weight × sub-score).
- ARV discount +15.0/15.0
- Cash flow +12.2/30.0
- 1% rule +6.5/10.0
- Schools +5.8/10.0
- Livability +4.2/5.0
- DSCR +3.6/10.0
- Rent growth +2.9/5.0
- Condition / age +2.5/5.0
- Appreciation +0.0/10.0
$119,000
🖨 Deal sheet 📄 Offer letter ✓ Due diligence
Listing remarks MLS
Enjoy all of the amenities of Brentwood Forest when you move into this bright and spacious home! This 1 bed/1 bath top-level unit is ready for its new owners! You'll have an open layout, with the living room flowing into the dining room and filled with natural light. The kitchen features a tile backsplash, crown molding, white cabinets, and a convenient stacked washer/dryer. The bedroom has two closets and an en-suite bath with tilework and brass fixtures. You'll be just steps from the community pool, clubhouse, tennis courts, and scenic lake! Located in the heart of Brentwood, you'll also have quick access to shopping and restaurants in the Galleria, Brentwood Promenade and Square, plus nearby highways and parks. Don't miss out on this great opportunity!
Key facts
- $304 HOA
- Community pool
- Built 1950
Neighborhood map
What this means for you Summary
Snapshot
- This is a 1-bed/1.0-bath condo listed at $119k.
Deal economics
- At list price, monthly cash flow is $-25 ($-298/yr) — negative.
- To cash-flow at today's rent, offer at most $115k (3.7% below list).
- Meets the 1% rule at list price ($1k rent vs $119k).
- Recommended offer: $105k (12.0% below list) — sets the bar for market timing.
- Cap rate 6.0% vs local median 4.8% in Brentwood — meaningfully above typical; check what's discounted (condition, days-on-market, listing class) to confirm the premium yield is real.
Location & tenants
- Location reads 84/100 on livability (#6 in MO, #689 nationally) — a professional / high-income tenant draw. Strengths: schools A+, employment A+, housing A+; Watch: crime C-.
- Brentwood (suburban): math 65% / reading 66% proficiency, ranked #4 of 324 in MO (top 1%) — acceptable for families but not a draw, mixed tenant base, ~2y average lease; only 18% free/reduced lunch — higher-income household profile.
- Market conditions: Rents rising (+1.5%/yr); 128 active listings in the ZIP; 4 comparable units currently listed for rent nearby; rentals leasing fast (median 2d on market — plan ~1-2 weeks tenant-placement turnaround); solid renter incomes; 920 units permitted in St. Louis County in 2024 (250 in 5+ unit buildings).
- This rent is only 16% of the median local income ($104k/yr) — well below the 30% rent-burden line; pricing power to push rent on renewal without tenant pushback.
Forward outlook
- Local home prices are declining (-3.0%/yr); year-one equity from $823 of loan paydown is wiped out by about $4k of value loss. Plan a longer hold.
Negotiation context
- It's been on market 399 days — a 12% lower offer ($105k) is reasonable based on typical stale-listing flexibility.
- Current owner paid $51k; list at $119k implies a 134% gain — meaningful room to come down on a strong offer.
Risks & watch-outs
- Watch-outs: HOA is 22% of rent; built in 1950 — expect roof / HVAC / electrical / plumbing capex.
- Climate carrying-cost: extreme-heat days projected 7→20/yr by 2055 (HVAC capex compounding) — expect insurance premiums to compound above CPI over the hold.
Questions for the listing agent
- What do current leases actually rent for vs. the listed asking? Can we see a recent rent roll and the last 12 months of T-12 income?
- It's been on market 399 days. Have you received any prior offers? Is the seller open to a 12% concession, seller financing, or rate buy-down credit?
- Built in 1950 — when were the roof, HVAC, electrical panel, plumbing, and water heater last replaced?
- What does the HOA fee cover, when was the last increase, and are there any pending special assessments or reserve-fund shortfalls?
- Any open or pending special assessments — roof, HVAC, plumbing, elevator, façade? What's the per-unit balance and payoff schedule, and is the seller paying it off at close or rolling it to the buyer?
- Why hasn't it sold? Are there any deal-killer items the seller is aware of (foundation, flood, title, zoning, code violations)?
- Is there a deadline driving the sale (1031 exchange, divorce, estate, relocation)? That informs how much negotiation room exists.
- Schools are A-rated — typically a magnet for longer-tenancy family renters. What's the average tenant stay here, and is there a school-zone premium baked into asking?
- What's the average days-on-market for RENTAL listings here right now (not sales)? A rising rental-DOM trend means longer vacancies and softer asking-rent achievability than the comps imply.
- What's the recent tenant-quality profile in this submarket — average credit score on applications, eviction rate, late-payment / NSF rate, and stable-employment percentage? A property-management company in the area should have these aggregated.
- How much new apartment / multifamily construction is in the pipeline within 1–3 miles? Heavy new supply (>2% of stock underway) typically softens rents 12–24 months out; light construction supports rent growth.
Investment metrics
- 1% rule
- 1.15% ✓
- Cap rate
- 6.04%
- Cash-on-cash
- -0.89%
- DSCR
- 0.96
- GRM
- 7.2
CMA / ARV
- ARV (median comp)
- $186,658
- List price
- $119,000
- Delta
- -36.25%
- Verdict
- UNDERPRICED
- Comps
- 20 within 1.0 mi
Projected returns pro-forma
-3.0% appreciation · 1.49% rent growth · sell at horizon
- IRR
- -19.9%
- Equity multiple
- 0.32×
- Total profit
- $-22,718
- Equity at exit
- $17,743
- IRR
- -17.4%
- Equity multiple
- 0.12×
- Total profit
- $-29,184
- Equity at exit
- $10,289
Cash invested: $33,320 (down + closing). Projections, not guarantees.
Landlord ↔ Tenant lean methodology
- Overall (STATE)
- 81 Strongly Landlord-Friendly
- State Missouri
- 81 Strongly Landlord-Friendly · R+10
- County
- — inherits STATE
- City
- — inherits STATE
ZIP-level market 63144
- Rents YoY
- 1.5%
- Active inventory
- 128
- Price-to-rent
- 7.2×
Monthly cashflow live
- Estimated rent
- $1,369 medium interval (Pro) →
- Mortgage (P&I)
- −$624
- Tax from tax record
- −$129 /mo · $1,549/yr
- Insurance
- −$50
- HOA
- −$304
- Vacancy / Maint / Mgmt
- −$288
- Net cashflow
- $-25
Break-even live
UW: 25.0% down · 7.5% · 30yr · 1.5% tax · 5.0% vac · 8.0% maint · 8.0% mgmt
Financing live
Cash to close
- Down payment
- $29,750
- Closing costs
- $3,570
- Reserves months
- —
- Total cash needed
- —
Loan-product check · same deal, 3 products live
Conventional
25% down · 7.5% · 30yr
- Down + closing
- —
- Monthly P&I
- —
- Monthly cashflow
- —
- DSCR
- —
- Eligible?
- —
Personal DTI + credit; lowest rate.
DSCR
20% down · 8.5% · 30yr
- Down + closing
- —
- Monthly P&I
- —
- Monthly cashflow
- —
- DSCR
- —
- Eligible?
- —
No personal income docs; deal must DSCR.
Hard money
10% down · 12.0% · 12mo
- Down + closing
- —
- Monthly P&I
- —
- Monthly cashflow
- —
- DSCR
- —
- Eligible?
- —
Short-term bridge; refi at stabilization.
Rent comps 4 comps
| Address | Beds | Baths | Sqft | Rent | $/sqft | DOM | Units | Dist |
|---|---|---|---|---|---|---|---|---|
| 1800 S Brentwood Blvd Saint Louis, MO | 1.0–3.0 | 1.0–2.0 | 1164 | $1,490 | $1.28 | 1d | 19 | 0.61mi |
| 9305 Manchester Rd St. Louis, MO | 1.0–2.0 | 1.0 | 776 | $1,018 | $1.31 | 2d | 12 | 1.06mi |
| 72 Van Mark Way Brentwood, MO | 1.0–2.0 | 1.0 | 780 | $1,102 | $1.41 | 1d | 4 | 1.09mi |
| 1034 N Rock Hill Rd Saint Louis, MO | 2.0 | 1.0 | 696 | $1,650 | $2.37 | 43d | 1 | 1.12mi |
HOA detail condo
- Monthly dues
- $304 · $3,648/yr
- Likely covers
- pool
- Assessments
- None detected in remarks — confirm with the listing agent.
Listing history 21 events
-
2026-06-18days on market $119,000 Active 399 DOM
-
2026-06-17days on market $119,000 Active 398 DOM
-
2026-06-16days on market $119,000 Active 397 DOM
-
2026-06-15days on market $119,000 Active 396 DOM
-
2026-06-13days on market $119,000 Active 394 DOM
-
2026-06-13days on market $119,000 Active 393 DOM
-
2026-06-09days on market $119,000 Active 390 DOM
-
2026-06-08days on market $119,000 Active 389 DOM
-
2026-06-07days on market $119,000 Active 388 DOM
-
2026-06-03days on market $119,000 Active 384 DOM
-
2026-06-02days on market $119,000 Active 383 DOM
-
2026-06-02price $119,000 Active 382 DOM
-
2026-06-01days on market $129,000 Active 382 DOM
-
2026-05-31days on market $129,000 Active 381 DOM
-
2025-09-04price $129,000 765-char remark
Show marketing remark (765 chars)
Enjoy all of the amenities of Brentwood Forest when you move into this bright and spacious home! This 1 bed/1 bath top-level unit is ready for its new owners! You'll have an open layout, with the living room flowing into the dining room and filled with natural light. The kitchen features a tile backsplash, crown molding, white cabinets, and a convenient stacked washer/dryer. The bedroom has two closets and an en-suite bath with tilework and brass fixtures. You'll be just steps from the community pool, clubhouse, tennis courts, and scenic lake! Located in the heart of Brentwood, you'll also have quick access to shopping and restaurants in the Galleria, Brentwood Promenade and Square, plus nearby highways and parks. Don't miss out on this great opportunity!
-
2025-06-04price $137,500 765-char remark
Show marketing remark (765 chars)
Enjoy all of the amenities of Brentwood Forest when you move into this bright and spacious home! This 1 bed/1 bath top-level unit is ready for its new owners! You'll have an open layout, with the living room flowing into the dining room and filled with natural light. The kitchen features a tile backsplash, crown molding, white cabinets, and a convenient stacked washer/dryer. The bedroom has two closets and an en-suite bath with tilework and brass fixtures. You'll be just steps from the community pool, clubhouse, tennis courts, and scenic lake! Located in the heart of Brentwood, you'll also have quick access to shopping and restaurants in the Galleria, Brentwood Promenade and Square, plus nearby highways and parks. Don't miss out on this great opportunity!
-
2025-05-15status Active 765-char remark
Show marketing remark (765 chars)
Enjoy all of the amenities of Brentwood Forest when you move into this bright and spacious home! This 1 bed/1 bath top-level unit is ready for its new owners! You'll have an open layout, with the living room flowing into the dining room and filled with natural light. The kitchen features a tile backsplash, crown molding, white cabinets, and a convenient stacked washer/dryer. The bedroom has two closets and an en-suite bath with tilework and brass fixtures. You'll be just steps from the community pool, clubhouse, tennis courts, and scenic lake! Located in the heart of Brentwood, you'll also have quick access to shopping and restaurants in the Galleria, Brentwood Promenade and Square, plus nearby highways and parks. Don't miss out on this great opportunity!
-
1995-12-28soldstatus $50,800
-
1994-06-22soldstatus
-
1994-05-01soldstatus $43,000
-
1994-05-01soldstatus
ⓘ Source: listings_history table (triggers on properties + properties_extension) + one-shot
backfill from property_details.listing_events for pre-trigger history.
Tax reassessment forecast MO · Resets to sale price
- Current annual tax
- $1,549 · $129/mo
- Projected year-2 tax
- $1,549 · $129/mo
- Expected delta
- $0/yr ($0/mo · 0.0%)
ⓘ Screening estimate from a state-policy table — verify with the county assessor before closing.
Climate risk First Street
- Flood 1/10 Low FEMA zone X (unshaded) · 0% chance over 30 yrs
- Wildfire 1/10 Low
- Heat 5/10 Major 7 d/yr ≥107°F today · 20 d/yr by 30 yrs out
- Wind 2/10 Low 100% chance of damaging wind over 30 yrs
- Air quality 3/10 Moderate 2 unhealthy d/yr today · 4 by 30 yrs out
Nearby sold comps map
Loading sold comps map…
Walkable amenities ~0.75 mi
Loading nearby amenities…
Taxation est. · year 1
- Rental income
- $16,434
- − Mortgage interest
- −$6,666
- − Property taxes
- −$1,549
- − Insurance
- −$595
- − Repairs & maintenance
- −$1,315
- − Management
- −$1,315
- − HOA
- −$3,648
- − Depreciation
- −$3,462
- Taxable loss
- −$2,115
- Est. tax savings @ 24.0%
- +$508
- After-tax cash flow
- $210/yr
For passive investors: Depreciation is non-cash, so a rental often shows a tax loss while cash-flowing — sheltering income. Rental losses are passive: they offset passive income freely, and up to $25,000/yr can offset ordinary (W-2) income if you actively participate and your MAGI is under $100k (phasing out to $0 by $150k); unused losses carry forward. On sale, claimed depreciation is recaptured at up to 25%, and gains may owe capital-gains tax (a 1031 exchange can defer both). Figures are a year-1 estimate at your 24.0% rate — not tax advice; consult a CPA.
Schools (NCES district)
- District
- Brentwood
- NCES district ID
- 2905880
- Math proficiency
- 65% ▼ -3.00%
- Reading proficiency
- 66% ▼ -1.00%
- Median HH income
- $69,522
- Composite
- 57.51/100
- National rank
- #1069
- State rank
- #4 of 324 in MO
Livability — Brentwood
- Score
- 84/100
- State rank
- #6
- US rank
- #689
Category grades
Schools grade is shown separately in the Schools card above.
Census & demographics
- Census place
- Brentwood, MO
- County
- Saint Louis County · 888,823 people
- City population
- 9,505
- Metro
- St. Louis, MO-IL
- Population (ZIP)
- 9,505
- Household income
- $104,438
- Rent vs Own
- Severe rent burden
- 310.0
Population outlook (St. Louis County) Hauer SSP2
- Today (2025)
- 1,025,227 people
- By 2030
- 1,028,023 · +0.3%
- By 2040
- 1,020,940 · -0.4%
- By 2050
- 1,007,280 · -1.8%
- By 2075
- 987,277 · -3.7%
- By 2100
- 921,984 · -10.1%
Race, ethnicity, and origin ACS 2023
- Neighborhood character
- Predominantly White (78%)
- Race & ethnicity
- White 78% Two or more races 10% Asian 7% Black 5% Hispanic / Latino 2%
- Common ancestry
- Romanian 4% Italian 3% Slovak 2%
- Foreign-born
- 11% · China, Canada, South Korea
- Languages at home
- 91% English-only · Other Asian/Pacific 2% Spanish 2% Russian/Polish/Slavic 1%
Political lean MEDSL · St. Louis
- 2024 margin
- Strong D (+23.4) · D 60.8% · R 37.4% · Other 1.7%
- 2008→2024 swing
- +3.5pp toward D · 2008: 19.9pp · 2024: 23.4pp
- All cycles
- 2024: D+23.4 2020: D+24.0 2016: D+16.2 2012: D+13.7 2008: D+19.9
Not yet ingested
- Civics
- —
Market trends
- HPI YoY
- ▼ -411.33%
- Current HPI
- 207.0145
- Rent YoY
- ▲ 1.49%
- Metro
- St. Louis, MO-IL
- State GDP YoY
- ▲ 1.84%
- F500 in state
- 20
Industry mix (Fortune 500 HQ in MO)
| Industry | F500 HQs | Revenue |
|---|---|---|
| Healthcare | 1 | $163B |
|
||
| Insurance | 1 | $21B |
|
||
| Industrial Technology | 1 | $17B |
|
||
| Retail | 1 | $16B |
|
||
| Industrial Distribution | 1 | $10B |
|
||
| Utilities | 1 | $9B |
|
||
Price history
+200.0% since first listed7 events — show timeline
- 2025-09-04 Price Changed $129,000 MARIS as Distributed by MLS Grid
- 2025-06-04 Price Changed $137,500 MARIS as Distributed by MLS Grid
- 2025-05-15 Relisted — MARIS as Distributed by MLS Grid
- 1995-12-28 Sold (Public Records) $50,800 Public Records
- 1994-06-22 Sold (Public Records) — Public Records
- 1994-05-01 Sold (Public Records) — Public Records
- 1994-05-01 Sold (Public Records) $43,000 Public Records
Property tax history
+3.8%/yrLatest (2022): $1,549 · +0.8% YoY. Source: county tax records.
Cash-flow waterfall
monthlySold comps — $/sqft
last 12 mo · ≤1 miLoading sold comps…