 Multi-family
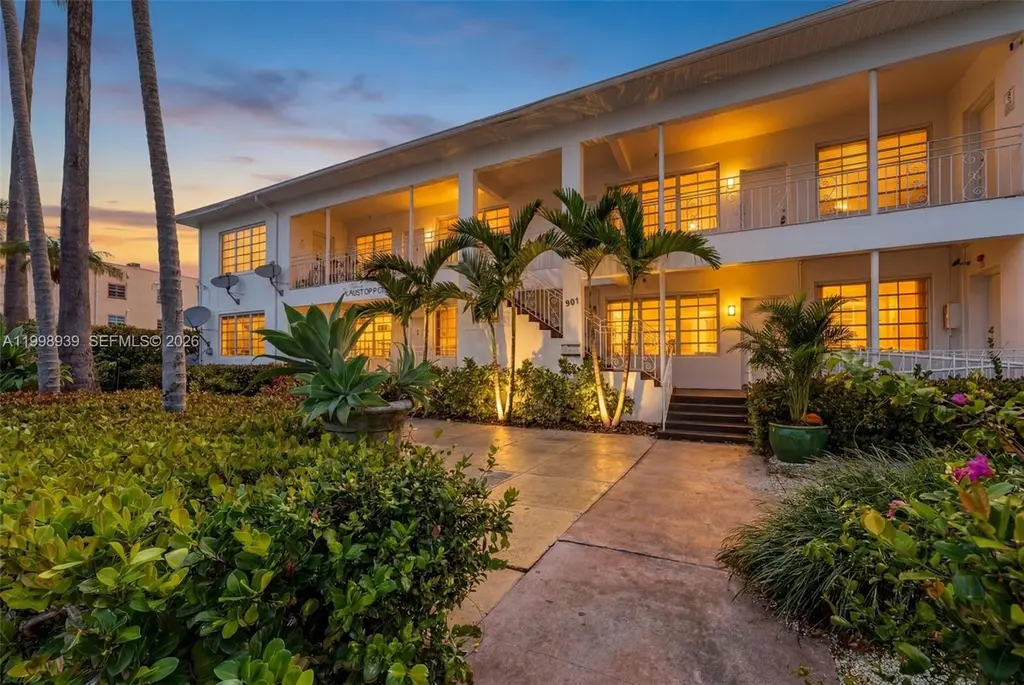
901 Pennsylvania Ave · Miami Beach, FL
Flood risk No data
- FEMA flood zone
- —
- Chance of flooding over 30 yrs
- —
- Est. flood insurance / yr
- —
Fire risk No data
- Est. fire insurance / yr
- —
Heat risk No data
- Hot days now (above threshold)
- —
- Hot days in 30 yrs
- —
Wind risk No data
- Chance of severe wind over 30 yrs
- —
Air-quality risk No data
- Unhealthy air days now
- —
- Unhealthy air days in 30 yrs
- —
Risk factors via First Street. Map © Google.
Why this score? — see what drove the B grade
The composite is a weighted blend of 9 inputs, each scored 0–100. Each bar is that input's sub-score; the figure is the points it added to the 100-point composite (weight × sub-score).
- Cash flow +30.0/30.0
- 1% rule +10.0/10.0
- DSCR +10.0/10.0
- ARV discount +7.5/15.0
- Schools +4.2/10.0
- Livability +4.0/5.0
- Appreciation +3.9/10.0
- Condition / age +2.5/5.0
- Rent growth +2.4/5.0
$3,450,000
🖨 Deal sheet 📄 Offer letter ✓ Due diligence
Multi-family units
County records classify this as Multi-Family (2-4 Unit). Listing-text estimate: 1 unit. estimate disagrees with records
Listing remarks
Introducing 901 PENN, a prime South Beach investment on a 7,500 SF corner lot at Pennsylvania Ave & 9th St. This mixed-use property features six (6) apartments & four (4) ground-floor retail/office units with Washington Ave visibility, ensuring strong tenant demand. A stabilized income-generating asset offering multiple investment strategies, including retail repositioning, owner-user occupancy, or redevelopment potential. Recent capital improvements—new roof (2023), exterior paint, AC units, & more. Positioned in a high-foot-traffic area, surrounded by hotels, restaurants, shopping, and nightlife, 901 PENN benefits from unbeatable exposure and walkability. With s
Key facts
- Ground-floor retail
- Mixed-use property
- Corner lot
Tags
Property features AI
Finance
- Other: Virtual tour available via external link
- Financial info: Annual tax amount reported (not included per instructions); Rent includes sewer, trash collection, and water
Exterior
- Utilities: Cable available; Public sewer
- Home design: 2-story property; Effective year built listed
- Construction: Block construction; Composition roof
- Exterior features: Less than quarter acre lot; Zoned RO
Interior
- Flooring: Concrete; Tile
- Heating & cooling: Central heating; Wall furnace; Central air conditioning; Wall/window unit(s) for cooling
- Interior features: Concrete and tile flooring
Neighborhood map
What this means for you Summary
Snapshot
- This is a multifamily listed at $3.45M.
Deal economics
- At list price, monthly cash flow is $57k ($687k/yr) — positive.
- The deal already cash-flows at list — no discount required.
- Meets the 1% rule at list price ($103k rent vs $3.45M).
- Recommended offer: $3.24M (6.0% below list) — sets the bar for market timing.
- Cap rate 26.2% vs local median 1.5% in Miami Beach — top-decile yield for the area; either an underpriced asset or a hidden risk that comps aren't pricing in. Stress-test before assuming the spread holds.
Location & tenants
- Location reads 80/100 on livability (#108 in FL, #1,672 nationally) — a professional / high-income tenant draw. Strengths: crime A+, commute A+, health & safety A+; Watch: housing C-, amenities D-, cost of living F.
- Miami-Dade (suburban): math 45% / reading 54% proficiency, ranked #40 of 73 in FL (top 55%) — families likely to look elsewhere, expect single-tenant / working-renter base with shorter leases; 64% free/reduced lunch — lower-income household profile, screen leases tightly.
- Market conditions: Rents soft (-0.4%/yr); 1208 active listings in the ZIP; 40 comparable units currently listed for rent nearby; rentals at typical pace (median 22d on market — plan ~3-4 weeks tenant-placement turnaround); 10,051 units permitted in Miami-Dade County in 2024 (7,758 in 5+ unit buildings).
- At $102,634/mo this rent would consume 1765% of the median local household income ($70k/yr) (locally 4052% of renters already pay >50% of income on rent) — very limited rent-growth headroom before tenants either downsize or default.
Forward outlook
- Local home prices are declining (-2.2%/yr); year-one equity from $24k of loan paydown is wiped out by about $75k of value loss. Plan a longer hold.
- Miami-Dade County population projected at +28% by 2050 — long-run rental-demand tailwind backs the buy-and-hold thesis.
- At projected returns (-2.2% appreciation + 0.0% rent growth), your $966k cash investment doubles in ~2 years — after that, you're playing with house money.
Negotiation context
- It's been on market 69 days — a 6% lower offer ($3.24M) is reasonable based on typical stale-listing flexibility.
- 4 sale attempts since 8y ago; this cycle's ask is 192101% above the opening price — seller raised mid-cycle; expect resistance to lowballs.
Risks & watch-outs
- Watch-outs: built in 1948 — expect roof / HVAC / electrical / plumbing capex.
Questions for the listing agent
- It's been on market 69 days. Have you received any prior offers? Is the seller open to a 6% concession, seller financing, or rate buy-down credit?
- Built in 1948 — when were the roof, HVAC, electrical panel, plumbing, and water heater last replaced?
- Why hasn't it sold? Are there any deal-killer items the seller is aware of (foundation, flood, title, zoning, code violations)?
- Is there a deadline driving the sale (1031 exchange, divorce, estate, relocation)? That informs how much negotiation room exists.
- Schools are A-rated — typically a magnet for longer-tenancy family renters. What's the average tenant stay here, and is there a school-zone premium baked into asking?
- What's the average days-on-market for RENTAL listings here right now (not sales)? A rising rental-DOM trend means longer vacancies and softer asking-rent achievability than the comps imply.
- What's the recent tenant-quality profile in this submarket — average credit score on applications, eviction rate, late-payment / NSF rate, and stable-employment percentage? A property-management company in the area should have these aggregated.
- How much new apartment / multifamily construction is in the pipeline within 1–3 miles? Heavy new supply (>2% of stock underway) typically softens rents 12–24 months out; light construction supports rent growth.
Investment metrics
- 1% rule
- 2.97% ✓
- Cap rate
- 26.20%
- Cash-on-cash
- 71.10%
- DSCR
- 4.16
- GRM
- 2.8
CMA / ARV
No comps found within radius.
Show comp detail 1 sale within ~0.75 mi
| Address | Dist | Beds/Ba | Sqft | Sold | Price | $/sf | Match |
|---|---|---|---|---|---|---|---|
| 1150 8th St | 0.44mi | —/— | 5,426 | 5mo | $2,820,000 | $520 | 63 |
Match score weights: distance 35% · size 25% · config 20% · recency 20%. Top-matched comps best support the ARV.
Projected returns pro-forma
-2.19% appreciation · 0.0% rent growth · sell at horizon
- IRR
- 68.0%
- Equity multiple
- 4.01×
- Total profit
- $2,905,917
- Equity at exit
- $640,613
- IRR
- 70.6%
- Equity multiple
- 7.39×
- Total profit
- $6,173,346
- Equity at exit
- $519,666
Cash invested: $966,000 (down + closing). Projections, not guarantees.
Landlord ↔ Tenant lean methodology
- Overall (STATE)
- 87 Strongly Landlord-Friendly
- State Florida
- 87 Strongly Landlord-Friendly · R+3
- County
- — inherits STATE
- City
- — inherits STATE
ZIP-level market 33139
- Home prices YoY
- -0.8%
- Rents YoY
- -0.4%
- Active inventory
- 1208
- Price-to-rent
- 16.8×
Monthly cashflow live
- Estimated rent
- $102,634 high interval (Pro) →
- Mortgage (P&I)
- −$18,092
- Tax est. 1.5%
- −$4,312 /mo · $51,750/yr
- Insurance
- −$1,438
- HOA
- −$0
- Vacancy / Maint / Mgmt
- −$21,553
- Net cashflow
- $57,239
Break-even live
6-unit breakdown (identical units grouped — click to expand)
| Units | Beds | Baths | Est. rent |
|---|---|---|---|
| 6× units | 1 | 1 | $102,636 |
| #1 | 1 | 1 | $17,106 |
| #2 | 1 | 1 | $17,106 |
| #3 | 1 | 1 | $17,106 |
| #4 | 1 | 1 | $17,106 |
| #5 | 1 | 1 | $17,106 |
| #6 | 1 | 1 | $17,106 |
| Total (6 units) | $102,634 | ||
UW: 25.0% down · 7.5% · 30yr · 1.5% tax · 5.0% vac · 8.0% maint · 8.0% mgmt
Financing live
Cash to close
- Down payment
- $862,500
- Closing costs
- $103,500
- Reserves months
- —
- Total cash needed
- —
Loan-product check · same deal, 3 products live
Conventional
25% down · 7.5% · 30yr
- Down + closing
- —
- Monthly P&I
- —
- Monthly cashflow
- —
- DSCR
- —
- Eligible?
- —
Personal DTI + credit; lowest rate.
DSCR
20% down · 8.5% · 30yr
- Down + closing
- —
- Monthly P&I
- —
- Monthly cashflow
- —
- DSCR
- —
- Eligible?
- —
No personal income docs; deal must DSCR.
Hard money
10% down · 12.0% · 12mo
- Down + closing
- —
- Monthly P&I
- —
- Monthly cashflow
- —
- DSCR
- —
- Eligible?
- —
Short-term bridge; refi at stabilization.
Rent comps 40 comps
| Address | Beds | Baths | Sqft | Rent | $/sqft | DOM | Units | Dist |
|---|---|---|---|---|---|---|---|---|
| 937 Michigan Ave Unit 1540444P Miami Beach, FL | 3.0 | 3.0 | — | $18,194 | — | 24d | 1 | 0.26mi |
| 602 Collins Ave #602 Miami Beach, FL | 3.0 | 3.0 | 1928 | $23,000 | $11.93 | 24d | 1 | 0.30mi |
| 1330 Ocean Dr Unit R7C Miami Beach, FL | 2.0 | 2.5 | 1720 | $18,500 | $10.76 | 24d | 1 | 0.40mi |
| 500 Alton Rd #3905 Miami Beach, FL | 3.0 | 3.5 | 1990 | $24,950 | $12.54 | 24d | 1 | 0.56mi |
| 500 Alton Rd #3704 Miami Beach, FL | 2.0 | 2.5 | 1434 | $19,000 | $13.25 | 24d | 1 | 0.56mi |
| 500 Alton Rd #2702 Miami Beach, FL | 3.0 | 3.5 | 2930 | $39,000 | $13.31 | 24d | 1 | 0.56mi |
| 501 West Ave #3404 Miami Beach, FL | 2.0 | 2.5 | 1434 | $22,500 | $15.69 | 24d | 1 | 0.57mi |
| 1455 Ocean Dr Miami Beach, FL | 2.0–3.0 | 2.5–4.5 | 1975 | $19,900 | $10.08 | 3d | 2 | 0.58mi |
| 1500 Ocean Dr #1202 Miami Beach, FL | 3.0 | 3.5 | 2320 | $20,000 | $8.62 | 22d | 1 | 0.60mi |
| 400 Alton Rd #1506 Miami Beach, FL | 3.0 | 3.0 | 2024 | $28,795 | $14.23 | 4d | 1 | 0.64mi |
| 400 Alton Rd Miami Beach, FL | 2.0–3.0 | 2.5–3.0 | 2103 | $27,000 | $12.84 | 22d | 2 | 0.64mi |
| 1602 Meridian Ave Miami Beach, FL | 4.0 | 1.0–3.0 | 917 | $11,900 | $12.97 | 14d | 1 | 0.66mi |
| 101 Ocean Dr #907 Miami Beach, FL | 3.0 | 3.0 | 2717 | $35,000 | $12.88 | 24d | 1 | 0.72mi |
| 1561 Alton Ct Unit 1540456P Miami Beach, FL | 3.0 | 3.0 | — | $19,898 | — | 22d | 1 | 0.75mi |
| 1 Collins Ave #602 Miami Beach, FL | 3.0 | 3.5 | 1928 | $23,000 | $11.93 | 2d | 1 | 0.77mi |
| 12 Collins Ave Unit 1540558P Miami Beach, FL | 3.0 | 1.0 | — | $34,190 | — | 22d | 1 | 0.78mi |
| 1000 S Pointe Dr #904 Miami Beach, FL | 3.0 | 3.0 | 2190 | $19,000 | $8.68 | 24d | 1 | 0.81mi |
| 50 S Pointe Dr Unit LOFT5 Miami Beach, FL | 3.0 | 3.5 | 1546 | $22,500 | $14.55 | 2d | 1 | 0.84mi |
| 50 S Pointe Dr Unit TWN1 Miami Beach, FL | 3.0 | 3.5 | 2478 | $32,000 | $12.91 | 24d | 1 | 0.84mi |
| 50 S Pointe Dr Miami Beach, FL | 2.0–3.0 | 2.0–4.5 | 2236 | $20,000 | $8.94 | 21d | 4 | 0.84mi |
| 50 S Pointe Dr Miami Beach, FL | 2.0–3.0 | 2.5–4.5 | 2236 | $20,000 | $8.94 | 18d | 3 | 0.84mi |
| 50 S Pointe Dr Miami Beach, FL | 2.0–3.0 | 2.0–4.5 | 2236 | $20,000 | $8.94 | 3d | 6 | 0.84mi |
| 300 S Pointe Dr #3502 Miami Beach, FL | 3.0 | 2.5 | 1960 | $21,000 | $10.71 | 3d | 1 | 0.85mi |
| 300 S Pointe Dr Miami Beach, FL | 2.0–3.0 | 2.5 | 2000 | $18,000 | $9.00 | 3d | 2 | 0.85mi |
| 100 S Pointe Dr Miami Beach, FL | 3.0 | 3.5 | 1870 | $27,000 | $14.44 | 24d | 1 | 0.89mi |
| 100 S Pointe Dr #604 Miami Beach, FL | 3.0 | 3.0 | 2292 | $22,500 | $9.82 | 24d | 1 | 0.96mi |
| 100 S Pointe Dr #2506 Miami Beach, FL | 1.0 | 2.5 | 1870 | $23,000 | $12.30 | 24d | 1 | 0.96mi |
| 100 S Pointe Dr #2806 Miami Beach, FL | 2.0 | 2.5 | 1870 | $30,000 | $16.04 | 12d | 1 | 0.96mi |
| 100 S Pointe Dr #1807 Miami Beach, FL | 2.0 | 2.5 | 1870 | $25,000 | $13.37 | 3d | 1 | 0.96mi |
| 100 S Pointe Dr #1608 Miami Beach, FL | 2.0 | 2.5 | 1757 | $19,000 | $10.81 | 8d | 1 | 0.96mi |
| 100 S Pointe Dr #610 Miami Beach, FL | 3.0 | 3.0 | 2122 | $20,000 | $9.43 | 24d | 1 | 0.96mi |
| 100 S Pointe Dr #1807 Miami Beach, FL | 2.0 | 2.5 | 1870 | $25,000 | $13.37 | 24d | 1 | 0.96mi |
| 100 S Pointe Dr #708 Miami Beach, FL | 2.0 | 2.5 | 1757 | $22,000 | $12.52 | 8d | 1 | 0.96mi |
| 100 S Pointe Dr Unit TH13 Miami Beach, FL | 3.0 | 3.5 | 2202 | $22,000 | $9.99 | 24d | 1 | 0.96mi |
| 100 S Pointe Dr #3701 Miami Beach, FL | 2.0 | 2.5 | 1940 | $24,000 | $12.37 | 17d | 1 | 0.96mi |
| 100 S Pointe Dr #1608 Miami Beach, FL | 2.0 | 2.5 | 1757 | $18,000 | $10.24 | 15d | 1 | 0.96mi |
| 100 S Pointe Dr #2101 Miami Beach, FL | 2.0 | 2.5 | 1591 | $21,000 | $13.20 | 24d | 1 | 0.96mi |
| 100 S Pointe Dr #708 Miami Beach, FL | 2.0 | 2.5 | 1757 | $22,000 | $12.52 | 24d | 1 | 0.96mi |
| 16 Island Ave Unit 6B Miami Beach, FL | 2.0 | 2.5 | 1770 | $20,000 | $11.30 | 24d | 1 | 1.07mi |
| 101 20th St Miami Beach, FL | 2.0–3.0 | 2.0–3.0 | 1867 | $20,000 | $10.71 | 22d | 5 | 1.13mi |
Listing history 21 events
-
2026-06-18days on market $3,450,000 Active 69 DOM
-
2026-06-17days on market $3,450,000 Active 68 DOM
-
2026-06-16days on market $3,450,000 Active 67 DOM
-
2026-06-15days on market $3,450,000 Active 66 DOM
-
2026-06-13days on market $3,450,000 Active 64 DOM
-
2026-06-09days on market $3,450,000 Active 60 DOM
-
2026-06-08days on market $3,450,000 Active 59 DOM
-
2026-06-07days on market $3,450,000 Active 58 DOM
-
2026-06-04days on market $3,450,000 Active 55 DOM
-
2026-06-03days on market $3,450,000 Active 54 DOM
-
2026-06-02days on market $3,450,000 Active 53 DOM
-
2026-06-01days on market $3,450,000 Active 52 DOM
-
2026-05-31days on market $3,450,000 Active 51 DOM
-
2026-05-22price $3,450,000
-
2026-03-14$1,795
-
2026-02-02$3,499,000 Active
-
2022-03-16price $2,495
-
2019-05-29historical
-
2019-05-28$3,695,000
-
2018-11-26historical
-
2018-11-21$3,895,000 Active
ⓘ Source: listings_history table (triggers on properties + properties_extension) + one-shot
backfill from property_details.listing_events for pre-trigger history.
Nearby sold comps map
Loading sold comps map…
Walkable amenities ~0.75 mi
Loading nearby amenities…
Taxation est. · year 1
- Rental income
- $1,231,608
- − Mortgage interest
- −$193,254
- − Property taxes
- −$51,750
- − Insurance
- −$17,250
- − Repairs & maintenance
- −$98,529
- − Management
- −$98,529
- − Depreciation
- −$100,364
- Taxable income
- $671,933
- Est. tax owed @ 24.0%
- −$161,264
- After-tax cash flow
- $525,600/yr
For passive investors: Depreciation is non-cash, so a rental often shows a tax loss while cash-flowing — sheltering income. Rental losses are passive: they offset passive income freely, and up to $25,000/yr can offset ordinary (W-2) income if you actively participate and your MAGI is under $100k (phasing out to $0 by $150k); unused losses carry forward. On sale, claimed depreciation is recaptured at up to 25%, and gains may owe capital-gains tax (a 1031 exchange can defer both). Figures are a year-1 estimate at your 24.0% rate — not tax advice; consult a CPA.
Schools (NCES district)
- District
- Miami-Dade
- NCES district ID
- 1200390
- Math proficiency
- 45% ▼ -16.00%
- Reading proficiency
- 54% ▼ -5.00%
- Median HH income
- $43,928
- Composite
- 41.76/100
- National rank
- #3397
- State rank
- #40 of 73 in FL
Livability — Miami Beach
- Score
- 80/100
- State rank
- #108
- US rank
- #1672
Category grades
Schools grade is shown separately in the Schools card above.
Census & demographics
- Census place
- Miami Beach, FL
- County
- Miami-Dade County · 2,697,751 people
- City population
- 90,533
- Metro
- Miami-Fort Lauderdale-Pompano Beach, FL
- Population (ZIP)
- 33,753
- Household income
- $69,793
- Rent vs Own
- Severe rent burden
- 4052.0
Population outlook (Miami-Dade County) Hauer SSP2
- Today (2025)
- 3,126,439 people
- By 2030
- 3,325,765 · +6.4%
- By 2040
- 3,697,561 · +18.3%
- By 2050
- 4,012,134 · +28.3%
- By 2075
- 4,605,612 · +47.3%
- By 2100
- 4,866,598 · +55.7%
Race, ethnicity, and origin ACS 2023
- Neighborhood character
- Diverse neighborhood (Simpson 0.58)
- Race & ethnicity
- Hispanic / Latino 51% White 40% Two or more races 17% Black 4% Asian 3%
- Hispanic origin (detail)
- Mexican 2% Puerto Rican 2% Cuban 15% Salvadoran 3%
- Common ancestry
- Lithuanian 3% Scotch-Irish 2% Romanian 2%
- Foreign-born
- 56% · Canada, Jamaica, Dominican Republic
- Languages at home
- 37% English-only · Spanish 49% Other Indo-European 5% French/Haitian/Cajun 3%
Political lean MEDSL · Miami-Dade
- 2024 margin
- R (+11.4) · D 43.9% · R 55.4%
- 2008→2024 swing
- -27.6pp toward R · 2008: 16.1pp · 2024: -11.4pp
- All cycles
- 2024: R+11.4 2020: D+7.3 2016: D+29.6 2012: D+23.7 2008: D+16.1
Not yet ingested
- Civics
- —
Market trends
- HPI YoY
- ▼ -2.19%
- Current HPI
- 277.9321
- Rent YoY
- ▼ -0.36%
- Metro
- Miami-Fort Lauderdale-Pompano Beach, FL
- State GDP YoY
- ▲ 3.28%
- F500 in state
- 36
Industry mix (Fortune 500 HQ in FL)
| Industry | F500 HQs | Revenue |
|---|---|---|
| Industrial Technology | 2 | $29B |
|
||
| Insurance | 2 | $17B |
|
||
| Retail | 1 | $60B |
|
||
| Technology Distribution | 1 | $58B |
|
||
| Homebuilding | 1 | $35B |
|
||
| Technology Manufacturing | 1 | $35B |
|
||
Price history
-11.4% since first listed8 events — show timeline
- 2026-05-22 Price Changed $3,450,000 MARMLS
- 2026-03-14 Listed for Rent $1,795 SHOWMOJO
- 2026-02-02 Listed $3,499,000 MARMLS
- 2022-03-16 Price Changed $2,495 RENT.
- 2019-05-29 Listing Removed — MARMLS
- 2019-05-28 Listed $3,695,000 MARMLS
- 2018-11-26 Listing Removed — MARMLS
- 2018-11-21 Listed $3,895,000 MARMLS
Cash-flow waterfall
monthlySold comps — $/sqft
last 12 mo · ≤1 miLoading sold comps…