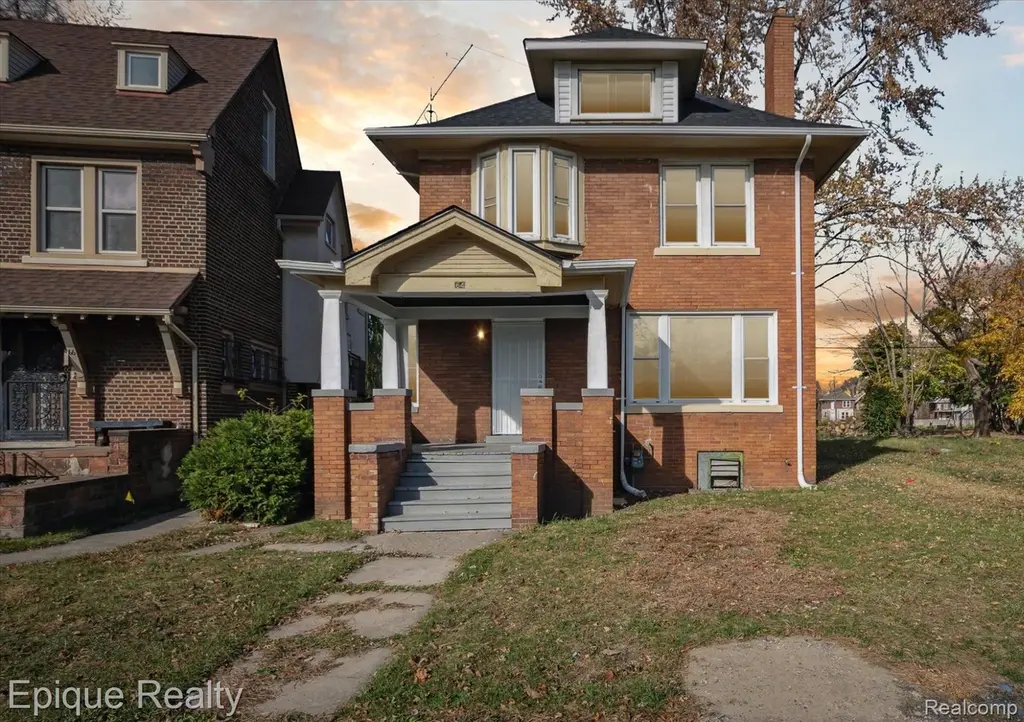
64 Glendale St · Highland Park, MI
Flood risk 1/10 · Minimal
- FEMA flood zone
- X (unshaded)
- Chance of flooding over 30 yrs
- 0.0%
- Est. flood insurance / yr
- $473 – $860
Fire risk 1/10 · Minimal
- Est. fire insurance / yr
- $784 – $1,456
Heat risk 3/10 · Minor
- Hot days now (above 96°F)
- 7 days/yr
- Hot days in 30 yrs
- 15 days/yr
Wind risk 2/10 · Minimal
- Chance of severe wind over 30 yrs
- —
Air-quality risk 4/10 · Minor
- Unhealthy air days now
- 4 days/yr
- Unhealthy air days in 30 yrs
- 6 days/yr
Risk factors via First Street. Map © Google.
Why this score? — see what drove the C+ grade
The composite is a weighted blend of 9 inputs, each scored 0–100. Each bar is that input's sub-score; the figure is the points it added to the 100-point composite (weight × sub-score).
- Cash flow +25.3/30.0
- DSCR +8.3/10.0
- ARV discount +7.5/15.0
- 1% rule +6.7/10.0
- Schools +5.0/10.0
- Livability +3.7/5.0
- Rent growth +2.5/5.0
- Condition / age +2.5/5.0
- Appreciation +0.0/10.0
$135,000
🖨 Deal sheet 📄 Offer letter ✓ Due diligence
Listing remarks MLS
4 Bed 1 bath with new vinyl plank flooring. Spacious with a great location to Woodward! Set back on a half-circle drive offers a quiet environment for the family. Do not disturb occupants.
Key facts
- Quiet environment
- 6,098 sq ft lot
- Built 1913
Tags
Neighborhood map
What this means for you Summary
Snapshot
- This is a 4-bed/1.5-bath single-family listed at $135k.
Deal economics
- At list price, monthly cash flow is $307 ($4k/yr) — positive.
- The deal already cash-flows at list — no discount required.
- Meets the 1% rule at list price ($2k rent vs $135k).
- Recommended offer: $127k (6.0% below list) — sets the bar for market timing.
- Cap rate 9.0% vs local median 14.2% in Highland Park — below-typical yield; the buyer is paying a premium for something (appreciation thesis, condition, location) that the cap rate doesn't capture.
Location & tenants
- Location reads 73/100 on livability (#214 in MI) — a middle-class / working-renter tenant base. Strengths: commute A+, cost of living A+, housing A+; Watch: schools F, crime F, employment F.
- Market conditions: 216 active listings in the ZIP; 19 comparable units currently listed for rent nearby; rentals at typical pace (median 18d on market — plan ~3-4 weeks tenant-placement turnaround); lower-income renter base — watch delinquency; 2,639 units permitted in Wayne County in 2024 (1,216 in 5+ unit buildings).
- At $1,575/mo this rent would consume 49% of the median local household income ($38k/yr) (locally 1192% of renters already pay >50% of income on rent) — very limited rent-growth headroom before tenants either downsize or default.
Forward outlook
- Local home prices are declining (-3.0%/yr); year-one equity from $933 of loan paydown is wiped out by about $4k of value loss. Plan a longer hold.
- Wayne County population projected at -17% by 2050 — secular population decline; favor cash flow + early exit over multi-decade hold.
Negotiation context
- It's been on market 68 days — a 6% lower offer ($127k) is reasonable based on typical stale-listing flexibility.
- 14 sale attempts since 21y ago; this cycle's ask has dropped $10k (7%) from the opening price — seller is motivated, your offer sets the floor, not the list.
- Current owner paid $37k; list at $135k implies a 265% gain — meaningful room to come down on a strong offer.
Risks & watch-outs
- Watch-outs: built in 1913 — expect roof / HVAC / electrical / plumbing capex.
Questions for the listing agent
- It's been on market 68 days. Have you received any prior offers? Is the seller open to a 6% concession, seller financing, or rate buy-down credit?
- Built in 1913 — when were the roof, HVAC, electrical panel, plumbing, and water heater last replaced?
- Why hasn't it sold? Are there any deal-killer items the seller is aware of (foundation, flood, title, zoning, code violations)?
- Is there a deadline driving the sale (1031 exchange, divorce, estate, relocation)? That informs how much negotiation room exists.
- Schools are F-rated, which usually means shorter tenancies and higher turnover. Who's the typical renter profile here, and what's been the actual vacancy rate?
- Crime grade is F in this area — have there been break-ins, vandalism, or insurance claims at this property in the last 3 years? What carrier currently insures it and at what premium?
- What's the average days-on-market for RENTAL listings here right now (not sales)? A rising rental-DOM trend means longer vacancies and softer asking-rent achievability than the comps imply.
- What's the recent tenant-quality profile in this submarket — average credit score on applications, eviction rate, late-payment / NSF rate, and stable-employment percentage? A property-management company in the area should have these aggregated.
- How much new for-sale + rental construction is in the pipeline within 1–3 miles? Heavy new supply typically softens prices + rents 12–24 months out; constrained supply supports both.
Investment metrics
- 1% rule
- 1.17% ✓
- Cap rate
- 9.02%
- Cash-on-cash
- 9.74%
- DSCR
- 1.43
- GRM
- 7.1
CMA / ARV
- ARV (median comp)
- $70,400
- List price
- $135,000
- Delta
- 91.76%
- Verdict
- OVERPRICED
- Comps
- 20 within 1.0 mi
Show comp detail 12 sales within ~0.75 mi
| Address | Dist | Beds/Ba | Sqft | Sold | Price | $/sf | Match |
|---|---|---|---|---|---|---|---|
| 213 Avalon St | 0.28mi | 3/2.5 (-1) | 1,404 (-4%) | 1mo | $139,000 | $99 | 70 |
| 225 Farrand Park | 0.57mi | 3/1.0 (-1) | 1,458 (-0%) | 2mo | $20,000 | $14 | 64 |
| 134 Tyler St | 0.22mi | 4/1.0 | 1,280 (-13%) | 4mo | $28,000 | $22 | 63 |
| 202 Farrand Park | 0.52mi | 3/1.0 (-1) | 1,482 (+1%) | 4mo | $40,000 | $27 | 63 |
| 219 Waverly St | 0.37mi | 3/1.0 (-1) | 1,557 (+6%) | 6mo | $145,000 | $93 | 60 |
| 189 Tuxedo St | 0.54mi | 3/1.0 (-1) | 1,425 (-3%) | 4mo | $25,000 | $18 | 60 |
| 535 Woodland St | 0.73mi | 3/2.0 (-1) | 1,472 (+0%) | 2mo | $170,000 | $115 | 56 |
| 193 Massachusetts St | 0.56mi | 3/1.5 (-1) | 1,548 (+6%) | 4mo | $59,900 | $39 | 56 |
| 207 Connecticut St | 0.65mi | 3/1.0 (-1) | 1,472 (+0%) | 9mo | $35,000 | $24 | 54 |
| 194 Farrand Park | 0.51mi | 4/2.0 | 1,610 (+10%) | 5mo | $189,000 | $117 | 53 |
| 1568 Highland St | 0.72mi | 4/2.0 | 1,344 (-8%) | 6mo | $65,000 | $48 | 46 |
| 227 Massachusetts St | 0.62mi | 4/2.0 | 1,664 (+14%) | 7mo | $130,000 | $78 | 40 |
Match score weights: distance 35% · size 25% · config 20% · recency 20%. Top-matched comps best support the ARV.
Projected returns pro-forma
-3.0% appreciation · 3.0% rent growth · sell at horizon
- IRR
- -1.6%
- Equity multiple
- 0.94×
- Total profit
- $-2,310
- Equity at exit
- $20,129
- IRR
- 8.1%
- Equity multiple
- 1.62×
- Total profit
- $23,258
- Equity at exit
- $11,672
Cash invested: $37,800 (down + closing). Projections, not guarantees.
Landlord ↔ Tenant lean methodology
- Overall (STATE)
- 62 Landlord-Friendly
- State Michigan
- 62 Landlord-Friendly · EVEN
- County
- — inherits STATE
- City
- — inherits STATE
ZIP-level market 48203
- Home prices YoY
- -23.3%
- Active inventory
- 216
- Price-to-rent
- 7.1×
Monthly cashflow live
- Estimated rent
- $1,575 high interval (Pro) →
- Mortgage (P&I)
- −$708
- Tax from tax record
- −$174 /mo · $2,082/yr
- Insurance
- −$56
- HOA
- −$0
- Vacancy / Maint / Mgmt
- −$331
- Net cashflow
- $307
Break-even live
UW: 25.0% down · 7.5% · 30yr · 1.5% tax · 5.0% vac · 8.0% maint · 8.0% mgmt
Financing live
Cash to close
- Down payment
- $33,750
- Closing costs
- $4,050
- Reserves months
- —
- Total cash needed
- —
Loan-product check · same deal, 3 products live
Conventional
25% down · 7.5% · 30yr
- Down + closing
- —
- Monthly P&I
- —
- Monthly cashflow
- —
- DSCR
- —
- Eligible?
- —
Personal DTI + credit; lowest rate.
DSCR
20% down · 8.5% · 30yr
- Down + closing
- —
- Monthly P&I
- —
- Monthly cashflow
- —
- DSCR
- —
- Eligible?
- —
No personal income docs; deal must DSCR.
Hard money
10% down · 12.0% · 12mo
- Down + closing
- —
- Monthly P&I
- —
- Monthly cashflow
- —
- DSCR
- —
- Eligible?
- —
Short-term bridge; refi at stabilization.
Rent comps 19 comps
| Address | Beds | Baths | Sqft | Rent | $/sqft | DOM | Units | Dist |
|---|---|---|---|---|---|---|---|---|
| 64 Glendale St Highland Park, MI | 4.0 | 1.0 | 1464 | $1,500 | $1.02 | 10d | 1 | 0.02mi |
| 41 Richton St Highland Park, MI | 5.0 | 2.0 | 1871 | $1,800 | $0.96 | 15d | 1 | 0.30mi |
| 41 Richton St Highland Park, MI | 5.0 | 2.0 | 1871 | $1,800 | $0.96 | 2d | 1 | 0.30mi |
| 101 Colorado St Unit NA Highland Park, MI | 4.0 | 1.5 | 1695 | $1,500 | $0.88 | 24d | 1 | 0.33mi |
| 165 Rhode Island St Highland Park, MI | 4.0 | 1.5 | 1639 | $1,200 | $0.73 | 17d | 1 | 0.47mi |
| 168 Beresford St Highland Park, MI | 4.0 | 1.0 | 1541 | $1,475 | $0.96 | 17d | 1 | 0.49mi |
| 520 Englewood St Detroit, MI | 4.0 | 1.5 | 1086 | $1,725 | $1.59 | 24d | 1 | 0.78mi |
| 1427 Calvert Ave Detroit, MI | 3.0 | 1.0 | 1100 | $1,750 | $1.59 | 44d | 1 | 1.01mi |
| 1427 Calvert Ave Detroit, MI | 3.0 | 1.0 | 1100 | $1,850 | $1.68 | 24d | 1 | 1.01mi |
| 1926 Clements St Detroit, MI | 3.0 | 1.0 | 1150 | $1,150 | $1.00 | 5d | 1 | 1.01mi |
| 1926 Clements St Unit 1926 Detroit, MI | 3.0 | 1.0 | 1150 | $1,250 | $1.09 | 20d | 1 | 1.01mi |
| 613 Belmont St Detroit, MI | 3.0 | 1.0 | 1100 | $1,350 | $1.23 | 18d | 1 | 1.01mi |
| 9844 Woodrow Wilson St Detroit, MI | 3.0 | 1.0 | 1187 | $1,300 | $1.10 | 12d | 1 | 1.14mi |
| 505 Westminster St Detroit, MI | 3.0 | 1.0 | 1700 | $1,400 | $0.82 | 17d | 1 | 1.19mi |
| 1929 Calvert Ave Unit 2 Detroit, MI | 3.0 | 1.0 | 1414 | $1,199 | $0.85 | 15d | 1 | 1.24mi |
| 101 Stevens St Highland Park, MI | 3.0 | 1.5 | 1152 | $1,600 | $1.39 | 17d | 1 | 1.28mi |
| 156 Leicester Ct Apt 2 Detroit, MI | 3.0 | 1.0 | 1000 | $1,250 | $1.25 | 44d | 1 | 1.29mi |
| 2474 Fullerton St Detroit, MI | 3.0 | 1.0 | 1400 | $1,300 | $0.93 | 15d | 1 | 1.30mi |
| 326 Eason St Highland Park, MI | 3.0 | 1.0 | 1256 | $1,300 | $1.04 | 17d | 1 | 1.34mi |
Listing history 43 events
-
2026-06-09days on market $135,000 Active 68 DOM
-
2026-06-08days on market $135,000 Active 67 DOM
-
2026-06-07days on market $135,000 Active 66 DOM
-
2026-06-04days on market $135,000 Active 63 DOM
-
2026-06-03days on market $135,000 Active 62 DOM
-
2026-06-02days on market $135,000 Active 61 DOM
-
2026-06-01days on market $135,000 Active 60 DOM
-
2026-05-31days on market $135,000 Active 59 DOM
-
2026-04-28price $135,000 188-char remark
Show marketing remark (188 chars)
4 Bed 1 bath with new vinyl plank flooring. Spacious with a great location to Woodward! Set back on a half-circle drive offers a quiet environment for the family. Do not disturb occupants.
-
2026-04-28price $135,000 188-char remark
Show marketing remark (188 chars)
4 Bed 1 bath with new vinyl plank flooring. Spacious with a great location to Woodward! Set back on a half-circle drive offers a quiet environment for the family. Do not disturb occupants.
-
2026-04-02$145,000 Active 188-char remark
Show marketing remark (188 chars)
4 Bed 1 bath with new vinyl plank flooring. Spacious with a great location to Woodward! Set back on a half-circle drive offers a quiet environment for the family. Do not disturb occupants.
-
2026-04-02$145,000 Active 188-char remark
Show marketing remark (188 chars)
4 Bed 1 bath with new vinyl plank flooring. Spacious with a great location to Woodward! Set back on a half-circle drive offers a quiet environment for the family. Do not disturb occupants.
-
2026-04-01$1,500
-
2025-03-06historical $1,500
-
2024-11-13$1,500
-
2024-08-23soldstatus $37,000 Sold
-
2024-08-23soldstatus $37,000 Closed
-
2024-08-14status Pending
-
2024-08-14status Pending
-
2024-07-11historical Accepting Backup Offers
-
2024-07-11historical Accepting Backup Offers
-
2024-06-10$47,500 Active
-
2024-06-10$47,500 Active
-
2024-06-03historical $47,500
-
2024-06-03historical $47,500
-
2012-10-02soldstatus $8,000
-
2012-10-01soldstatus $8,000
-
2012-09-27historical
-
2012-09-10$8,000
-
2012-09-10$8,000
-
2012-09-10historical
-
2012-09-10historical
-
2012-08-14$9,100
-
2012-08-13historical
-
2012-08-13historical
-
2012-08-13historical
-
2012-08-10$9,100
-
2011-11-11$10,000
-
2011-09-26$10,000
-
2011-09-26$10,000
-
2006-01-18soldstatus $70,000
-
2005-07-22historical
-
2005-04-18$79,000
ⓘ Source: listings_history table (triggers on properties + properties_extension) + one-shot
backfill from property_details.listing_events for pre-trigger history.
Tax reassessment forecast MI · Partial reset (capped growth)
- Current annual tax
- $2,082 · $174/mo
- Projected year-2 tax
- $2,082 · $174/mo
- Expected delta
- $0/yr ($0/mo · 0.0%)
ⓘ Screening estimate from a state-policy table — verify with the county assessor before closing.
Climate risk First Street
- Flood 1/10 Low FEMA zone X (unshaded) · 0% chance over 30 yrs
- Wildfire 1/10 Low
- Heat 3/10 Moderate 7 d/yr ≥96°F today · 15 d/yr by 30 yrs out
- Wind 2/10 Low
- Air quality 4/10 Moderate 4 unhealthy d/yr today · 6 by 30 yrs out
Nearby sold comps map
Loading sold comps map…
Walkable amenities ~0.75 mi
Loading nearby amenities…
Taxation est. · year 1
- Rental income
- $18,904
- − Mortgage interest
- −$7,562
- − Property taxes
- −$2,082
- − Insurance
- −$675
- − Repairs & maintenance
- −$1,512
- − Management
- −$1,512
- − Depreciation
- −$3,927
- Taxable income
- $1,633
- Est. tax owed @ 24.0%
- −$392
- After-tax cash flow
- $3,290/yr
For passive investors: Depreciation is non-cash, so a rental often shows a tax loss while cash-flowing — sheltering income. Rental losses are passive: they offset passive income freely, and up to $25,000/yr can offset ordinary (W-2) income if you actively participate and your MAGI is under $100k (phasing out to $0 by $150k); unused losses carry forward. On sale, claimed depreciation is recaptured at up to 25%, and gains may owe capital-gains tax (a 1031 exchange can defer both). Figures are a year-1 estimate at your 24.0% rate — not tax advice; consult a CPA.
Schools (NCES district)
No district data.
Livability — Highland Park
- Score
- 73/100
- State rank
- #214
- US rank
- #5271
Category grades
Schools grade is shown separately in the Schools card above.
Census & demographics
- Census place
- Highland Park, MI
- County
- Wayne County · 1,562,939 people
- Metro
- Detroit-Warren-Dearborn, MI
- Population (ZIP)
- 20,049
- Household income
- $38,404
- Rent vs Own
- Severe rent burden
- 1192.0
Population outlook (Wayne County) Hauer SSP2
- Today (2025)
- 1,675,273 people
- By 2030
- 1,620,300 · -3.3%
- By 2040
- 1,502,341 · -10.3%
- By 2050
- 1,384,039 · -17.4%
- By 2075
- 1,124,592 · -32.9%
- By 2100
- 881,193 · -47.4%
Race, ethnicity, and origin ACS 2023
- Neighborhood character
- Predominantly Black (85%)
- Race & ethnicity
- Black 85% White 8% Two or more races 5% Hispanic / Latino 2%
- Common ancestry
- Lithuanian 1%
- Foreign-born
- 2% · Canada
- Languages at home
- 95% English-only · Spanish 3% French/Haitian/Cajun 1%
Political lean MEDSL · Wayne
- 2024 margin
- Strong D (+29.0) · D 62.7% · R 33.7% · Other 3.6%
- 2008→2024 swing
- -20.5pp toward R · 2008: 49.5pp · 2024: 29.0pp
- All cycles
- 2024: D+29.0 2020: D+38.1 2016: D+37.3 2012: D+46.9 2008: D+49.5
Not yet ingested
- Civics
- —
Market trends
- HPI YoY
- ▼ -90.13%
- Current HPI
- 297.0176
- Rent YoY
- —
- Metro
- Detroit-Warren-Dearborn, MI
- State GDP YoY
- ▲ 1.37%
- F500 in state
- 28
Industry mix (Fortune 500 HQ in MI)
| Industry | F500 HQs | Revenue |
|---|---|---|
| Automotive Parts | 3 | $48B |
|
||
| Automotive | 2 | $372B |
|
||
| Chemicals | 1 | $45B |
|
||
| Automotive Retail | 1 | $29B |
|
||
| Healthcare / Medical Devices | 1 | $23B |
|
||
| Automotive Technology | 1 | $20B |
|
||
Price history
+70.9% since first listed35 events — show timeline
- 2026-04-28 Price Changed $135,000 MiRealSource-MiMLS
- 2026-04-28 Price Changed $135,000 REALCOMP
- 2026-04-02 Listed $145,000 REALCOMP
- 2026-04-02 Listed $145,000 MiRealSource-MiMLS
- 2026-04-01 Listed for Rent $1,500 APPFOLIO
- 2025-03-06 Rental Removed $1,500 APPFOLIO
- 2024-11-13 Listed for Rent $1,500 APPFOLIO
- 2024-08-23 Sold (MLS) $37,000 MiRealSource-MiMLS
- 2024-08-23 Sold (MLS) $37,000 REALCOMP
- 2024-08-14 Pending — MiRealSource-MiMLS
- 2024-08-14 Pending — REALCOMP
- 2024-07-11 Contingent — MiRealSource-MiMLS
- 2024-07-11 Contingent — REALCOMP
- 2024-06-10 Listed $47,500 MiRealSource-MiMLS
- 2024-06-10 Listed $47,500 REALCOMP
- 2024-06-03 Coming Soon $47,500 REALCOMP
- 2024-06-03 Coming Soon $47,500 MiRealSource-MiMLS
- 2012-10-02 Sold (MLS) $8,000 MiRealSource-MiMLS
- 2012-10-01 Sold (MLS) $8,000 REALCOMP
- 2012-09-27 Listing Removed — MiRealSource-MiMLS
- 2012-09-10 Listing Removed — REALCOMP
- 2012-09-10 Listing Removed — MiRealSource-MiMLS
- 2012-09-10 Listed $8,000 REALCOMP
- 2012-09-10 Listed $8,000 MiRealSource-MiMLS
- 2012-08-14 Listed $9,100 REALCOMP
- 2012-08-13 Listing Removed — REALCOMP
- 2012-08-13 Listing Removed — MiRealSource-MiMLS
- 2012-08-13 Listing Removed — MiRealSource-MiMLS
- 2012-08-10 Listed $9,100 MiRealSource-MiMLS
- 2011-11-11 Listed $10,000 MiRealSource-MiMLS
- 2011-09-26 Listed $10,000 REALCOMP
- 2011-09-26 Listed $10,000 MiRealSource-MiMLS
- 2006-01-18 Sold (Public Records) $70,000 Public Records
- 2005-07-22 Listing Removed — REALCOMP
- 2005-04-18 Listed $79,000 REALCOMP
Property tax history
+2.6%/yrLatest (2025): $2,082 · +102.1% YoY. Source: county tax records.
Cash-flow waterfall
monthlySold comps — $/sqft
last 12 mo · ≤1 miLoading sold comps…