116 Spoon Bill Ct · Virginia Beach, VA
Flood risk No data
- FEMA flood zone
- —
- Chance of flooding over 30 yrs
- —
- Est. flood insurance / yr
- —
Fire risk No data
- Est. fire insurance / yr
- —
Heat risk No data
- Hot days now (above threshold)
- —
- Hot days in 30 yrs
- —
Wind risk No data
- Chance of severe wind over 30 yrs
- —
Air-quality risk No data
- Unhealthy air days now
- —
- Unhealthy air days in 30 yrs
- —
Risk factors via First Street. Map © Google.
Why this score? — see what drove the A- grade
The composite is a weighted blend of 9 inputs, each scored 0–100. Each bar is that input's sub-score; the figure is the points it added to the 100-point composite (weight × sub-score).
- Cash flow +30.0/30.0
- 1% rule +10.0/10.0
- DSCR +10.0/10.0
- Appreciation +7.9/10.0
- ARV discount +7.5/15.0
- Schools +4.2/10.0
- Livability +4.2/5.0
- Condition / age +3.8/5.0
- Rent growth +2.5/5.0
$35,000
🖨 Deal sheet 📄 Offer letter ✓ Due diligence
Listing remarks
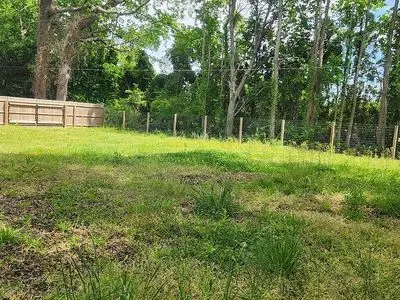
This beautifully updated 780 sq. ft. home offers affordable living. Located in a quiet community with a low lot rent of only $400 per month, this 2-bedroom, 1-bath residence is completely move-in ready. The interior has been fully revitalized with brand-new flooring, fresh paint, and updated doors throughout. Outside, you & acirc; & euro; & trade; ll find a rare and desirable partially private, fenced-in yard, providing a perfect sanctuary for pets, gardening, or outdoor relaxation. A sturdy wooden deck leads to the front entry, offering a lovely space for morning coffee. This is a fantastic opportunity to own a renovated, low-maintenance home. Buyer must be approved by park man
Key facts
- Sturdy wooden deck
Tags
Neighborhood map
What this means for you Summary
Snapshot
- This is a 2-bed/1.0-bath other listed at $35k. Condition is rated good.
Deal economics
- At list price, monthly cash flow is $673 ($8k/yr) — positive.
- The deal already cash-flows at list — no discount required.
- Meets the 1% rule at list price ($1k rent vs $35k).
- Cap rate 29.4% vs local median 3.5% in Virginia Beach — top-decile yield for the area; either an underpriced asset or a hidden risk that comps aren't pricing in. Stress-test before assuming the spread holds.
Location & tenants
- Location reads 83/100 on livability (#38 in VA, #880 nationally) — a professional / high-income tenant draw. Strengths: schools A+, amenities A+, employment A+; Watch: cost of living C-, commute F.
- Currituck County Schools (rural): math 45% / reading 51% proficiency, ranked #67 of 178 in NC (top 38%) — families likely to look elsewhere, expect single-tenant / working-renter base with shorter leases.
- Market conditions: 429 units permitted in Currituck County in 2024 (0 in 5+ unit buildings).
Forward outlook
- In year one you build about $2k of equity ($242 loan paydown + $2k appreciation (5.9% local appreciation)).
- Currituck County population projected at +23% by 2050 — long-run rental-demand tailwind backs the buy-and-hold thesis.
- At projected returns (5.9% appreciation + 3.0% rent growth), your $10k cash investment doubles in ~1 year — after that, you're playing with house money.
Negotiation context
- Only 1 days on market — expect competitive offers; lowballing is unlikely to land.
Questions for the listing agent
- Is there a deadline driving the sale (1031 exchange, divorce, estate, relocation)? That informs how much negotiation room exists.
- Schools are A-rated — typically a magnet for longer-tenancy family renters. What's the average tenant stay here, and is there a school-zone premium baked into asking?
- What's the average days-on-market for RENTAL listings here right now (not sales)? A rising rental-DOM trend means longer vacancies and softer asking-rent achievability than the comps imply.
- What's the recent tenant-quality profile in this submarket — average credit score on applications, eviction rate, late-payment / NSF rate, and stable-employment percentage? A property-management company in the area should have these aggregated.
- How much new for-sale + rental construction is in the pipeline within 1–3 miles? Heavy new supply typically softens prices + rents 12–24 months out; constrained supply supports both.
Investment metrics
- 1% rule
- 3.31% ✓
- Cap rate
- 29.38%
- Cash-on-cash
- 82.44%
- DSCR
- 4.67
- GRM
- 2.5
CMA / ARV
No comps found within radius.
Projected returns pro-forma
5.86% appreciation · 3.0% rent growth · sell at horizon
- IRR
- 89.0%
- Equity multiple
- 6.38×
- Total profit
- $52,705
- Equity at exit
- $21,686
- IRR
- 86.6%
- Equity multiple
- 13.41×
- Total profit
- $121,569
- Equity at exit
- $39,056
Cash invested: $9,800 (down + closing). Projections, not guarantees.
Landlord ↔ Tenant lean methodology
- Overall (STATE)
- 55 Moderately Landlord-Leaning
- State Virginia
- 55 Moderately Landlord-Leaning · D+2
- County
- — inherits STATE
- City
- — inherits STATE
ZIP-level market 27950
- Home prices YoY
- 1.8%
- Price-to-rent
- 2.5×
Monthly cashflow live
- Estimated rent
- $1,158 medium interval (Pro) →
- Mortgage (P&I)
- −$184
- Tax est. 1.5%
- −$44 /mo · $525/yr
- Insurance
- −$15
- HOA
- −$0
- Vacancy / Maint / Mgmt
- −$243
- Net cashflow
- $673
Break-even live
UW: 25.0% down · 7.5% · 30yr · 1.5% tax · 5.0% vac · 8.0% maint · 8.0% mgmt
Financing live
Cash to close
- Down payment
- $8,750
- Closing costs
- $1,050
- Reserves months
- —
- Total cash needed
- —
Loan-product check · same deal, 3 products live
Conventional
25% down · 7.5% · 30yr
- Down + closing
- —
- Monthly P&I
- —
- Monthly cashflow
- —
- DSCR
- —
- Eligible?
- —
Personal DTI + credit; lowest rate.
DSCR
20% down · 8.5% · 30yr
- Down + closing
- —
- Monthly P&I
- —
- Monthly cashflow
- —
- DSCR
- —
- Eligible?
- —
No personal income docs; deal must DSCR.
Hard money
10% down · 12.0% · 12mo
- Down + closing
- —
- Monthly P&I
- —
- Monthly cashflow
- —
- DSCR
- —
- Eligible?
- —
Short-term bridge; refi at stabilization.
Listing history 2 events
-
2026-05-13status Under Contract
-
2026-05-12$35,000 Active
ⓘ Source: listings_history table (triggers on properties + properties_extension) + one-shot
backfill from property_details.listing_events for pre-trigger history.
Nearby sold comps map
Loading sold comps map…
Walkable amenities ~0.75 mi
Loading nearby amenities…
Taxation est. · year 1
- Rental income
- $13,901
- − Mortgage interest
- −$1,961
- − Property taxes
- −$525
- − Insurance
- −$175
- − Repairs & maintenance
- −$1,112
- − Management
- −$1,112
- − Depreciation
- −$1,018
- Taxable income
- $7,998
- Est. tax owed @ 24.0%
- −$1,919
- After-tax cash flow
- $6,160/yr
For passive investors: Depreciation is non-cash, so a rental often shows a tax loss while cash-flowing — sheltering income. Rental losses are passive: they offset passive income freely, and up to $25,000/yr can offset ordinary (W-2) income if you actively participate and your MAGI is under $100k (phasing out to $0 by $150k); unused losses carry forward. On sale, claimed depreciation is recaptured at up to 25%, and gains may owe capital-gains tax (a 1031 exchange can defer both). Figures are a year-1 estimate at your 24.0% rate — not tax advice; consult a CPA.
Condition & rehab AI · 2 photos
This 780 sq. ft. home is move-in ready with a good condition score and minimal repairs needed. It offers a quiet community setting with a low maintenance yard and a partially private fenced-in area.
Value-add opportunities
- Both Painting the exterior — Enhances curb appeal and value
- Both Landscaping improvements — Enhances curb appeal and value
- Both Landscaping improvements — Enhances curb appeal and value
Renovation cost estimate screening
Value-add ROI direction
- Both Painting the exterior — Enhances curb appeal and value ↑
- Both Landscaping improvements — Enhances curb appeal and value ↑
- Both Landscaping improvements — Enhances curb appeal and value ↑
ⓘ Cost ranges are severity-bucket heuristics (US national rule-of-thumb). Get contractor quotes + a written scope before underwriting a rehab budget.
Schools (NCES district)
- District
- Currituck County Schools
- NCES district ID
- 3701080
- Math proficiency
- 45% ▲ 2.00%
- Reading proficiency
- 51% ▲ 5.00%
- Median HH income
- $58,898
- Composite
- 41.96/100
- National rank
- #3348
- State rank
- #67 of 178 in NC
Livability — Virginia Beach
- Score
- 83/100
- State rank
- #38
- US rank
- #880
Category grades
Schools grade is shown separately in the Schools card above.
Census & demographics
- City population
- 448,227
- Population (ZIP)
- 1,786
Population outlook (Currituck County) Hauer SSP2
- Today (2025)
- 28,690 people
- By 2030
- 30,311 · +5.7%
- By 2040
- 33,220 · +15.8%
- By 2050
- 35,405 · +23.4%
- By 2075
- 40,998 · +42.9%
- By 2100
- 44,117 · +53.8%
Race, ethnicity, and origin ACS 2023
- Neighborhood character
- Predominantly White (97%)
- Race & ethnicity
- White 97% Asian 2%
- Common ancestry
- Italian 2% Slovak 1% Serbian 1%
- Foreign-born
- 3% · South Korea
- Languages at home
- 99% English-only · German/W. Germanic 1% French/Haitian/Cajun 1%
Political lean MEDSL · Currituck
- 2024 margin
- Solid R (+47.9) · D 25.6% · R 73.5%
- 2008→2024 swing
- -16.4pp toward R · 2008: -31.5pp · 2024: -47.9pp
- All cycles
- 2024: R+47.9 2020: R+46.2 2016: R+49.8 2012: R+35.1 2008: R+31.5
Not yet ingested
- Civics
- —
Market trends
- HPI YoY
- ▲ 5.86%
- Current HPI
- 327.9432
- Rent YoY
- —
- Metro
- —
- State GDP YoY
- ▲ 2.40%
- F500 in state
- 50
Industry mix (Fortune 500 HQ in VA)
| Industry | F500 HQs | Revenue |
|---|---|---|
| Aerospace / Defense | 4 | $236B |
|
||
| Technology / Defense | 3 | $32B |
|
||
| Financial Services | 2 | $176B |
|
||
| Utilities | 2 | $27B |
|
||
| Insurance | 2 | $25B |
|
||
| Technology | 2 | $15B |
|
||
Price history
2 events — show timeline
- 2026-05-13 Pending — FSBO.com
- 2026-05-12 Listed $35,000 FSBO.com
Cash-flow waterfall
monthlySold comps — $/sqft
last 12 mo · ≤1 miLoading sold comps…