628 Bomar St · Houston, TX
Flood risk 1/10 · Minimal
- FEMA flood zone
- X (unshaded)
- Chance of flooding over 30 yrs
- 0.0%
- Est. flood insurance / yr
- $507 – $1,088
Fire risk 1/10 · Minimal
- Est. fire insurance / yr
- $1,222 – $2,270
Heat risk 9/10 · Severe
- Hot days now (above 109°F)
- 7 days/yr
- Hot days in 30 yrs
- 23 days/yr
Wind risk 9/10 · Severe
- Chance of severe wind over 30 yrs
- 99.0%
Air-quality risk 3/10 · Minor
- Unhealthy air days now
- 2 days/yr
- Unhealthy air days in 30 yrs
- 3 days/yr
Risk factors via First Street. Map © Google.
Why this score? — see what drove the C- grade
The composite is a weighted blend of 9 inputs, each scored 0–100. Each bar is that input's sub-score; the figure is the points it added to the 100-point composite (weight × sub-score).
- Cash flow +17.3/30.0
- ARV discount +15.0/15.0
- 1% rule +6.0/10.0
- DSCR +5.4/10.0
- Livability +3.7/5.0
- Schools +2.7/10.0
- Condition / age +2.5/5.0
- Rent growth +2.2/5.0
- Appreciation +0.0/10.0
$525,000
🖨 Deal sheet 📄 Offer letter ✓ Due diligence
Listing remarks
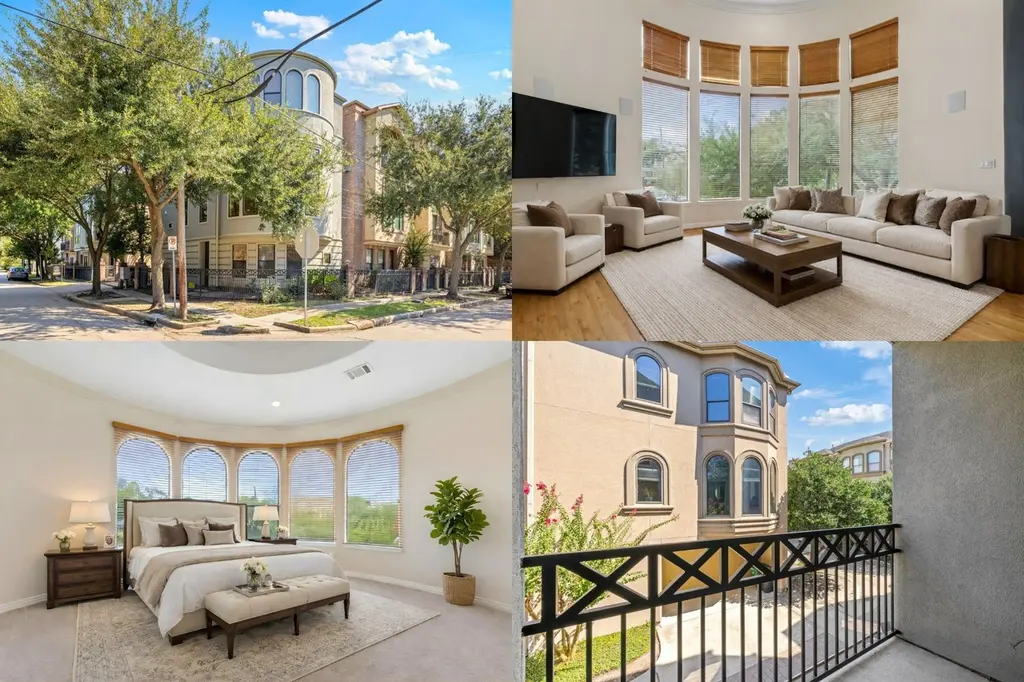
Welcome to 628 Bomar Street, a Montrose treasure blending timeless charm with thoughtful modern updates just minutes from downtown. Golden wood floors, abundant natural light, and sweeping skyline views create a warm, inviting atmosphere from the moment you enter. The open living and dining areas flow seamlessly into a beautifully refreshed kitchen featuring updated flooring, a new designer faucet, and top-of-the-line Bosch appliances. Step onto the private balcony for quiet mornings with coffee or evenings under the city lights. Recent improvements offer peace of mind, including fresh stucco and exterior paint, a new AC system, a new electrical panel, freshly painted garage, new kitchen fl
Key facts
- Golden wood floors
- Private balcony
- Fresh stucco
Tags
Property features AI
Finance
- HOA & community: Stanford Court HOA; Annual association fee of $1,200; Community curbs and gutters
Exterior
- Parking: Attached garage with 2 parking spaces
- Security: Owned security system; Smoke detectors
- Utilities: Public water; Public sewer
- Home design: Residential property; Built in 2004; Pillar/post/pier and slab foundation; Composition roof
- Construction: Stucco construction
- Exterior features: Balcony; Sprinkler/irrigation system; Concrete road surface
Interior
- Kitchen: Dishwasher; Electric cooktop; Electric oven; Microwave; Garbage disposal; Built-in oven; Refrigerator
- Bedrooms: Primary bedroom located on fourth level (approx. 14.11 x 18.1); Bedroom on fourth level (approx. 13.2 x 13.5); Bedroom on first level (approx. 12.3 x 14.1)
- Flooring: Carpet; Tile; Travertine; Wood
- Bathrooms: 3 full bathrooms; 1 half bathroom
- Heating & cooling: Central heating (gas); Central air; Electric cooling; Attic fan
- Interior features: High ceilings; Kitchen island; Primary bathroom (bath in primary bedroom); Pantry; Soaking tub; Separate shower in primary bath; Vanity; Ceiling fans; Combined living/dining area; One fireplace; Total of 11 rooms
- Laundry & utility: Washer hookup; Electric dryer hookup; Gas dryer hookup
Neighborhood map
What this means for you Summary
Snapshot
- This is a 3-bed/3.0-bath single-family listed at $525k.
Deal economics
- At list price, monthly cash flow is $383 ($5k/yr) — positive.
- The deal already cash-flows at list — no discount required.
- Meets the 1% rule at list price ($6k rent vs $525k).
- Cap rate 7.2% vs local median 3.2% in Houston — top-decile yield for the area; either an underpriced asset or a hidden risk that comps aren't pricing in. Stress-test before assuming the spread holds.
Location & tenants
- Location reads 74/100 on livability (#184 in TX, #4,771 nationally) — a middle-class / working-renter tenant base. Strengths: amenities A+, cost of living A+, housing A+; Watch: crime F.
- Houston ISD (urban): math 27% / reading 35% proficiency, ranked #593 of 826 in TX (top 72%) — families likely to look elsewhere, expect single-tenant / working-renter base with shorter leases; 71% free/reduced lunch — lower-income household profile, screen leases tightly.
- Zoned schools: Wharton K-8 Dual Language Academy (math 38% / reading 50%, grade F, #1,243 of 4,322 statewide, top 29%, 627 students, 45% FRL); Lamar H S (math 38% / reading 65%, grade D+, #478 of 1,632 statewide, top 29%, 3,125 students, 49% FRL) — zoned schools average 47% FRL vs 71% district-wide (24 pts lower); this property's tenant base skews higher-income than the district average.
- Zoned-school proficiency averages 48% at this address vs 31% district-wide (+17 pts) — the actual schools serving this property are materially stronger than the Houston ISD average implies; a family-tenant draw the district grade alone would hide.
- Market conditions: Rents soft (-1.3%/yr); 264 active listings in the ZIP; 30 comparable units currently listed for rent nearby; rentals at typical pace (median 24d on market — plan ~3-4 weeks tenant-placement turnaround); 43% of comp listings sitting > 30 days — soft ceiling on asking rent; solid renter incomes; 29,883 units permitted in Harris County in 2024 (8,621 in 5+ unit buildings).
- At $5,762/mo this rent would consume 65% of the median local household income ($107k/yr) (locally 1688% of renters already pay >50% of income on rent) — very limited rent-growth headroom before tenants either downsize or default.
Forward outlook
- Local home prices are declining (-3.0%/yr); year-one equity from $4k of loan paydown is wiped out by about $16k of value loss. Plan a longer hold.
- Harris County population projected at +47% by 2050 — long-run rental-demand tailwind backs the buy-and-hold thesis.
Negotiation context
- Only 14 days on market — expect competitive offers; lowballing is unlikely to land.
- 18 sale attempts since 22y ago with the ask held roughly flat each time — persistent listings suggest the price (not the market) is what's stuck; bring a comps-based counter.
Risks & watch-outs
- Watch-outs: property tax is 2.5% of price.
- Climate carrying-cost: severe wind risk, 99% chance of damaging wind over 30y; extreme-heat days projected 7→23/yr by 2055 (HVAC capex compounding) — expect insurance premiums to compound above CPI over the hold.
Questions for the listing agent
- Property tax is high relative to price — has the assessment been appealed recently, and will the sale trigger a re-assessment?
- What does the HOA fee cover, when was the last increase, and are there any pending special assessments or reserve-fund shortfalls?
- Is there a deadline driving the sale (1031 exchange, divorce, estate, relocation)? That informs how much negotiation room exists.
- Schools are D-rated, which usually means shorter tenancies and higher turnover. Who's the typical renter profile here, and what's been the actual vacancy rate?
- Crime grade is F in this area — have there been break-ins, vandalism, or insurance claims at this property in the last 3 years? What carrier currently insures it and at what premium?
- What's the average days-on-market for RENTAL listings here right now (not sales)? A rising rental-DOM trend means longer vacancies and softer asking-rent achievability than the comps imply.
- What's the recent tenant-quality profile in this submarket — average credit score on applications, eviction rate, late-payment / NSF rate, and stable-employment percentage? A property-management company in the area should have these aggregated.
- How much new for-sale + rental construction is in the pipeline within 1–3 miles? Heavy new supply typically softens prices + rents 12–24 months out; constrained supply supports both.
Investment metrics
- 1% rule
- 1.10% ✓
- Cap rate
- 7.17%
- Cash-on-cash
- 3.13%
- DSCR
- 1.14
- GRM
- 7.6
CMA / ARV
- ARV (median comp)
- $668,243
- List price
- $525,000
- Delta
- -21.44%
- Verdict
- UNDERPRICED
- Comps
- 20 within 1.0 mi
Show comp detail 12 sales within ~0.75 mi
| Address | Dist | Beds/Ba | Sqft | Sold | Price | $/sf | Match |
|---|---|---|---|---|---|---|---|
| 628 Bomar St | 0.00mi | 3/3.5 | 2,873 (0%) | 1mo | $525,000 | $183 | 98 |
| 1110 Peden St Unit C | 0.27mi | 3/3.5 | 2,862 (-0%) | 1mo | $859,900 | $300 | 84 |
| 2407 Waugh Dr | 0.45mi | 4/3.0 (+1) | 2,880 (+0%) | 2mo | $1,095,000 | $380 | 72 |
| 1306 Crocker St | 0.26mi | 3/3.5 | 3,138 (+9%) | 1mo | $1,489,900 | $475 | 70 |
| 2716 Baldwin St | 0.52mi | 3/3.5 | 2,955 (+3%) | 0mo | $645,000 | $218 | 69 |
| 2614 Stanford St | 0.40mi | 4/3.5 (+1) | 2,784 (-3%) | 1mo | $1,050,000 | $377 | 68 |
| 602 W Clay St | 0.28mi | 4/3.5 (+1) | 3,100 (+8%) | 0mo | $989,900 | $319 | 66 |
| 1515 Hyde Park Blvd Blvd #6 | 0.60mi | 3/3.5 | 2,813 (-2%) | 1mo | $567,200 | $202 | 66 |
| 608 Stanford St Unit B | 0.57mi | 2/3.0 (-1) | 2,822 (-2%) | 1mo | $755,200 | $268 | 64 |
| 1311 Peden St | 0.46mi | 3/3.0 | 2,604 (-9%) | 1mo | $895,000 | $344 | 62 |
| 1209 Bomar St | 0.34mi | 4/2.0 (+1) | 2,564 (-11%) | 1mo | $649,000 | $253 | 56 |
| 1545 Haddon St | 0.72mi | 3/3.5 | 2,506 (-13%) | 2mo | $729,000 | $291 | 41 |
Match score weights: distance 35% · size 25% · config 20% · recency 20%. Top-matched comps best support the ARV.
Projected returns pro-forma
-3.0% appreciation · 0.0% rent growth · sell at horizon
- IRR
- -15.2%
- Equity multiple
- 0.48×
- Total profit
- $-77,117
- Equity at exit
- $78,279
- IRR
- -13.8%
- Equity multiple
- 0.32×
- Total profit
- $-99,258
- Equity at exit
- $45,392
Cash invested: $147,000 (down + closing). Projections, not guarantees.
Landlord ↔ Tenant lean methodology
- Overall (STATE)
- 87 Strongly Landlord-Friendly
- State Texas
- 87 Strongly Landlord-Friendly · R+5
- County
- — inherits STATE
- City
- — inherits STATE
ZIP-level market 77006
- Rents YoY
- -1.3%
- Active inventory
- 264
- Price-to-rent
- 7.6×
Monthly cashflow live
- Estimated rent
- $5,762 high interval (Pro) →
- Mortgage (P&I)
- −$2,753
- Tax from tax record
- −$1,096 /mo · $13,157/yr
- Insurance
- −$219
- HOA
- −$100
- Vacancy / Maint / Mgmt
- −$1,210
- Net cashflow
- $383
Break-even live
UW: 25.0% down · 7.5% · 30yr · 1.5% tax · 5.0% vac · 8.0% maint · 8.0% mgmt
Financing live
Cash to close
- Down payment
- $131,250
- Closing costs
- $15,750
- Reserves months
- —
- Total cash needed
- —
Loan-product check · same deal, 3 products live
Conventional
25% down · 7.5% · 30yr
- Down + closing
- —
- Monthly P&I
- —
- Monthly cashflow
- —
- DSCR
- —
- Eligible?
- —
Personal DTI + credit; lowest rate.
DSCR
20% down · 8.5% · 30yr
- Down + closing
- —
- Monthly P&I
- —
- Monthly cashflow
- —
- DSCR
- —
- Eligible?
- —
No personal income docs; deal must DSCR.
Hard money
10% down · 12.0% · 12mo
- Down + closing
- —
- Monthly P&I
- —
- Monthly cashflow
- —
- DSCR
- —
- Eligible?
- —
Short-term bridge; refi at stabilization.
Rent comps 30 comps
| Address | Beds | Baths | Sqft | Rent | $/sqft | DOM | Units | Dist |
|---|---|---|---|---|---|---|---|---|
| 328 Bomar St Houston, TX | 3.0 | 3.5 | 2688 | $5,300 | $1.97 | 21d | 1 | 0.15mi |
| 414 Hyde Park Blvd Houston, TX | 3.0 | 3.5 | 2300 | $5,400 | $2.35 | 5d | 1 | 0.32mi |
| 1118 Columbus St Unit A Houston, TX | 3.0 | 3.5 | 2338 | $3,000 | $1.28 | 43d | 1 | 0.34mi |
| 1211 Marconi St Houston, TX | 4.0 | 3.5 | 3020 | $4,500 | $1.49 | 43d | 1 | 0.35mi |
| 1326 Fairview Ave Houston, TX | 3.0 | 3.0 | 2176 | $3,250 | $1.49 | 43d | 1 | 0.44mi |
| 710 Stanford St Houston, TX | 3.0 | 4.0 | 2438 | $3,490 | $1.43 | 43d | 1 | 0.48mi |
| 2205 Commonwealth St Houston, TX | 4.0 | 4.0 | 2513 | $3,300 | $1.31 | 43d | 1 | 0.53mi |
| 420 Hawthorne St Houston, TX | 4.0 | 2.0 | 2230 | $3,373 | $1.51 | 43d | 1 | 0.70mi |
| 3411 Yoakum Blvd Unit 510 Houston, TX | 3.0 | 2.0 | 3110 | $12,304 | $3.96 | 10d | 1 | 0.74mi |
| 3411 Yoakum Blvd Unit 3165 Houston, TX | 3.0 | 2.0 | 3110 | $12,272 | $3.95 | 2d | 1 | 0.74mi |
| 3131 Memorial Ct Houston, TX | 2.0 | 1.0–2.5 | 1336 | $3,418 | $2.56 | 1d | 32 | 0.83mi |
| 1501 Hawthorne St Houston, TX | 2.0 | 1.0 | 3341 | $1,525 | $0.46 | 43d | 1 | 0.88mi |
| 3300 Main St Unit 3165 Houston, TX | 3.0 | 2.0 | 2861 | $7,461 | $2.61 | 2d | 1 | 1.00mi |
| 3300 Main St Unit 3333 Houston, TX | 3.0 | 2.0 | 2861 | $7,493 | $2.62 | 10d | 1 | 1.00mi |
| 1924 Fairview Ave Houston, TX | 3.0 | 3.5 | 2830 | $9,750 | $3.45 | 43d | 1 | 1.04mi |
| 2323 Woodhead St Unit 1019542P Houston, TX | 3.0 | 3.5 | 2820 | $15,722 | $5.58 | 24d | 1 | 1.05mi |
| 811 Buffalo Park Dr Unit 3187 Houston, TX | 3.0 | 2.0 | 3632 | $15,392 | $4.24 | 2d | 1 | 1.05mi |
| 811 Buffalo Park Dr Unit 844 Houston, TX | 3.0 | 2.0 | 3632 | $14,913 | $4.11 | 13d | 1 | 1.05mi |
| 811 Buffalo Park Dr Unit 510 Houston, TX | 3.0 | 2.0 | 3632 | $15,424 | $4.25 | 10d | 1 | 1.05mi |
| 1027 Gross St Houston, TX | 4.0 | 3.5 | 3035 | $5,800 | $1.91 | 43d | 1 | 1.08mi |
| 1958 W Gray St Unit 1991 Houston, TX | 3.0 | 2.0 | 3206 | $15,050 | $4.69 | 10d | 1 | 1.08mi |
| 1958 W Gray St Unit 3165 Houston, TX | 3.0 | 2.0 | 3206 | $15,018 | $4.68 | 2d | 1 | 1.08mi |
| 707 Marston St Unit 510 Houston, TX | 3.0 | 2.0 | 2310 | $12,482 | $5.40 | 2d | 1 | 1.14mi |
| 4001 Fannin St Houston, TX | 3.0 | 1.0–3.0 | 1536 | $3,158 | $2.06 | 3d | 16 | 1.25mi |
| 2024 Welch St Houston, TX | 3.0 | 4.0 | 2294 | $2,800 | $1.22 | 43d | 1 | 1.26mi |
| 2721 Austin St Houston, TX | 3.0 | 4.0 | 2607 | $3,000 | $1.15 | 24d | 1 | 1.26mi |
| 2416 La Branch St Houston, TX | 3.0 | 4.0 | 2540 | $2,900 | $1.14 | 43d | 1 | 1.31mi |
| 2809 Crawford St Houston, TX | 2.0 | 2.0 | 1928 | $2,600 | $1.35 | 43d | 1 | 1.39mi |
| 3010 Chenevert St Unit 1019638P Houston, TX | 3.0 | 3.5 | 3196 | $7,988 | $2.50 | 7d | 1 | 1.47mi |
| 3010 Chenevert St Unit 3010 Houston, TX | 3.0 | 3.5 | 3203 | $8,000 | $2.50 | 43d | 1 | 1.47mi |
HOA detail
- Monthly dues
- $100 · $1,200/yr
- Likely covers
- electric
Listing history 50 events
-
2026-05-14$525,000 Active 950-char remark
-
2026-05-14historical
-
2026-04-07$550,000 Active
-
2026-04-07historical
-
2026-03-12price $550,000
-
2026-02-13status Active
-
2026-01-29status Pending
-
2026-01-15status Pending
-
2026-01-13price $560,000
-
2026-01-13historical
-
2025-11-25price $550,000
-
2025-10-27$575,000 Active
-
2025-10-27historical
-
2025-09-17$600,000 Active
-
2025-09-04historical
-
2025-07-29$729,000 Active
-
2025-07-29historical
-
2025-05-31price $749,000
-
2025-05-13$749,999 Active
-
2023-01-30soldstatus
-
2023-01-27soldstatus Sold
-
2023-01-17status Pending
-
2022-12-09price $490,000
-
2022-11-13status Active
-
2022-11-09status Option Pending
-
2022-10-11price $499,000
-
2022-09-21price $515,000
-
2022-08-18$539,000 Active
-
2021-12-13historical
-
2021-10-07price $529,000
-
2021-06-24price $539,000
-
2021-04-27$549,000 Active
-
2020-06-22historical
-
2020-05-13price $499,000
-
2020-02-01$599,000 Active
-
2020-01-31historical
-
2020-01-26price $599,000
-
2019-11-06$625,000 Active
-
2014-07-24historical
-
2014-07-02$569,000 Active
-
2012-07-06soldstatus
-
2012-06-27soldstatus
-
2012-06-21historical
-
2012-05-13$379,900
-
2011-03-17historical
-
2010-05-07$375,000
-
2009-05-29historical
-
2009-05-11$449,000
-
2008-07-31historical
-
2007-11-28$449,000
ⓘ Source: listings_history table (triggers on properties + properties_extension) + one-shot
backfill from property_details.listing_events for pre-trigger history.
Tax reassessment forecast TX · Resets to sale price
- Current annual tax
- $13,157 · $1,096/mo
- Projected year-2 tax
- $13,157 · $1,096/mo
- Expected delta
- $0/yr ($0/mo · 0.0%)
ⓘ Screening estimate from a state-policy table — verify with the county assessor before closing.
Climate risk First Street
- Flood 1/10 Low FEMA zone X (unshaded) · 0% chance over 30 yrs
- Wildfire 1/10 Low
- Heat 9/10 Extreme 7 d/yr ≥109°F today · 23 d/yr by 30 yrs out
- Wind 9/10 Extreme 99% chance of damaging wind over 30 yrs
- Air quality 3/10 Moderate 2 unhealthy d/yr today · 3 by 30 yrs out
Nearby sold comps map
Loading sold comps map…
Walkable amenities ~0.75 mi
Loading nearby amenities…
Taxation est. · year 1
- Rental income
- $69,141
- − Mortgage interest
- −$29,408
- − Property taxes
- −$13,157
- − Insurance
- −$2,625
- − Repairs & maintenance
- −$5,531
- − Management
- −$5,531
- − HOA
- −$1,200
- − Depreciation
- −$15,273
- Taxable loss
- −$3,585
- Est. tax savings @ 24.0%
- +$860
- After-tax cash flow
- $5,462/yr
For passive investors: Depreciation is non-cash, so a rental often shows a tax loss while cash-flowing — sheltering income. Rental losses are passive: they offset passive income freely, and up to $25,000/yr can offset ordinary (W-2) income if you actively participate and your MAGI is under $100k (phasing out to $0 by $150k); unused losses carry forward. On sale, claimed depreciation is recaptured at up to 25%, and gains may owe capital-gains tax (a 1031 exchange can defer both). Figures are a year-1 estimate at your 24.0% rate — not tax advice; consult a CPA.
Schools (NCES district)
- District
- Houston ISD
- NCES district ID
- 4823640
- Math proficiency
- 27% ▼ -18.00%
- Reading proficiency
- 35% ▼ -6.00%
- Median HH income
- $46,054
- Composite
- 26.63/100
- National rank
- #7173
- State rank
- #593 of 826 in TX
Livability — Houston
- Score
- 74/100
- State rank
- #184
- US rank
- #4771
Category grades
Schools grade is shown separately in the Schools card above.
Census & demographics
- Census place
- Houston, TX
- County
- Harris County · 4,702,590 people
- City population
- 3,226,434
- Metro
- Houston-The Woodlands-Sugar Land, TX
- Population (ZIP)
- 24,892
- Household income
- $106,533
- Rent vs Own
- Severe rent burden
- 1688.0
Population outlook (Harris County) Hauer SSP2
- Today (2025)
- 5,571,493 people
- By 2030
- 6,089,821 · +9.3%
- By 2040
- 7,142,806 · +28.2%
- By 2050
- 8,185,864 · +46.9%
- By 2075
- 10,574,329 · +89.8%
- By 2100
- 12,109,958 · +117.4%
Race, ethnicity, and origin ACS 2023
- Neighborhood character
- Diverse neighborhood (Simpson 0.59)
- Race & ethnicity
- White 61% Hispanic / Latino 16% Two or more races 12% Asian 9% Black 8%
- Hispanic origin (detail)
- Mexican 9% Puerto Rican 1%
- Common ancestry
- Romanian 4% Slovak 4% Lithuanian 3%
- Foreign-born
- 16% · Canada, China, Jamaica
- Languages at home
- 77% English-only · Spanish 12% Other Indo-European 3% Chinese 2%
Political lean MEDSL · Harris
- 2024 margin
- Lean D (+5.5) · D 52.0% · R 46.4% · Other 1.6%
- 2008→2024 swing
- +3.9pp toward D · 2008: 1.6pp · 2024: 5.5pp
- All cycles
- 2024: D+5.5 2020: D+13.3 2016: D+12.4 2012: D+0.1 2008: D+1.6
Not yet ingested
- Civics
- —
Market trends
- HPI YoY
- ▼ -273.34%
- Current HPI
- 204.0321
- Rent YoY
- ▼ -1.29%
- Metro
- Houston-The Woodlands-Sugar Land, TX
- State GDP YoY
- ▲ 3.95%
- F500 in state
- 110
Industry mix (Fortune 500 HQ in TX)
| Industry | F500 HQs | Revenue |
|---|---|---|
| Energy | 16 | $1,198B |
|
||
| Technology | 5 | $198B |
|
||
| Engineering / Construction | 4 | $72B |
|
||
| Energy Services | 3 | $60B |
|
||
| Utilities | 3 | $41B |
|
||
| Healthcare | 2 | $330B |
|
||
Price history
+27.0% since first listed56 events — show timeline
- 2026-06-03 Sold (Public Records) — Public Records
- 2026-06-03 Sold (MLS) — HARMLS
- 2026-05-29 Pending — HARMLS
- 2026-05-20 Pending — HARMLS
- 2026-05-14 Listing Removed — HARMLS
- 2026-05-14 Listed $525,000 HARMLS
- 2026-04-07 Listing Removed — HARMLS
- 2026-04-07 Listed $550,000 HARMLS
- 2026-03-12 Price Changed $550,000 HARMLS
- 2026-02-13 Relisted — HARMLS
- 2026-01-29 Pending — HARMLS
- 2026-01-15 Pending — HARMLS
- 2026-01-13 Listing Removed — HARMLS
- 2026-01-13 Price Changed $560,000 HARMLS
- 2025-11-25 Price Changed $550,000 HARMLS
- 2025-10-27 Listing Removed — HARMLS
- 2025-10-27 Listed $575,000 HARMLS
- 2025-09-17 Listed $600,000 HARMLS
- 2025-09-04 Listing Removed — HARMLS
- 2025-07-29 Listing Removed — HARMLS
- 2025-07-29 Listed $729,000 HARMLS
- 2025-05-31 Price Changed $749,000 HARMLS
- 2025-05-13 Listed $749,999 HARMLS
- 2023-01-30 Sold (Public Records) — Public Records
- 2023-01-27 Sold (MLS) — HARMLS
- 2023-01-17 Pending — HARMLS
- 2022-12-09 Price Changed $490,000 HARMLS
- 2022-11-13 Relisted — HARMLS
- 2022-11-09 Pending — HARMLS
- 2022-10-11 Price Changed $499,000 HARMLS
- 2022-09-21 Price Changed $515,000 HARMLS
- 2022-08-18 Listed $539,000 HARMLS
- 2021-12-13 Listing Removed — HARMLS
- 2021-10-07 Price Changed $529,000 HARMLS
- 2021-06-24 Price Changed $539,000 HARMLS
- 2021-04-27 Listed $549,000 HARMLS
- 2020-06-22 Listing Removed — HARMLS
- 2020-05-13 Price Changed $499,000 HARMLS
- 2020-02-01 Listed $599,000 HARMLS
- 2020-01-31 Listing Removed — HARMLS
- 2020-01-26 Price Changed $599,000 HARMLS
- 2019-11-06 Listed $625,000 HARMLS
- 2014-07-24 Listing Removed — HARMLS
- 2014-07-02 Listed $569,000 HARMLS
- 2012-07-06 Sold (Public Records) — Public Records
- 2012-06-27 Sold (MLS) — HARMLS
- 2012-06-21 Listing Removed — HARMLS
- 2012-05-13 Listed $379,900 HARMLS
- 2011-03-17 Listing Removed — HARMLS
- 2010-05-07 Listed $375,000 HARMLS
- 2009-05-29 Listing Removed — HARMLS
- 2009-05-11 Listed $449,000 HARMLS
- 2008-07-31 Listing Removed — HARMLS
- 2007-11-28 Listed $449,000 HARMLS
- 2005-01-12 Listing Removed — HARMLS
- 2004-04-12 Listed $413,400 HARMLS
Property tax history
+4.5%/yrLatest (2025): $13,157 · +8.0% YoY. Source: county tax records.
Cash-flow waterfall
monthlySold comps — $/sqft
last 12 mo · ≤1 miLoading sold comps…