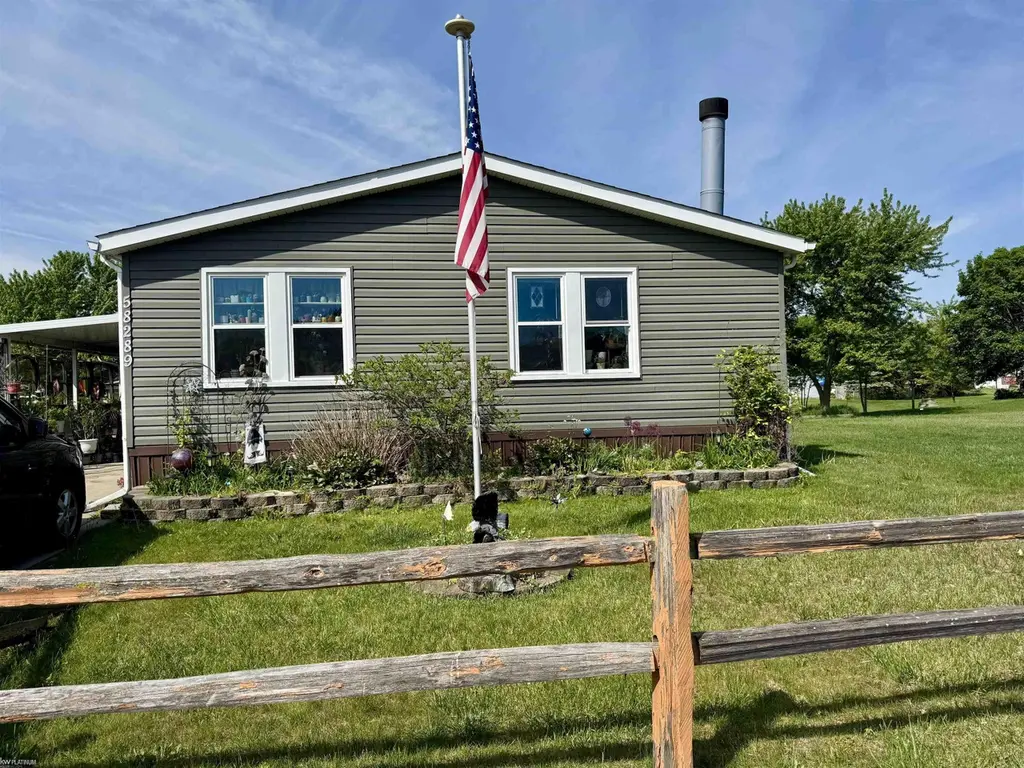
58289 Culpepper St · Washington, MI
Flood risk No data
- FEMA flood zone
- —
- Chance of flooding over 30 yrs
- —
- Est. flood insurance / yr
- —
Fire risk No data
- Est. fire insurance / yr
- —
Heat risk No data
- Hot days now (above threshold)
- —
- Hot days in 30 yrs
- —
Wind risk No data
- Chance of severe wind over 30 yrs
- —
Air-quality risk No data
- Unhealthy air days now
- —
- Unhealthy air days in 30 yrs
- —
Risk factors via First Street. Map © Google.
Why this score? — see what drove the B- grade
The composite is a weighted blend of 9 inputs, each scored 0–100. Each bar is that input's sub-score; the figure is the points it added to the 100-point composite (weight × sub-score).
- Cash flow +30.0/30.0
- 1% rule +10.0/10.0
- DSCR +10.0/10.0
- ARV discount +7.5/15.0
- Schools +4.2/10.0
- Rent growth +2.5/5.0
- Livability +2.5/5.0
- Condition / age +2.5/5.0
- Appreciation +0.0/10.0
$72,000
🖨 Deal sheet 📄 Offer letter ✓ Due diligence
Listing remarks MLS
Come check this one out before it's gone! This community has a pool, and a gym! It also has a club house that you can rent. This property is a short drive to Stony Metro Park. Buyer must be approved by the park in order to buy. Buyer to verify all information.
Key facts
- Pool
- Gym
- Club house
Tags
Property features AI
Finance
- Other: Residential property
- HOA & community: Homeowners association with monthly fee
Exterior
- Utilities: Public water; Public sewer
- Home design: Manufactured home; One-story
- Construction: 1,876 above-grade finished square feet
- Exterior features: No pool; Subdivision: EAST VILLAGE ESTATES
Interior
- Bathrooms: 2 full bathrooms
- Heating & cooling: Forced air heating (natural gas); No central cooling
- Interior features: Crawl space basement; 3 total rooms
Neighborhood map
What this means for you Summary
Snapshot
- This is a 3-bed/1.0-bath other listed at $72k.
Deal economics
- At list price, monthly cash flow is $1k ($16k/yr) — positive.
- The deal already cash-flows at list — no discount required.
- Meets the 1% rule at list price ($2k rent vs $72k).
- Recommended offer: $71k (1.5% below list) — sets the bar for market timing.
Location & tenants
- Location reads: area grade B — affects rentability + tenant quality, not the cash-flow math above.
- Romeo Community Schools (suburban): math 43% / reading 51% proficiency, ranked #102 of 540 in MI (top 19%) — families likely to look elsewhere, expect single-tenant / working-renter base with shorter leases.
- Market conditions: 41 active listings in the ZIP; 7 comparable units currently listed for rent nearby; rentals leasing fast (median 10d on market — plan ~1-2 weeks tenant-placement turnaround); 1,321 units permitted in Macomb County in 2024 (86 in 5+ unit buildings).
Forward outlook
- Local home prices are declining (-3.0%/yr); year-one equity from $498 of loan paydown is wiped out by about $2k of value loss. Plan a longer hold.
- Macomb County population projected at +9% by 2050 — modest demand growth; plan on rents tracking national, not racing it.
- At projected returns (-3.0% appreciation + 3.0% rent growth), your $20k cash investment doubles in ~2 years — after that, you're playing with house money.
Negotiation context
- It's been on market 21 days — a 2% lower offer ($71k) is reasonable based on typical stale-listing flexibility.
- 2 sale attempts; this cycle's ask has dropped $8k (10%) from the opening price — seller is motivated, your offer sets the floor, not the list.
Questions for the listing agent
- Is there a deadline driving the sale (1031 exchange, divorce, estate, relocation)? That informs how much negotiation room exists.
- What's the average days-on-market for RENTAL listings here right now (not sales)? A rising rental-DOM trend means longer vacancies and softer asking-rent achievability than the comps imply.
- What's the recent tenant-quality profile in this submarket — average credit score on applications, eviction rate, late-payment / NSF rate, and stable-employment percentage? A property-management company in the area should have these aggregated.
- How much new for-sale + rental construction is in the pipeline within 1–3 miles? Heavy new supply typically softens prices + rents 12–24 months out; constrained supply supports both.
Investment metrics
- 1% rule
- 3.26% ✓
- Cap rate
- 28.89%
- Cash-on-cash
- 80.70%
- DSCR
- 4.59
- GRM
- 2.6
CMA / ARV
No comps found within radius.
Projected returns pro-forma
-3.0% appreciation · 3.0% rent growth · sell at horizon
- IRR
- 80.9%
- Equity multiple
- 4.71×
- Total profit
- $74,723
- Equity at exit
- $10,735
- IRR
- 84.3%
- Equity multiple
- 9.75×
- Total profit
- $176,406
- Equity at exit
- $6,225
Cash invested: $20,160 (down + closing). Projections, not guarantees.
Landlord ↔ Tenant lean methodology
- Overall (STATE)
- 62 Landlord-Friendly
- State Michigan
- 62 Landlord-Friendly · EVEN
- County
- — inherits STATE
- City
- — inherits STATE
ZIP-level market 48049
- Home prices YoY
- -22.2%
- Active inventory
- 41
- Price-to-rent
- 2.6×
Monthly cashflow live
- Estimated rent
- $2,346 high interval (Pro) →
- Mortgage (P&I)
- −$378
- Tax est. 1.5%
- −$90 /mo · $1,080/yr
- Insurance
- −$30
- HOA
- −$0
- Vacancy / Maint / Mgmt
- −$493
- Net cashflow
- $1,356
Break-even live
UW: 25.0% down · 7.5% · 30yr · 1.5% tax · 5.0% vac · 8.0% maint · 8.0% mgmt
Financing live
Cash to close
- Down payment
- $18,000
- Closing costs
- $2,160
- Reserves months
- —
- Total cash needed
- —
Loan-product check · same deal, 3 products live
Conventional
25% down · 7.5% · 30yr
- Down + closing
- —
- Monthly P&I
- —
- Monthly cashflow
- —
- DSCR
- —
- Eligible?
- —
Personal DTI + credit; lowest rate.
DSCR
20% down · 8.5% · 30yr
- Down + closing
- —
- Monthly P&I
- —
- Monthly cashflow
- —
- DSCR
- —
- Eligible?
- —
No personal income docs; deal must DSCR.
Hard money
10% down · 12.0% · 12mo
- Down + closing
- —
- Monthly P&I
- —
- Monthly cashflow
- —
- DSCR
- —
- Eligible?
- —
Short-term bridge; refi at stabilization.
Rent comps 7 comps
| Address | Beds | Baths | Sqft | Rent | $/sqft | DOM | Units | Dist |
|---|---|---|---|---|---|---|---|---|
| 8891 Christopher St Washington, MI | 2.0–3.0 | 2.0–2.5 | 1416 | $2,410 | $1.70 | 1d | 10 | 0.43mi |
| 8783 Pioneer St Washington, MI | 2.0 | 2.5 | 1480 | $2,700 | $1.82 | 24d | 1 | 0.55mi |
| 8727 Pioneer St Washington, MI | 3.0 | 2.5 | 1777 | $2,750 | $1.55 | 43d | 1 | 0.63mi |
| Capital Cir Washington, MI | 3.0 | 3.0 | 1500 | $1,735 | $1.16 | 10d | 1 | 0.77mi |
| 7770 Newbury Cir Washington, MI | 2.0–3.0 | 2.5 | 1535 | $2,195 | $1.43 | 1d | 4 | 0.88mi |
| 7770 Newbury Cir Washington, MI | 2.0 | 2.5 | 1310 | $2,100 | $1.60 | 21d | 1 | 0.88mi |
| 7899 Sal Mar Way Unit 7899 Shelby Township, MI | 2.0 | 2.5 | 1545 | $1,875 | $1.21 | 1d | 1 | 1.47mi |
Listing history 17 events
-
2026-06-18days on market $72,000 Active 21 DOM
-
2026-06-17days on market $72,000 Active 20 DOM
-
2026-06-16days on market $72,000 Active 19 DOM
-
2026-06-15remarks 332-char remark
-
2026-06-15price $72,000 Active 18 DOM
-
2026-06-15days on market $80,000 Active 18 DOM
-
2026-06-13days on market $80,000 Active 16 DOM
-
2026-06-09days on market $80,000 Active 12 DOM
-
2026-06-08days on market $80,000 Active 11 DOM
-
2026-06-07days on market $80,000 Active 10 DOM
-
2026-06-04days on market $80,000 Active 7 DOM
-
2026-06-03days on market $80,000 Active 6 DOM
-
2026-06-02days on market $80,000 Active 5 DOM
-
2026-06-01days on market $80,000 Active 4 DOM
-
2026-05-31days on market $80,000 Active 3 DOM
-
2026-05-28$80,000 Active 260-char remark
Show marketing remark (260 chars)
Come check this one out before it's gone! This community has a pool, and a gym! It also has a club house that you can rent. This property is a short drive to Stony Metro Park. Buyer must be approved by the park in order to buy. Buyer to verify all information.
-
2026-05-28$80,000 Active
Show marketing remark (260 chars)
Come check this one out before it's gone! This community has a pool, and a gym! It also has a club house that you can rent. This property is a short drive to Stony Metro Park. Buyer must be approved by the park in order to buy. Buyer to verify all information.
ⓘ Source: listings_history table (triggers on properties + properties_extension) + one-shot
backfill from property_details.listing_events for pre-trigger history.
Nearby sold comps map
Loading sold comps map…
Walkable amenities ~0.75 mi
Loading nearby amenities…
Taxation est. · year 1
- Rental income
- $28,153
- − Mortgage interest
- −$4,033
- − Property taxes
- −$1,080
- − Insurance
- −$360
- − Repairs & maintenance
- −$2,252
- − Management
- −$2,252
- − Depreciation
- −$2,095
- Taxable income
- $16,081
- Est. tax owed @ 24.0%
- −$3,859
- After-tax cash flow
- $12,411/yr
For passive investors: Depreciation is non-cash, so a rental often shows a tax loss while cash-flowing — sheltering income. Rental losses are passive: they offset passive income freely, and up to $25,000/yr can offset ordinary (W-2) income if you actively participate and your MAGI is under $100k (phasing out to $0 by $150k); unused losses carry forward. On sale, claimed depreciation is recaptured at up to 25%, and gains may owe capital-gains tax (a 1031 exchange can defer both). Figures are a year-1 estimate at your 24.0% rate — not tax advice; consult a CPA.
Schools (NCES district)
- District
- Romeo Community Schools
- NCES district ID
- 2630090
- Math proficiency
- 43% ▼ -5.00%
- Reading proficiency
- 51% ▼ -8.00%
- Median HH income
- $73,121
- Composite
- 42.48/100
- National rank
- #3212
- State rank
- #102 of 540 in MI
Livability — Washington
No livability data for this city. (Only ~50 U.S. cities are tracked.)
Census & demographics
- City population
- 20,736
- Population (ZIP)
- 5,485
Population outlook (Macomb County) Hauer SSP2
- Today (2025)
- 925,296 people
- By 2030
- 948,226 · +2.5%
- By 2040
- 983,961 · +6.3%
- By 2050
- 1,010,200 · +9.2%
- By 2075
- 1,076,222 · +16.3%
- By 2100
- 1,077,065 · +16.4%
Race, ethnicity, and origin ACS 2023
- Neighborhood character
- Predominantly White (96%)
- Race & ethnicity
- White 96% Two or more races 2% Hispanic / Latino 1%
- Common ancestry
- Romanian 10% Lithuanian 6% Slovak 3%
- Foreign-born
- 1% · Canada
- Languages at home
- 98% English-only · Arabic 1% Spanish 1%
Political lean MEDSL · Macomb
- 2024 margin
- R (+13.7) · D 42.2% · R 55.9% · Other 1.9%
- 2008→2024 swing
- -22.3pp toward R · 2008: 8.6pp · 2024: -13.7pp
- All cycles
- 2024: R+13.7 2020: R+8.1 2016: R+11.6 2012: D+4.0 2008: D+8.6
Not yet ingested
- Civics
- —
Market trends
- HPI YoY
- ▼ -57.37%
- Current HPI
- 201.1257
- Rent YoY
- —
- Metro
- —
- State GDP YoY
- ▲ 1.37%
- F500 in state
- 28
Industry mix (Fortune 500 HQ in MI)
| Industry | F500 HQs | Revenue |
|---|---|---|
| Automotive Parts | 3 | $48B |
|
||
| Automotive | 2 | $372B |
|
||
| Chemicals | 1 | $45B |
|
||
| Automotive Retail | 1 | $29B |
|
||
| Healthcare / Medical Devices | 1 | $23B |
|
||
| Automotive Technology | 1 | $20B |
|
||
Price history
+0.0% since first listed2 events — show timeline
- 2026-05-28 Listed $80,000 REALCOMP
- 2026-05-28 Listed $80,000 MiRealSource-MiMLS
Cash-flow waterfall
monthlySold comps — $/sqft
last 12 mo · ≤1 miLoading sold comps…