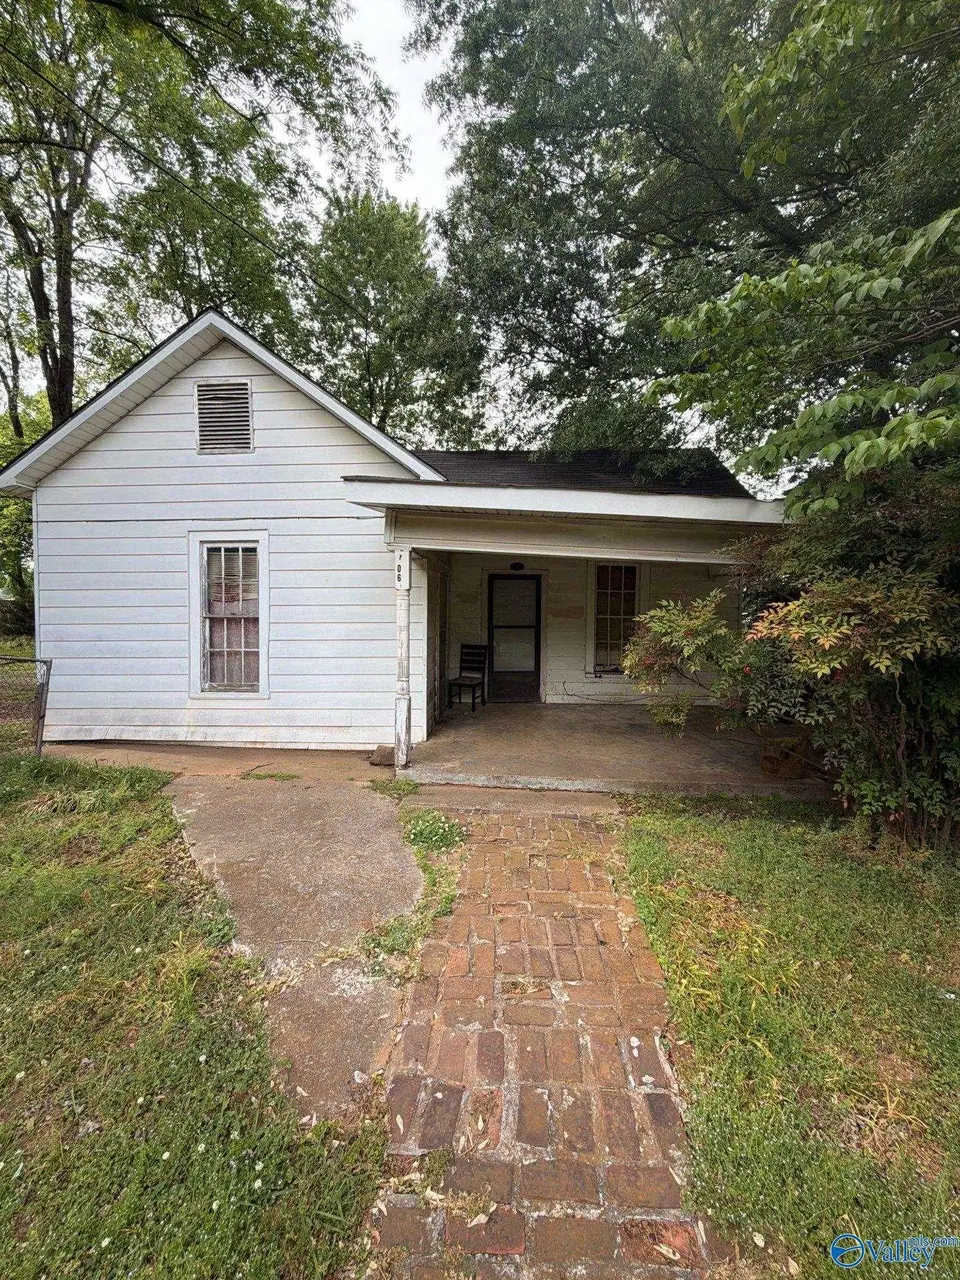
706 West Washington St · Athens, AL
Flood risk 7/10 · Major
- FEMA flood zone
- AE
- Chance of flooding over 30 yrs
- 0.95%
- Est. flood insurance / yr
- $1,737 – $8,500
Fire risk 3/10 · Minor
- Est. fire insurance / yr
- $916 – $1,700
Heat risk 5/10 · Moderate
- Hot days now (above 105°F)
- 7 days/yr
- Hot days in 30 yrs
- 19 days/yr
Wind risk 4/10 · Minor
- Chance of severe wind over 30 yrs
- 18.0%
Air-quality risk 2/10 · Minimal
- Unhealthy air days now
- 0 days/yr
- Unhealthy air days in 30 yrs
- 1 days/yr
Risk factors via First Street. Map © Google.
Why this score? — see what drove the B- grade
The composite is a weighted blend of 9 inputs, each scored 0–100. Each bar is that input's sub-score; the figure is the points it added to the 100-point composite (weight × sub-score).
- Cash flow +30.0/30.0
- 1% rule +10.0/10.0
- DSCR +10.0/10.0
- ARV discount +7.5/15.0
- Livability +3.8/5.0
- Schools +3.3/10.0
- Rent growth +2.8/5.0
- Condition / age +2.5/5.0
- Appreciation +0.0/10.0
$74,900
🖨 Deal sheet 📄 Offer letter ✓ Due diligence
Listing remarks
AVAILABLE FOR SALE AS A PACKAGE DEAL INCLUDING 704 West Washington right next door. This is a 3 bedroom 1 bathroom property, with an office space. SOLD AS IS WHERE IS.
Key facts
- 0.3 acre lot
- Listed 50 days
Property features AI
Finance
- HOA & community: No homeowners association; Subdivision: Metes And Bounds
Exterior
- Parking: No on-site parking
- Utilities: Public sewer
- Home design: Single-family residence; One story; Log construction
- Construction: Log construction
- Exterior features: Covered patio
Interior
- Bathrooms: 1 full bathroom
- Heating & cooling: Central heating; Central air conditioning
- Interior features: Crawl space basement; Central heating and cooling
Neighborhood map
What this means for you Summary
Snapshot
- This is a 3-bed/1.0-bath single-family listed at $75k.
Deal economics
- At list price, monthly cash flow is $204 ($2k/yr) — positive.
- The deal already cash-flows at list — no discount required.
- Meets the 1% rule at list price ($1k rent vs $75k).
- Recommended offer: $73k (3.0% below list) — sets the bar for market timing.
- Cap rate 16.4% vs local median 3.6% in Athens — top-decile yield for the area; either an underpriced asset or a hidden risk that comps aren't pricing in. Stress-test before assuming the spread holds.
Location & tenants
- Location reads 75/100 on livability (#18 in AL, #4,019 nationally) — a middle-class / working-renter tenant base. Strengths: cost of living A+, housing A+, health & safety A+; Watch: employment C-, commute F.
- Athens City (town): math 27% / reading 51% proficiency, ranked #29 of 129 in AL (top 22%) — families likely to look elsewhere, expect single-tenant / working-renter base with shorter leases.
- Zoned schools: Athens Middle School (math 15% / reading 45%, grade F, #121 of 257 statewide, top 50%, 958 students, 59% FRL); Athens High School (math 29% / reading 38%, grade F, #56 of 305 statewide, top 18%, 1,173 students, 51% FRL).
- Market conditions: Rents rising (+1.2%/yr); 546 active listings in the ZIP; 15 comparable units currently listed for rent nearby; rentals at typical pace (median 23d on market — plan ~3-4 weeks tenant-placement turnaround); 47% of comp listings sitting > 30 days — soft ceiling on asking rent; 494 units permitted in Limestone County in 2024 (0 in 5+ unit buildings).
Forward outlook
- Local home prices are declining (-3.0%/yr); year-one equity from $518 of loan paydown is wiped out by about $2k of value loss. Plan a longer hold.
- Limestone County population projected at +43% by 2050 — long-run rental-demand tailwind backs the buy-and-hold thesis.
Negotiation context
- It's been on market 50 days — a 3% lower offer ($73k) is reasonable based on typical stale-listing flexibility.
Risks & watch-outs
- Watch-outs: flood insurance adds $427/mo; built in 1929 — expect roof / HVAC / electrical / plumbing capex.
- Climate carrying-cost: in FEMA flood zone AE (mandatory federal flood insurance); extreme-heat days projected 7→19/yr by 2055 (HVAC capex compounding) — expect insurance premiums to compound above CPI over the hold.
Questions for the listing agent
- It's been on market 50 days. Have you received any prior offers? Is the seller open to a 3% concession, seller financing, or rate buy-down credit?
- Built in 1929 — when were the roof, HVAC, electrical panel, plumbing, and water heater last replaced?
- What's the actual annual flood-insurance premium (NFIP or private), and is the property in a SFHA with mandatory coverage?
- Is there a deadline driving the sale (1031 exchange, divorce, estate, relocation)? That informs how much negotiation room exists.
- What's the average days-on-market for RENTAL listings here right now (not sales)? A rising rental-DOM trend means longer vacancies and softer asking-rent achievability than the comps imply.
- What's the recent tenant-quality profile in this submarket — average credit score on applications, eviction rate, late-payment / NSF rate, and stable-employment percentage? A property-management company in the area should have these aggregated.
- How much new for-sale + rental construction is in the pipeline within 1–3 miles? Heavy new supply typically softens prices + rents 12–24 months out; constrained supply supports both.
Investment metrics
- 1% rule
- 1.88% ✓
- Cap rate
- 16.39%
- Cash-on-cash
- 36.05%
- DSCR
- 2.60
- GRM
- 4.4
CMA / ARV
- ARV (median comp)
- $192,347
- List price
- $74,900
- Delta
- -61.06%
- Verdict
- UNDERPRICED
- Comps
- 20 within 1.0 mi
Show comp detail 12 sales within ~0.75 mi
| Address | Dist | Beds/Ba | Sqft | Sold | Price | $/sf | Match |
|---|---|---|---|---|---|---|---|
| 804 S Houston St | 0.39mi | 3/2.0 | 1,335 (-0%) | 6mo | $207,500 | $155 | 72 |
| 1203 Houston St S | 0.58mi | 3/1.0 | 1,325 (-1%) | 5mo | $175,000 | $132 | 67 |
| 402 S 6th St | 0.52mi | 3/1.0 | 1,378 (+3%) | 5mo | $165,000 | $120 | 67 |
| 505 1st St | 0.28mi | 3/2.0 | 1,527 (+14%) | 3mo | $184,900 | $121 | 57 |
| 24490 Colorado Ln | 0.71mi | 3/2.0 | 1,375 (+3%) | 5mo | $250,990 | $183 | 54 |
| 1500 Buchanan St | 0.71mi | 4/2.0 (+1) | 1,375 (+3%) | 1mo | $209,900 | $153 | 53 |
| 1502 S Houston St | 0.72mi | 3/2.0 | 1,407 (+5%) | 7mo | $224,000 | $159 | 49 |
| 1227 W Hobbs St | 0.49mi | 3/2.0 | 1,500 (+12%) | 6mo | $149,000 | $99 | 48 |
| 16645 Aspen Ln | 0.67mi | 3/2.0 | 1,479 (+10%) | 1mo | $261,285 | $177 | 47 |
| 16640 Aspen Ln | 0.69mi | 3/2.0 | 1,479 (+10%) | 4mo | $257,265 | $174 | 43 |
| 16639 Aspen Ln | 0.68mi | 3/2.0 | 1,517 (+13%) | 2mo | $269,989 | $178 | 41 |
| 1400 SW Jefferson St | 0.71mi | 3/2.0 | 1,468 (+10%) | 7mo | $199,000 | $136 | 41 |
Match score weights: distance 35% · size 25% · config 20% · recency 20%. Top-matched comps best support the ARV.
Projected returns pro-forma
-3.0% appreciation · 1.23% rent growth · sell at horizon
- IRR
- -1.8%
- Equity multiple
- 0.93×
- Total profit
- $-1,382
- Equity at exit
- $11,168
- IRR
- 5.0%
- Equity multiple
- 1.32×
- Total profit
- $6,777
- Equity at exit
- $6,476
Cash invested: $20,972 (down + closing). Projections, not guarantees.
Landlord ↔ Tenant lean methodology
- Overall (STATE)
- 90 Strongly Landlord-Friendly
- State Alabama
- 90 Strongly Landlord-Friendly · R+15
- County
- — inherits STATE
- City
- — inherits STATE
ZIP-level market 35611
- Rents YoY
- 1.2%
- Active inventory
- 546
- Price-to-rent
- 4.4×
Monthly cashflow live
- Estimated rent
- $1,411 high interval (Pro) →
- Mortgage (P&I)
- −$393
- Tax from tax record
- −$61 /mo · $730/yr
- Insurance
- −$31
- Flood insurance flood zone
- −$427 /mo · $5,118/yr
- HOA
- −$0
- Vacancy / Maint / Mgmt
- −$296
- Net cashflow
- $204
Break-even live
UW: 25.0% down · 7.5% · 30yr · 1.5% tax · 5.0% vac · 8.0% maint · 8.0% mgmt
Financing live
Cash to close
- Down payment
- $18,725
- Closing costs
- $2,247
- Reserves months
- —
- Total cash needed
- —
Loan-product check · same deal, 3 products live
Conventional
25% down · 7.5% · 30yr
- Down + closing
- —
- Monthly P&I
- —
- Monthly cashflow
- —
- DSCR
- —
- Eligible?
- —
Personal DTI + credit; lowest rate.
DSCR
20% down · 8.5% · 30yr
- Down + closing
- —
- Monthly P&I
- —
- Monthly cashflow
- —
- DSCR
- —
- Eligible?
- —
No personal income docs; deal must DSCR.
Hard money
10% down · 12.0% · 12mo
- Down + closing
- —
- Monthly P&I
- —
- Monthly cashflow
- —
- DSCR
- —
- Eligible?
- —
Short-term bridge; refi at stabilization.
Rent comps 15 comps
| Address | Beds | Baths | Sqft | Rent | $/sqft | DOM | Units | Dist |
|---|---|---|---|---|---|---|---|---|
| 514 Brownsferry St Athens, AL | 3.0 | 1.0 | 953 | $1,045 | $1.10 | 43d | 1 | 0.19mi |
| 314 Browns Ferry St Athens, AL | 3.0 | 1.0 | 950 | $1,045 | $1.10 | 43d | 1 | 0.25mi |
| 1003 E Washington St Athens, AL | 4.0 | 3.0 | 1768 | $1,600 | $0.90 | 21d | 1 | 0.37mi |
| 100 Henry Dr Athens, AL | 2.0–3.0 | 2.0 | 1073 | $1,249 | $1.16 | 13d | 4 | 0.72mi |
| 707 Hine St N Athens, AL | 3.0 | 1.5 | 1400 | $1,450 | $1.04 | 43d | 1 | 0.74mi |
| 1601 Florence St Athens, AL | 3.0 | 1.0 | 1260 | $1,850 | $1.47 | 43d | 1 | 0.81mi |
| 710 S Clinton St Athens, AL | 1.0–3.0 | 1.0–2.0 | 1056 | $1,400 | $1.33 | 13d | 6 | 0.83mi |
| 426 Rogers St Athens, AL | 3.0 | 2.0 | 1738 | $1,550 | $0.89 | 13d | 1 | 1.05mi |
| 19254 Autumn Falls Way Athens, AL | 2.0 | 2.0 | 1200 | $1,469 | $1.22 | 13d | 1 | 1.06mi |
| 19254 Autumn Falls Way Athens, AL | 2.0 | 2.0 | 1200 | $1,239 | $1.03 | 21d | 1 | 1.06mi |
| 17896 Sallows Dr Athens, AL | 3.0 | 2.0 | 1450 | $1,595 | $1.10 | 23d | 1 | 1.15mi |
| 402 Crutcher Cir Athens, AL | 3.0 | 2.5 | 1108 | $2,000 | $1.81 | 43d | 1 | 1.23mi |
| 17662 Antlers Pass Athens, AL | 3.0 | 2.0 | 1600 | $1,650 | $1.03 | 43d | 1 | 1.31mi |
| 16129 Cohen Dr Athens, AL | 2.0–4.0 | 2.0–2.5 | 1650 | $1,658 | $1.00 | 13d | 9 | 1.34mi |
| 17962 Arrowhead Dr Athens, AL | 2.0 | 2.0 | 1043 | $1,024 | $0.98 | 43d | 1 | 1.41mi |
Listing history 16 events
-
2026-06-18days on market $74,900 Active 50 DOM
-
2026-06-17days on market $74,900 Active 49 DOM
-
2026-06-16days on market $74,900 Active 48 DOM
-
2026-06-15days on market $74,900 Active 47 DOM
-
2026-06-14days on market $74,900 Active 45 DOM
-
2026-06-10days on market $74,900 Active 42 DOM
-
2026-06-09days on market $74,900 Active 41 DOM
-
2026-06-08days on market $74,900 Active 40 DOM
-
2026-06-07days on market $74,900 Active 39 DOM
-
2026-06-05days on market $74,900 Active 36 DOM
-
2026-06-03days on market $74,900 Active 35 DOM
-
2026-06-02pricedays on market $74,900 Active 34 DOM
-
2026-06-01days on market $79,900 Active 33 DOM
-
2026-05-31days on market $79,900 Active 32 DOM
-
2026-05-30days on market $79,900 Active 31 DOM
-
2026-04-29$79,900 Active 167-char remark
ⓘ Source: listings_history table (triggers on properties + properties_extension) + one-shot
backfill from property_details.listing_events for pre-trigger history.
Tax reassessment forecast AL · Resets to sale price
- Current annual tax
- $730 · $61/mo
- Projected year-2 tax
- $730 · $61/mo
- Expected delta
- $0/yr ($0/mo · -0.0%)
ⓘ Screening estimate from a state-policy table — verify with the county assessor before closing.
Climate risk First Street
- Flood 7/10 Severe FEMA zone AE · 95% chance over 30 yrs
- Wildfire 3/10 Moderate
- Heat 5/10 Major 7 d/yr ≥105°F today · 19 d/yr by 30 yrs out
- Wind 4/10 Moderate 18% chance of damaging wind over 30 yrs
- Air quality 2/10 Low 0 unhealthy d/yr today · 1 by 30 yrs out
Nearby sold comps map
Loading sold comps map…
Walkable amenities ~0.75 mi
Loading nearby amenities…
Taxation est. · year 1
- Rental income
- $16,934
- − Mortgage interest
- −$4,196
- − Property taxes
- −$730
- − Insurance
- −$5,493
- − Repairs & maintenance
- −$1,355
- − Management
- −$1,355
- − Depreciation
- −$2,179
- Taxable income
- $1,628
- Est. tax owed @ 24.0%
- −$391
- After-tax cash flow
- $2,051/yr
For passive investors: Depreciation is non-cash, so a rental often shows a tax loss while cash-flowing — sheltering income. Rental losses are passive: they offset passive income freely, and up to $25,000/yr can offset ordinary (W-2) income if you actively participate and your MAGI is under $100k (phasing out to $0 by $150k); unused losses carry forward. On sale, claimed depreciation is recaptured at up to 25%, and gains may owe capital-gains tax (a 1031 exchange can defer both). Figures are a year-1 estimate at your 24.0% rate — not tax advice; consult a CPA.
Schools (NCES district)
- District
- Athens City
- NCES district ID
- 0100120
- Math proficiency
- 27% ▼ -23.00%
- Reading proficiency
- 51% ▬ 0.00%
- Median HH income
- $45,479
- Composite
- 33.14/100
- National rank
- #5555
- State rank
- #29 of 129 in AL
Livability — Athens
- Score
- 75/100
- State rank
- #18
- US rank
- #4019
Category grades
Schools grade is shown separately in the Schools card above.
Census & demographics
- Census place
- Athens, AL
- County
- Limestone County · 80,439 people
- City population
- 55,492
- Metro
- Huntsville, AL
- Population (ZIP)
- 29,969
- Household income
- $57,377
- Rent vs Own
- Severe rent burden
- 811.0
Population outlook (Limestone County) Hauer SSP2
- Today (2025)
- 111,441 people
- By 2030
- 121,272 · +8.8%
- By 2040
- 140,705 · +26.3%
- By 2050
- 159,069 · +42.7%
- By 2075
- 202,231 · +81.5%
- By 2100
- 230,608 · +106.9%
Race, ethnicity, and origin ACS 2023
- Neighborhood character
- Predominantly White (66%)
- Race & ethnicity
- White 66% Black 17% Hispanic / Latino 10% Two or more races 7% Native American 2%
- Hispanic origin (detail)
- Mexican 8%
- Common ancestry
- Lithuanian 2% Slovak 2% Serbian 1%
- Foreign-born
- 4% · Canada
- Languages at home
- 91% English-only · Spanish 7% German/W. Germanic 1%
Political lean MEDSL · Limestone
- 2024 margin
- Solid R (+43.9) · D 27.5% · R 71.4% · Other 1.2%
- 2008→2024 swing
- -2.0pp toward R · 2008: -41.9pp · 2024: -43.9pp
- All cycles
- 2024: R+43.9 2020: R+42.6 2016: R+49.5 2012: R+43.6 2008: R+41.9
Not yet ingested
- Civics
- —
Market trends
- HPI YoY
- ▼ -115.98%
- Current HPI
- 185.0264
- Rent YoY
- ▲ 1.23%
- Metro
- Huntsville, AL
- State GDP YoY
- ▲ 2.94%
- F500 in state
- 4
Industry mix (Fortune 500 HQ in AL)
| Industry | F500 HQs | Revenue |
|---|---|---|
| Financial Services | 1 | $8B |
|
||
| Healthcare | 1 | $5B |
|
||
Price history
-6.3% since first listed2 events — show timeline
- 2026-06-01 Price Changed $74,900 VMLS
- 2026-04-29 Listed $79,900 VMLS
Property tax history
+6.9%/yrLatest (2025): $730 · +12.6% YoY. Source: county tax records.
Cash-flow waterfall
monthlySold comps — $/sqft
last 12 mo · ≤1 miLoading sold comps…