2585 Royal Oak Dr · Titusville, FL
Flood risk 1/10 · Minimal
- FEMA flood zone
- X (unshaded)
- Chance of flooding over 30 yrs
- 0.0%
- Est. flood insurance / yr
- $507 – $1,088
Fire risk 4/10 · Minor
- Est. fire insurance / yr
- $947 – $1,759
Heat risk 10/10 · Severe
- Hot days now (above 108°F)
- 7 days/yr
- Hot days in 30 yrs
- 23 days/yr
Wind risk 10/10 · Severe
- Chance of severe wind over 30 yrs
- 99.0%
Air-quality risk 1/10 · Minimal
- Unhealthy air days now
- 0 days/yr
- Unhealthy air days in 30 yrs
- 0 days/yr
Risk factors via First Street. Map © Google.
Why this score? — see what drove the D grade
The composite is a weighted blend of 9 inputs, each scored 0–100. Each bar is that input's sub-score; the figure is the points it added to the 100-point composite (weight × sub-score).
- Cash flow +14.2/30.0
- ARV discount +7.5/15.0
- Schools +4.7/10.0
- DSCR +4.3/10.0
- Livability +4.2/5.0
- 1% rule +3.0/10.0
- Rent growth +2.8/5.0
- Condition / age +2.5/5.0
- Appreciation +0.0/10.0
$300,000
🖨 Deal sheet (PDF) 📄 Offer letter ✓ Due diligence
Listing remarks MLS
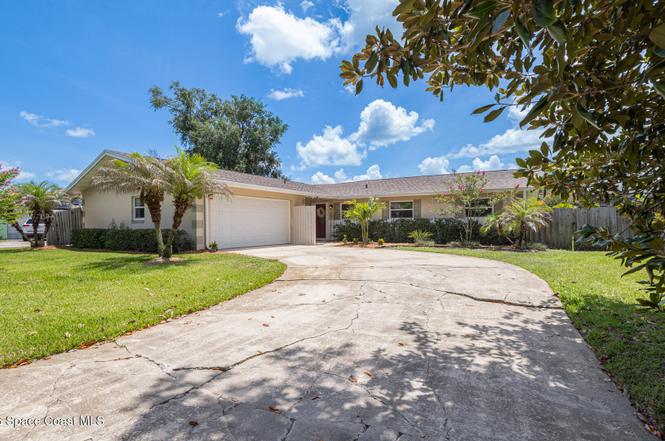
Beautiful family home in Royal Oak community. Home is neatly and very recently landscaped and has great curb appeal! Features include all new windows, newly polished terrazzo flooring throughout, completely new paint inside and out, including the garage floor. New hot water heater, and all new interior doors. Brand new sliding doors open up to the covered and screened-in patio out back. New water heater and electrical panel. Back porch rebuilt with new wood and screens as well as non-skid flooring. The backyard is spacious and completely fenced in.
Key facts
- Prime location
- New roof
- 9,583 sq ft lot
Tags
Property features AI
Exterior
- Parking: Garage; 2-car garage
- Utilities: Public sewer; Electricity connected; Sewer connected; Water connected
- Home design: Single-family residence; One level; Faces west
- Construction: Concrete and stucco construction
- Exterior features: Private lot (0.22 acres); Lot described as 'Other'
Interior
- Kitchen: Dishwasher; Electric range; Refrigerator
- Bedrooms: 4 bedrooms
- Flooring: Terrazzo
- Bathrooms: 2 full bathrooms
- Heating & cooling: Hot water heating; Central air conditioning; Has heating and cooling
- Interior features: Unfurnished; Cable connected
- Laundry & utility: Electric water heater
Neighborhood map
What this means for you Summary
Snapshot
- This is a 3-bed/2.0-bath single-family listed at $300k.
Deal economics
- At list price, monthly cash flow is $51 ($617/yr) — positive.
- The deal already cash-flows at list — no discount required.
- To meet the 1% rule (rent ≥ 1% of price), the offer needs to be $240k (20.0% below list).
- Recommended offer: $240k (20.0% below list) — sets the bar for 1% rule.
Location & tenants
- Location reads 84/100 on livability (#42 in FL, #668 nationally) — a professional / high-income tenant draw. Strengths: commute A+, cost of living A+, housing A+; Watch: crime D, employment D.
- Brevard (suburban): math 53% / reading 57% proficiency, ranked #19 of 73 in FL (top 26%) — acceptable for families but not a draw, mixed tenant base, ~2y average lease.
- Zoned schools: Apollo Elementary School (math 47% / reading 51%, grade D, #1,134 of 2,144 statewide, top 54%, 730 students, 68% FRL); Andrew Jackson Middle School (math 52% / reading 47%, grade C, #259 of 571 statewide, top 46%, 551 students, 58% FRL); Titusville High School (math 33% / reading 52%, grade F, #264 of 667 statewide, top 41%, 1,314 students, 55% FRL) — zoned schools average 60% FRL vs 43% district-wide (18 pts higher); higher-poverty schools than district average — tighter screening recommended.
- Market conditions: Rents rising (+1.3%/yr); 465 active listings in the ZIP; 23 comparable units currently listed for rent nearby; rentals at typical pace (median 26d on market — plan ~3-4 weeks tenant-placement turnaround); 4,602 units permitted in Brevard County in 2024 (702 in 5+ unit buildings).
- This rent runs 43% of the median local income ($68k/yr) — at the standard rent-burdened threshold; future hikes will face affordability resistance.
Forward outlook
- Local home prices are declining (-3.0%/yr); year-one equity from $2k of loan paydown is wiped out by about $9k of value loss. Plan a longer hold.
- Brevard County population projected at +15% by 2050 — modest demand growth; plan on rents tracking national, not racing it.
Negotiation context
- Only 3 days on market — expect competitive offers; lowballing is unlikely to land.
- 2 sale attempts since 11y ago with the ask held roughly flat each time — persistent listings suggest the price (not the market) is what's stuck; bring a comps-based counter.
- Current owner paid $115k; list at $300k implies a 161% gain — meaningful room to come down on a strong offer.
Risks & watch-outs
- Climate carrying-cost: severe wind risk, 99% chance of damaging wind over 30y; extreme-heat days projected 7→23/yr by 2055 (HVAC capex compounding) — expect insurance premiums to compound above CPI over the hold.
Questions for the listing agent
- Built in 1967 — when were the roof, HVAC, electrical panel, plumbing, and water heater last replaced?
- Is there a deadline driving the sale (1031 exchange, divorce, estate, relocation)? That informs how much negotiation room exists.
- Crime grade is D in this area — have there been break-ins, vandalism, or insurance claims at this property in the last 3 years? What carrier currently insures it and at what premium?
- The area grade is low — what's the realistic commute time and amenity access for the typical tenant pool here? Any planned neighborhood developments (good or bad) we should know about?
- What's the average days-on-market for RENTAL listings here right now (not sales)? A rising rental-DOM trend means longer vacancies and softer asking-rent achievability than the comps imply.
- What's the recent tenant-quality profile in this submarket — average credit score on applications, eviction rate, late-payment / NSF rate, and stable-employment percentage? A property-management company in the area should have these aggregated.
- How much new for-sale + rental construction is in the pipeline within 1–3 miles? Heavy new supply typically softens prices + rents 12–24 months out; constrained supply supports both.
Investment metrics
- 1% rule
- 0.80% ✗
- Cap rate
- 6.50%
- Cash-on-cash
- 0.73%
- DSCR
- 1.03
- GRM
- 10.4
CMA / ARV
No comps found within radius.
Projected returns pro-forma
-3.0% appreciation · 1.29% rent growth · sell at horizon
- IRR
- -16.9%
- Equity multiple
- 0.41×
- Total profit
- $-49,504
- Equity at exit
- $44,731
- IRR
- -11.9%
- Equity multiple
- 0.34×
- Total profit
- $-55,413
- Equity at exit
- $25,939
Cash invested: $84,000 (down + closing). Projections, not guarantees.
Landlord ↔ Tenant lean methodology
- Overall (STATE)
- 87 Strongly Landlord-Friendly
- State Florida
- 87 Strongly Landlord-Friendly · R+3
- County
- — inherits STATE
- City
- — inherits STATE
ZIP-level market 32780
- Rents YoY
- 1.3%
- Active inventory
- 465
- Price-to-rent
- 10.4×
Monthly cashflow live
- Estimated rent
- $2,400 high interval (Pro) →
- Mortgage (P&I)
- −$1,573
- Tax from tax record
- −$146 /mo · $1,752/yr
- Insurance
- −$125
- HOA
- −$0
- Vacancy / Maint / Mgmt
- −$504
- Net cashflow
- $51
Break-even live
Sensitivity live
| Price | -10% $221 | -5% $136 | +0% $51 | +5% $-34 | +10% $-118 |
|---|---|---|---|---|---|
| Rent | -10% $-138 | -5% $-43 | +0% $51 | +5% $146 | +10% $241 |
| Rate | -1.0pp $202 | -0.5pp $128 | base $51 | +0.5pp $-26 | +1.0pp $-105 |
UW: 25.0% down · 7.5% · 30yr · 1.5% tax · 5.0% vac · 8.0% maint · 8.0% mgmt
Financing live
Cash to close
- Down payment
- $75,000
- Closing costs
- $9,000
- Reserves months
- —
- Total cash needed
- —
Loan-product check · same deal, 3 products live
Conventional
25% down · 7.5% · 30yr
- Down + closing
- —
- Monthly P&I
- —
- Monthly cashflow
- —
- DSCR
- —
- Eligible?
- —
Personal DTI + credit; lowest rate.
DSCR
20% down · 8.5% · 30yr
- Down + closing
- —
- Monthly P&I
- —
- Monthly cashflow
- —
- DSCR
- —
- Eligible?
- —
No personal income docs; deal must DSCR.
Hard money
10% down · 12.0% · 12mo
- Down + closing
- —
- Monthly P&I
- —
- Monthly cashflow
- —
- DSCR
- —
- Eligible?
- —
Short-term bridge; refi at stabilization.
Rent comps 23 comps
| Address | Beds | Baths | Sqft | Rent | $/sqft | DOM | Units | Dist |
|---|---|---|---|---|---|---|---|---|
| 2445 Keiser Ct Titusville, FL | 4.0 | 2.0 | 1844 | $3,700 | $2.01 | 25d | 1 | 0.09mi |
| 2408 Devonswood Rd Titusville, FL | 3.0 | 2.0 | 1310 | $2,100 | $1.60 | 25d | 1 | 0.48mi |
| 3136 Finsterwald Dr Titusville, FL | 2.0 | 2.5 | 1280 | $2,000 | $1.56 | 25d | 1 | 0.49mi |
| 1965 Dipol Courtway Titusville, FL | 3.0 | 2.5 | 1669 | $1,775 | $1.06 | 25d | 1 | 0.52mi |
| 2511 Country Club Dr Unit B118 Titusville, FL | 2.0 | 1.5 | 1075 | $1,200 | $1.12 | 25d | 1 | 0.61mi |
| 1696 S Park Ave Titusville, FL | 2.0 | 2.5 | 1300 | $1,850 | $1.42 | 25d | 1 | 0.65mi |
| 1885 White Sands Dr Titusville, FL | 3.0 | 2.0 | 1800 | $2,400 | $1.33 | 16d | 1 | 0.72mi |
| 3535 Nicklaus Dr Titusville, FL | 3.0 | 2.0 | 1709 | $1,895 | $1.11 | 25d | 1 | 0.78mi |
| 1049 Macon Dr Titusville, FL | 3.0 | 2.0 | 1865 | $2,200 | $1.18 | 25d | 1 | 0.81mi |
| 919 Macon Dr Titusville, FL | 3.0 | 2.0 | 1620 | $2,000 | $1.23 | 25d | 1 | 0.88mi |
| 1640 Elizabeth Ave Titusville, FL | 3.0 | 2.0 | 1319 | $2,100 | $1.59 | 25d | 1 | 0.89mi |
| 888 Macon Dr Titusville, FL | 3.0 | 2.0 | 1865 | $2,000 | $1.07 | 25d | 1 | 0.91mi |
| 1279 Macon Dr Titusville, FL | 3.0 | 2.0 | 1620 | $2,000 | $1.23 | 25d | 1 | 0.93mi |
| 2605 S Park Ave Titusville, FL | 3.0 | 2.5 | 1525 | $1,950 | $1.28 | 25d | 1 | 0.95mi |
| 2965 La Cita Ln Titusville, FL | 3.0 | 2.0 | 1456 | $2,200 | $1.51 | 16d | 1 | 1.00mi |
| 1590 S Deleon Ave Titusville, FL | 3.0 | 1.0 | 1072 | $1,600 | $1.49 | 25d | 1 | 1.03mi |
| 680 Birchwood Ln Titusville, FL | 3.0 | 2.0 | 1440 | $1,900 | $1.32 | 25d | 1 | 1.09mi |
| 3433 Joe Murell Dr Titusville, FL | 2.0 | 1.5 | 1088 | $1,500 | $1.38 | 25d | 1 | 1.09mi |
| 1081 Solamere Dr Titusville, FL | 1.0–3.0 | 1.0–2.0 | 1331 | $2,101 | $1.58 | 16d | 17 | 1.13mi |
| 2300 Arctic Cir Titusville, FL | 3.0 | 2.0 | 1896 | $2,300 | $1.21 | 23d | 1 | 1.18mi |
| 1023 S Park Ave Titusville, FL | 2.0–3.0 | 2.0 | 1002 | $1,400 | $1.40 | 16d | 1 | 1.35mi |
| 3945 Trinidad Ave Titusville, FL | 4.0 | 2.0 | 1602 | $1,900 | $1.19 | 16d | 1 | 1.37mi |
| 1635 Nassau St Titusville, FL | 3.0 | 2.0 | 1161 | $1,900 | $1.64 | 21d | 1 | 1.46mi |
Listing history 3 events
-
2026-06-22days on market $300,000 Active 3 DOM
-
2026-06-18remarks 699-char remark
-
2026-06-18$300,000 Active 1 DOM
ⓘ Source: listings_history table (triggers on properties + properties_extension) + one-shot
backfill from property_details.listing_events for pre-trigger history.
Tax reassessment forecast FL · Resets to sale price
- Current annual tax
- $1,752 · $146/mo
- Projected year-2 tax
- $2,490 · $208/mo
- Expected delta
- +$738/yr (+$61/mo · 42.1%)
ⓘ Screening estimate from a state-policy table — verify with the county assessor before closing.
Climate risk First Street
- Flood 1/10 Low FEMA zone X (unshaded) · 0% chance over 30 yrs
- Wildfire 4/10 Moderate
- Heat 10/10 Extreme 7 d/yr ≥108°F today · 23 d/yr by 30 yrs out
- Wind 10/10 Extreme 99% chance of damaging wind over 30 yrs
- Air quality 1/10 Low 0 unhealthy d/yr today · 0 by 30 yrs out
Nearby sold comps map
Loading sold comps map…
Walkable amenities ~0.75 mi
Loading nearby amenities…
Taxation est. · year 1
- Rental income
- $28,794
- − Mortgage interest
- −$16,805
- − Property taxes
- −$1,752
- − Insurance
- −$1,500
- − Repairs & maintenance
- −$2,304
- − Management
- −$2,304
- − Depreciation
- −$8,727
- Taxable loss
- −$4,597
- Est. tax savings @ 24.0%
- +$1,103
- After-tax cash flow
- $1,720/yr
For passive investors: Depreciation is non-cash, so a rental often shows a tax loss while cash-flowing — sheltering income. Rental losses are passive: they offset passive income freely, and up to $25,000/yr can offset ordinary (W-2) income if you actively participate and your MAGI is under $100k (phasing out to $0 by $150k); unused losses carry forward. On sale, claimed depreciation is recaptured at up to 25%, and gains may owe capital-gains tax (a 1031 exchange can defer both). Figures are a year-1 estimate at your 24.0% rate — not tax advice; consult a CPA.
Schools (NCES district)
- District
- Brevard
- NCES district ID
- 1200150
- Math proficiency
- 53% ▼ -9.00%
- Reading proficiency
- 57% ▼ -4.00%
- Median HH income
- $49,426
- Composite
- 46.86/100
- National rank
- #2370
- State rank
- #19 of 73 in FL
Livability — Titusville
- Score
- 84/100
- State rank
- #42
- US rank
- #668
Category grades
Schools grade is shown separately in the Schools card above.
Census & demographics
- Census place
- Titusville, FL
- County
- Brevard County · 602,871 people
- City population
- 60,286
- Metro
- Palm Bay-Melbourne-Titusville, FL
- Population (ZIP)
- 40,064
- Household income
- $67,690
- Rent vs Own
- Severe rent burden
- 1141.0
Population outlook (Brevard County) Hauer SSP2
- Today (2025)
- 623,254 people
- By 2030
- 648,420 · +4.0%
- By 2040
- 690,009 · +10.7%
- By 2050
- 715,669 · +14.8%
- By 2075
- 775,744 · +24.5%
- By 2100
- 776,687 · +24.6%
Race, ethnicity, and origin ACS 2023
- Neighborhood character
- Predominantly White (70%)
- Race & ethnicity
- White 70% Black 13% Hispanic / Latino 8% Two or more races 8% Asian 3%
- Hispanic origin (detail)
- Mexican 1% Puerto Rican 4% Cuban 1%
- Common ancestry
- Romanian 2% Slovak 2% Lithuanian 2%
- Foreign-born
- 8% · Canada, China
- Languages at home
- 89% English-only · Spanish 6% Other Indo-European 1% German/W. Germanic 1%
Political lean MEDSL · Brevard
- 2024 margin
- Strong R (+20.8) · D 39.1% · R 59.9% · Other 1.0%
- 2008→2024 swing
- -10.4pp toward R · 2008: -10.4pp · 2024: -20.8pp
- All cycles
- 2024: R+20.8 2020: R+16.4 2016: R+19.8 2012: R+12.7 2008: R+10.4
Not yet ingested
- Civics
- —
Market trends
- HPI YoY
- ▼ -162.54%
- Current HPI
- 297.151
- Rent YoY
- ▲ 1.29%
- Metro
- Palm Bay-Melbourne-Titusville, FL
- State GDP YoY
- ▲ 3.28%
- F500 in state
- 36
Industry mix (Fortune 500 HQ in FL)
| Industry | F500 HQs | Revenue |
|---|---|---|
| Industrial Technology | 2 | $29B |
|
||
| Insurance | 2 | $17B |
|
||
| Retail | 1 | $60B |
|
||
| Technology Distribution | 1 | $58B |
|
||
| Homebuilding | 1 | $35B |
|
||
| Technology Manufacturing | 1 | $35B |
|
||
Price history
+130.9% since first listed4 events — show timeline
- 2026-06-18 Listed $300,000 SCMLS
- 2015-12-18 Sold (Public Records) $115,000 Public Records
- 2015-12-11 Sold (MLS) $115,000 SCMLS
- 2015-06-23 Listed $129,900 SCMLS
Property tax history
-1.0%/yrLatest (2025): $1,752 · +2.6% YoY. Source: county tax records.
Cash-flow waterfall
monthlySold comps — $/sqft
last 12 mo · ≤1 miLoading sold comps…