 Duplex
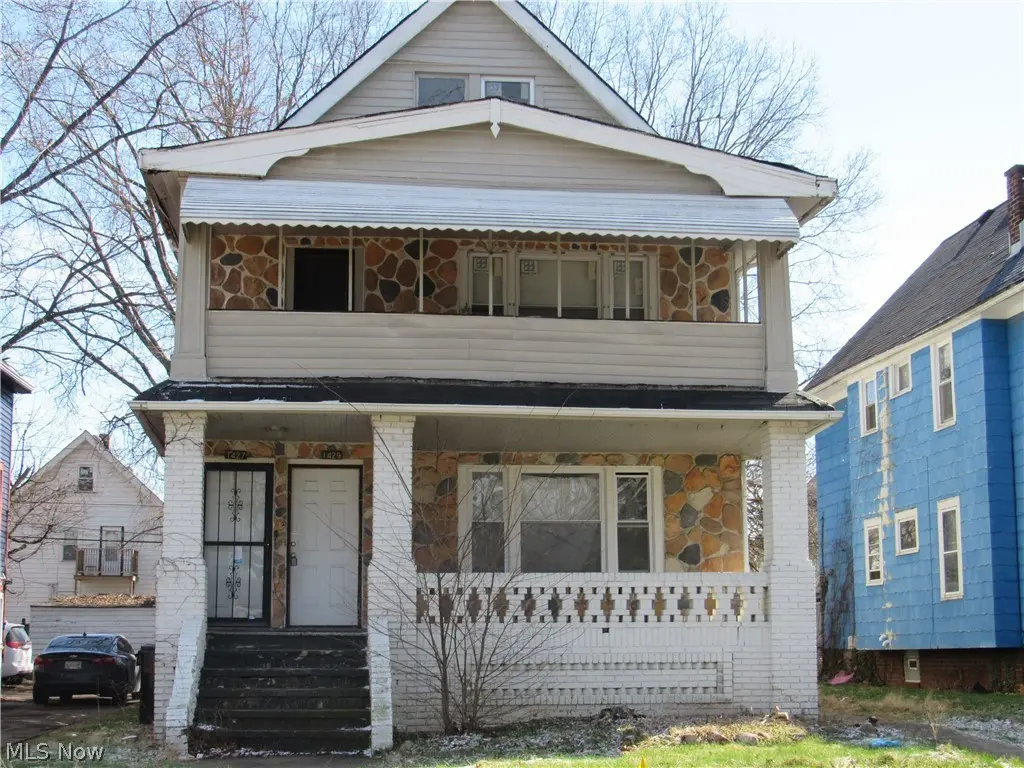
1427 E 133rd St · East Cleveland, OH
Flood risk 4/10 · Minor
- FEMA flood zone
- X (unshaded)
- Chance of flooding over 30 yrs
- 0.22%
- Est. flood insurance / yr
- $473 – $860
Fire risk 1/10 · Minimal
- Est. fire insurance / yr
- $713 – $1,323
Heat risk 3/10 · Minor
- Hot days now (above 95°F)
- 7 days/yr
- Hot days in 30 yrs
- 17 days/yr
Wind risk 1/10 · Minimal
- Chance of severe wind over 30 yrs
- —
Air-quality risk 3/10 · Minor
- Unhealthy air days now
- 3 days/yr
- Unhealthy air days in 30 yrs
- 5 days/yr
Risk factors via First Street. Map © Google.
Why this score? — see what drove the B+ grade
The composite is a weighted blend of 9 inputs, each scored 0–100. Each bar is that input's sub-score; the figure is the points it added to the 100-point composite (weight × sub-score).
- Cash flow +30.0/30.0
- ARV discount +15.0/15.0
- 1% rule +10.0/10.0
- DSCR +10.0/10.0
- Rent growth +3.8/5.0
- Livability +3.3/5.0
- Condition / age +2.5/5.0
- Schools +0.7/10.0
- Appreciation +0.0/10.0
$69,500
🖨 Deal sheet (PDF) 📄 Offer letter ✓ Due diligence
Multi-family units
County records classify this as Multi-Family (2-4 Unit). Listing-text estimate: 2 units. confirmed
Listing remarks MLS
Great opportunity to add to or start your investment portfolio! This spacious duplex features 3-bedroom units on both the first and second floors, offering strong rental potential. Each unit showcases classic charm with built-in cabinetry in the dining rooms and fireplaces in the living rooms. The property also presents value-add potential with a walk-up third floor that could be finished to expand the second-floor unit and increase overall income. Some updates appear to have been completed over time, including newer electrical panels and updated Romex wiring, along with newer exterior doors and neutral interior paint. This property will require improvements to reach full rental readiness but offers a solid opportunity for investors looking to build equity and maximize returns. Sold as-is. Property is part of a bankruptcy sale. Seller will make no repairs and will not turn on utilities for inspections. Seller addendum required with all offers.
Key facts
- Built-in cabinetry
- Fireplaces
- Newer exterior doors
Tags
Neighborhood map
What this means for you Summary
Snapshot
- This is a 2 × 3-bed/1.0-bath units multifamily listed at $70k.
Deal economics
- At list price, monthly cash flow is $1k ($16k/yr) — positive. Per door: $675/mo.
- The deal already cash-flows at list — no discount required.
- Meets the 1% rule at list price ($2k rent vs $70k).
- Recommended offer: $65k (6.0% below list) — sets the bar for market timing.
- Cap rate 29.6% vs local median 17.4% in East Cleveland — top-decile yield for the area; either an underpriced asset or a hidden risk that comps aren't pricing in. Stress-test before assuming the spread holds.
Location & tenants
- Location reads 66/100 on livability (#650 in OH) — a middle-class / working-renter tenant base. Strengths: commute A+, cost of living A+, health & safety A+; Watch: crime F, employment F.
- East Cleveland City School District (suburban): math 4% / reading 17% proficiency, ranked #652 of 656 in OH (top 99%) — low school quality limits family demand, transient renter base, plan for 1-2y turnover; 92% free/reduced lunch — lower-income household profile, screen leases tightly.
- Zoned schools: Caledonia Elementary School (246 students, 0% FRL); W.H. Kirk Middle School (math 6% / reading 15%, grade F, #642 of 654 statewide, top 98%, 291 students, 0% FRL); Shaw High School (math 2% / reading 27%, grade F, #706 of 781 statewide, top 92%, 541 students, 0% FRL) — zoned schools average 0% FRL vs 92% district-wide (92 pts lower); this property's tenant base skews higher-income than the district average.
- Market conditions: Rents rising fast (+5.2%/yr); 100 active listings in the ZIP; 2 comparable units currently listed for rent nearby; lower-income renter base — watch delinquency; 1,441 units permitted in Cuyahoga County in 2024 (700 in 5+ unit buildings).
- At $2,354/mo this rent would consume 98% of the median local household income ($29k/yr) (locally 1702% of renters already pay >50% of income on rent) — very limited rent-growth headroom before tenants either downsize or default.
Forward outlook
- Local home prices are declining (-3.0%/yr); year-one equity from $481 of loan paydown is wiped out by about $2k of value loss. Plan a longer hold.
- Cuyahoga County population projected to shrink 8% by 2050 — rents likely to lag national; underwrite the cash flow, not the appreciation.
- At projected returns (-3.0% appreciation + 5.2% rent growth), your $19k cash investment doubles in ~2 years — after that, you're playing with house money.
Negotiation context
- It's been on market 81 days — a 6% lower offer ($65k) is reasonable based on typical stale-listing flexibility.
- 2 sale attempts with the ask held roughly flat each time — persistent listings suggest the price (not the market) is what's stuck; bring a comps-based counter.
- Current owner paid $14k; list at $70k implies a 396% gain — meaningful room to come down on a strong offer.
Risks & watch-outs
- Watch-outs: built in 1924 — expect roof / HVAC / electrical / plumbing capex.
Questions for the listing agent
- It's been on market 81 days. Have you received any prior offers? Is the seller open to a 6% concession, seller financing, or rate buy-down credit?
- Can we see the unit-by-unit rent roll, current vacancy, and any below-market leases? What's the average tenancy length?
- What capital expenditures (roof, boiler, parking lot, exteriors) have been made in the last 5 years, and what's planned in the next 2?
- Built in 1924 — when were the roof, HVAC, electrical panel, plumbing, and water heater last replaced?
- Why hasn't it sold? Are there any deal-killer items the seller is aware of (foundation, flood, title, zoning, code violations)?
- Is there a deadline driving the sale (1031 exchange, divorce, estate, relocation)? That informs how much negotiation room exists.
- Schools are F-rated, which usually means shorter tenancies and higher turnover. Who's the typical renter profile here, and what's been the actual vacancy rate?
- Crime grade is F in this area — have there been break-ins, vandalism, or insurance claims at this property in the last 3 years? What carrier currently insures it and at what premium?
- What's the average days-on-market for RENTAL listings here right now (not sales)? A rising rental-DOM trend means longer vacancies and softer asking-rent achievability than the comps imply.
- What's the recent tenant-quality profile in this submarket — average credit score on applications, eviction rate, late-payment / NSF rate, and stable-employment percentage? A property-management company in the area should have these aggregated.
- How much new apartment / multifamily construction is in the pipeline within 1–3 miles? Heavy new supply (>2% of stock underway) typically softens rents 12–24 months out; light construction supports rent growth.
Investment metrics
- 1% rule
- 3.39% ✓
- Cap rate
- 29.60%
- Cash-on-cash
- 83.24%
- DSCR
- 4.70
- GRM
- 2.5
CMA / ARV
- ARV (median comp)
- $87,080
- List price
- $69,500
- Delta
- -20.19%
- Verdict
- UNDERPRICED
- Comps
- 20 within 1.0 mi
Show comp detail 6 sales within ~0.75 mi
| Address | Dist | Beds/Ba | Sqft | Sold | Price | $/sf | Match |
|---|---|---|---|---|---|---|---|
| 1443 E 133rd St | 0.03mi | 6/2.0 | 2,302 (+1%) | 20mo | $65,000 | $28 | 80 |
| 14012 Scioto Ave | 0.41mi | 5/3.0 (-1) | 2,209 (-3%) | 6mo | $95,000 | $43 | 62 |
| 14520 Strathmore Ave | 0.48mi | 5/3.0 (-1) | 2,220 (-2%) | 9mo | $130,000 | $59 | 57 |
| 14004 Northfield Ave | 0.37mi | 6/3.0 | 2,220 (-2%) | 23mo | $28,000 | $13 | 55 |
| 1216 Lakefront Ave | 0.72mi | 5/2.0 (-1) | 2,154 (-5%) | 3mo | $70,770 | $33 | 50 |
| 14310 Potomac Ave | 0.45mi | 5/2.0 (-1) | 1,982 (-13%) | 12mo | $36,000 | $18 | 42 |
Match score weights: distance 35% · size 25% · config 20% · recency 20%. Top-matched comps best support the ARV.
Projected returns pro-forma
-3.0% appreciation · 5.16% rent growth · sell at horizon
- IRR
- 86.1%
- Equity multiple
- 5.11×
- Total profit
- $79,991
- Equity at exit
- $10,363
- IRR
- 89.7%
- Equity multiple
- 11.43×
- Total profit
- $202,991
- Equity at exit
- $6,009
Cash invested: $19,460 (down + closing). Projections, not guarantees.
Landlord ↔ Tenant lean methodology
- Overall (STATE)
- 73 Landlord-Friendly
- State Ohio
- 73 Landlord-Friendly · R+6
- County
- — inherits STATE
- City
- — inherits STATE
ZIP-level market 44112
- Rents YoY
- 5.2%
- Active inventory
- 100
- Price-to-rent
- 4.9×
Monthly cashflow live
- Estimated rent
- $2,354 high interval (Pro) →
- Mortgage (P&I)
- −$364
- Tax from tax record
- −$116 /mo · $1,397/yr
- Insurance
- −$29
- HOA
- −$0
- Vacancy / Maint / Mgmt
- −$494
- Net cashflow
- $1,350
Break-even live
Sensitivity live
| Price | -10% $1,389 | -5% $1,370 | +0% $1,350 | +5% $1,330 | +10% $1,311 |
|---|---|---|---|---|---|
| Rent | -10% $1,164 | -5% $1,257 | +0% $1,350 | +5% $1,443 | +10% $1,536 |
| Rate | -1.0pp $1,385 | -0.5pp $1,368 | base $1,350 | +0.5pp $1,332 | +1.0pp $1,314 |
2-unit breakdown (identical units grouped — click to expand)
| Units | Beds | Baths | Est. rent |
|---|---|---|---|
| 2× units | 3 | 1 | $2,354 |
| #1 | 3 | 1 | $1,177 |
| #2 | 3 | 1 | $1,177 |
| Total (2 units) | $2,354 | ||
UW: 25.0% down · 7.5% · 30yr · 1.5% tax · 5.0% vac · 8.0% maint · 8.0% mgmt
Financing live
Cash to close
- Down payment
- $17,375
- Closing costs
- $2,085
- Reserves months
- —
- Total cash needed
- —
Loan-product check · same deal, 3 products live
Conventional
25% down · 7.5% · 30yr
- Down + closing
- —
- Monthly P&I
- —
- Monthly cashflow
- —
- DSCR
- —
- Eligible?
- —
Personal DTI + credit; lowest rate.
DSCR
20% down · 8.5% · 30yr
- Down + closing
- —
- Monthly P&I
- —
- Monthly cashflow
- —
- DSCR
- —
- Eligible?
- —
No personal income docs; deal must DSCR.
Hard money
10% down · 12.0% · 12mo
- Down + closing
- —
- Monthly P&I
- —
- Monthly cashflow
- —
- DSCR
- —
- Eligible?
- —
Short-term bridge; refi at stabilization.
Rent comps 2 comps
| Address | Beds | Baths | Sqft | Rent | $/sqft | DOM | Units | Dist |
|---|---|---|---|---|---|---|---|---|
| 1229 Melbourne Rd Cleveland, OH | 5.0 | 1.5 | 1600 | $2,000 | $1.25 | 45d | 1 | 1.07mi |
| 1853 Noble Rd Cleveland, OH | 7.0 | 2.0 | 2387 | $600 | $0.25 | 45d | 1 | 1.24mi |
Listing history 22 events
-
2026-06-21days on market $69,500 Active 81 DOM
-
2026-06-18days on market $69,500 Active 78 DOM
-
2026-06-17days on market $69,500 Active 77 DOM
-
2026-06-16days on market $69,500 Active 76 DOM
-
2026-06-15days on market $69,500 Active 75 DOM
-
2026-06-13days on market $69,500 Active 73 DOM
-
2026-06-13days on market $69,500 Active 72 DOM
-
2026-06-09days on market $69,500 Active 69 DOM
-
2026-06-08days on market $69,500 Active 68 DOM
-
2026-06-07days on market $69,500 Active 67 DOM
-
2026-06-05days on market $69,500 Active 64 DOM
-
2026-06-03days on market $69,500 Active 63 DOM
-
2026-06-02days on market $69,500 Active 62 DOM
-
2026-06-01days on market $69,500 Active 61 DOM
-
2026-05-31days on market $69,500 Active 60 DOM
-
2026-03-31historical
-
2026-03-30$69,500 Active 957-char remark
Show marketing remark (957 chars)
Great opportunity to add to or start your investment portfolio! This spacious duplex features 3-bedroom units on both the first and second floors, offering strong rental potential. Each unit showcases classic charm with built-in cabinetry in the dining rooms and fireplaces in the living rooms. The property also presents value-add potential with a walk-up third floor that could be finished to expand the second-floor unit and increase overall income. Some updates appear to have been completed over time, including newer electrical panels and updated Romex wiring, along with newer exterior doors and neutral interior paint. This property will require improvements to reach full rental readiness but offers a solid opportunity for investors looking to build equity and maximize returns. Sold as-is. Property is part of a bankruptcy sale. Seller will make no repairs and will not turn on utilities for inspections. Seller addendum required with all offers.
-
2026-01-14price $69,500
-
2025-11-06price $70,000
-
2025-10-14price $74,500
-
2025-08-25$76,400 Active
-
2019-10-09soldstatus $14,000
ⓘ Source: listings_history table (triggers on properties + properties_extension) + one-shot
backfill from property_details.listing_events for pre-trigger history.
Tax reassessment forecast OH · Partial reset (capped growth)
- Current annual tax
- $1,397 · $116/mo
- Projected year-2 tax
- $1,397 · $116/mo
- Expected delta
- $0/yr ($0/mo · 0.0%)
ⓘ Screening estimate from a state-policy table — verify with the county assessor before closing.
Climate risk First Street
- Flood 4/10 Moderate FEMA zone X (unshaded) · 22% chance over 30 yrs
- Wildfire 1/10 Low
- Heat 3/10 Moderate 7 d/yr ≥95°F today · 17 d/yr by 30 yrs out
- Wind 1/10 Low
- Air quality 3/10 Moderate 3 unhealthy d/yr today · 5 by 30 yrs out
Nearby sold comps map
Loading sold comps map…
Walkable amenities ~0.75 mi
Loading nearby amenities…
Taxation est. · year 1
- Rental income
- $28,248
- − Mortgage interest
- −$3,893
- − Property taxes
- −$1,397
- − Insurance
- −$348
- − Repairs & maintenance
- −$2,260
- − Management
- −$2,260
- − Depreciation
- −$2,022
- Taxable income
- $16,069
- Est. tax owed @ 24.0%
- −$3,857
- After-tax cash flow
- $12,342/yr
For passive investors: Depreciation is non-cash, so a rental often shows a tax loss while cash-flowing — sheltering income. Rental losses are passive: they offset passive income freely, and up to $25,000/yr can offset ordinary (W-2) income if you actively participate and your MAGI is under $100k (phasing out to $0 by $150k); unused losses carry forward. On sale, claimed depreciation is recaptured at up to 25%, and gains may owe capital-gains tax (a 1031 exchange can defer both). Figures are a year-1 estimate at your 24.0% rate — not tax advice; consult a CPA.
Schools (NCES district)
- District
- East Cleveland City School District
- NCES district ID
- 3904390
- Math proficiency
- 4% ▼ -16.00%
- Reading proficiency
- 17% ▼ -13.00%
- Median HH income
- $22,726
- Composite
- 7.38/100
- National rank
- #9954
- State rank
- #652 of 656 in OH
Livability — East Cleveland
- Score
- 66/100
- State rank
- #650
- US rank
- #11510
Category grades
Schools grade is shown separately in the Schools card above.
Census & demographics
- Census place
- East Cleveland, OH
- County
- Cuyahoga County · 1,090,369 people
- City population
- 17,848
- Metro
- Cleveland-Elyria, OH
- Population (ZIP)
- 17,848
- Household income
- $28,799
- Rent vs Own
- Severe rent burden
- 1702.0
Population outlook (Cuyahoga County) Hauer SSP2
- Today (2025)
- 1,244,621 people
- By 2030
- 1,230,093 · -1.2%
- By 2040
- 1,189,108 · -4.5%
- By 2050
- 1,145,706 · -7.9%
- By 2075
- 1,076,557 · -13.5%
- By 2100
- 978,987 · -21.3%
Race, ethnicity, and origin ACS 2023
- Neighborhood character
- Predominantly Black (89%)
- Race & ethnicity
- Black 89% White 7% Two or more races 2% Hispanic / Latino 1%
- Common ancestry
- Lithuanian 1%
- Foreign-born
- 4% · Canada
- Languages at home
- 93% English-only · French/Haitian/Cajun 3% Spanish 2% Russian/Polish/Slavic 1%
Political lean MEDSL · Cuyahoga
- 2024 margin
- Solid D (+31.5) · D 65.4% · R 33.9%
- 2008→2024 swing
- -7.4pp toward R · 2008: 38.9pp · 2024: 31.5pp
- All cycles
- 2024: D+31.5 2020: D+34.1 2016: D+35.0 2012: D+38.7 2008: D+38.9
Not yet ingested
- Civics
- —
Market trends
- HPI YoY
- ▼ -115.61%
- Current HPI
- 67.2162
- Rent YoY
- ▲ 5.16%
- Metro
- Cleveland-Elyria, OH
- State GDP YoY
- ▲ 1.98%
- F500 in state
- 48
Industry mix (Fortune 500 HQ in OH)
| Industry | F500 HQs | Revenue |
|---|---|---|
| Insurance | 3 | $145B |
|
||
| Industrial Machinery | 3 | $49B |
|
||
| Financial Services | 3 | $24B |
|
||
| Consumer Goods | 2 | $93B |
|
||
| Aerospace / Defense | 2 | $47B |
|
||
| Utilities | 2 | $33B |
|
||
Price history
+396.4% since first listed7 events — show timeline
- 2026-03-31 Listing Removed — MLSNOW
- 2026-03-30 Listed $69,500 MLSNOW
- 2026-01-14 Price Changed $69,500 MLSNOW
- 2025-11-06 Price Changed $70,000 MLSNOW
- 2025-10-14 Price Changed $74,500 MLSNOW
- 2025-08-25 Listed $76,400 MLSNOW
- 2019-10-09 Sold (Public Records) $14,000 Public Records
Property tax history
+1.0%/yrLatest (2025): $1,397 · +0.0% YoY. Source: county tax records.
Cash-flow waterfall
monthlySold comps — $/sqft
last 12 mo · ≤1 miLoading sold comps…