 Duplex
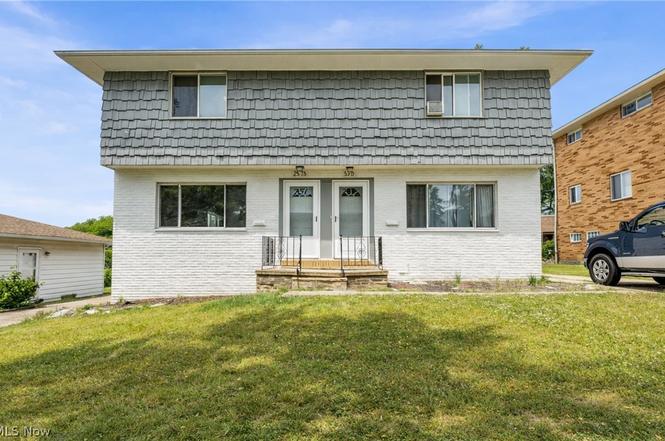
8215 Crudele Dr · Garfield Heights, OH
Flood risk 1/10 · Minimal
- FEMA flood zone
- X (unshaded)
- Chance of flooding over 30 yrs
- 0.0%
- Est. flood insurance / yr
- $473 – $860
Fire risk 1/10 · Minimal
- Est. fire insurance / yr
- $713 – $1,323
Heat risk 3/10 · Minor
- Hot days now (above 96°F)
- 7 days/yr
- Hot days in 30 yrs
- 17 days/yr
Wind risk 1/10 · Minimal
- Chance of severe wind over 30 yrs
- —
Air-quality risk 3/10 · Minor
- Unhealthy air days now
- 2 days/yr
- Unhealthy air days in 30 yrs
- 3 days/yr
Risk factors via First Street. Map © Google.
Why this score? — see what drove the D+ grade
The composite is a weighted blend of 9 inputs, each scored 0–100. Each bar is that input's sub-score; the figure is the points it added to the 100-point composite (weight × sub-score).
- Cash flow +23.4/30.0
- DSCR +7.5/10.0
- 1% rule +6.4/10.0
- Rent growth +3.7/5.0
- Livability +3.4/5.0
- Condition / age +2.5/5.0
- Schools +1.3/10.0
- ARV discount +0.0/15.0
- Appreciation +0.0/10.0
$269,900
🖨 Deal sheet 📄 Offer letter ✓ Due diligence
Multi-family units
County records classify this as Multi-Family (2-4 Unit). Listing-text estimate: 2 units. confirmed
Listing remarks MLS
Great investment opportunity available in this partially occupied duplex! The large property has 2 units, each with 3 bedrooms and 1 bath, separate entrances and basements! Unit 8217 is tenant occupied, renting for $1050/month on a month to month lease. Unit 8215 is vacant and mostly rent ready! There are vinyl windows throughout and a detached 2-car garage for convenient off-street parking! Great high demand location close to parks, schools, public transit, easy highway access, shopping and more! Don't miss your chance at adding solid value to your portfolio - schedule a showing to see this one for yourself!
Key facts
- Thoughtfully updated
- Turnkey investment
- 7,801 sq ft lot
Tags
Neighborhood map
What this means for you Summary
Snapshot
- This is a 2 × 3.0-bed/1.5-bath units multifamily listed at $270k.
Deal economics
- At list price, monthly cash flow is $500 ($6k/yr) — positive. Per door: $250/mo.
- The deal already cash-flows at list — no discount required.
- Meets the 1% rule at list price ($3k rent vs $270k).
- Cap rate 8.5% vs local median 6.8% in Garfield Heights — meaningfully above typical; check what's discounted (condition, days-on-market, listing class) to confirm the premium yield is real.
Location & tenants
- Location reads 67/100 on livability (#593 in OH) — a middle-class / working-renter tenant base. Strengths: cost of living A+, housing A+, health & safety A; Watch: schools C-, crime D-, amenities F.
- Garfield Heights City Schools (suburban): math 8% / reading 22% proficiency, ranked #643 of 656 in OH (top 98%) — low school quality limits family demand, transient renter base, plan for 1-2y turnover; 64% free/reduced lunch — lower-income household profile, screen leases tightly.
- Market conditions: Rents rising fast (+4.8%/yr); 120 active listings in the ZIP; 1,441 units permitted in Cuyahoga County in 2024 (700 in 5+ unit buildings).
- At $3,089/mo this rent would consume 65% of the median local household income ($57k/yr) (locally 1738% of renters already pay >50% of income on rent) — very limited rent-growth headroom before tenants either downsize or default.
Forward outlook
- Local home prices are declining (-3.0%/yr); year-one equity from $2k of loan paydown is wiped out by about $8k of value loss. Plan a longer hold.
- Cuyahoga County population projected to shrink 8% by 2050 — rents likely to lag national; underwrite the cash flow, not the appreciation.
- At projected returns (-3.0% appreciation + 4.8% rent growth), your $76k cash investment doubles in ~10 years — after that, you're playing with house money.
Negotiation context
- Only 6 days on market — expect competitive offers; lowballing is unlikely to land.
- 7 sale attempts since 31y ago with the ask held roughly flat each time — persistent listings suggest the price (not the market) is what's stuck; bring a comps-based counter.
- Current owner paid $165k; list at $270k implies a 64% gain — meaningful room to come down on a strong offer.
Questions for the listing agent
- Can we see the unit-by-unit rent roll, current vacancy, and any below-market leases? What's the average tenancy length?
- What capital expenditures (roof, boiler, parking lot, exteriors) have been made in the last 5 years, and what's planned in the next 2?
- Built in 1965 — when were the roof, HVAC, electrical panel, plumbing, and water heater last replaced?
- Is there a deadline driving the sale (1031 exchange, divorce, estate, relocation)? That informs how much negotiation room exists.
- Crime grade is D in this area — have there been break-ins, vandalism, or insurance claims at this property in the last 3 years? What carrier currently insures it and at what premium?
- The area grade is low — what's the realistic commute time and amenity access for the typical tenant pool here? Any planned neighborhood developments (good or bad) we should know about?
- What's the average days-on-market for RENTAL listings here right now (not sales)? A rising rental-DOM trend means longer vacancies and softer asking-rent achievability than the comps imply.
- What's the recent tenant-quality profile in this submarket — average credit score on applications, eviction rate, late-payment / NSF rate, and stable-employment percentage? A property-management company in the area should have these aggregated.
- How much new apartment / multifamily construction is in the pipeline within 1–3 miles? Heavy new supply (>2% of stock underway) typically softens rents 12–24 months out; light construction supports rent growth.
Investment metrics
- 1% rule
- 1.14% ✓
- Cap rate
- 8.51%
- Cash-on-cash
- 7.93%
- DSCR
- 1.35
- GRM
- 7.3
CMA / ARV
- ARV (on-the-fly)
- $195,624
- Comps found
- 9
Show comp detail 9 sales within ~0.75 mi
| Address | Dist | Beds/Ba | Sqft | Sold | Price | $/sf | Match |
|---|---|---|---|---|---|---|---|
| 8230 Reed Ave | 0.09mi | 6/3.0 | 2,676 (+7%) | 0mo | $245,000 | $92 | 84 |
| 4904 Donovan Dr | 0.09mi | 6/2.0 | 2,262 (-10%) | 2mo | $172,000 | $76 | 74 |
| 4769 E 90th St | 0.36mi | 5/2.0 (-1) | 2,416 (-4%) | 6mo | $190,000 | $79 | 63 |
| 8102 Grand Division Ave | 0.46mi | 6/3.0 | 2,560 (+2%) | 19mo | $155,000 | $61 | 60 |
| 4633 Warner Rd | 0.42mi | 6/2.0 | 2,268 (-10%) | 2mo | $177,700 | $78 | 58 |
| 8230 Crudele Dr | 0.03mi | 6/2.0 | 2,184 (-13%) | 18mo | $190,000 | $87 | 58 |
| 4899 E 96th St | 0.56mi | 5/2.0 (-1) | 2,548 (+2%) | 8mo | $198,000 | $78 | 56 |
| 4818 E 86th St | 0.20mi | 6/2.0 | 2,240 (-11%) | 16mo | $170,000 | $76 | 55 |
| 4885 E 94th St | 0.46mi | 6/2.0 | 2,784 (+11%) | 21mo | $171,500 | $62 | 39 |
Match score weights: distance 35% · size 25% · config 20% · recency 20%. Top-matched comps best support the ARV.
Projected returns pro-forma
-3.0% appreciation · 4.8% rent growth · sell at horizon
- IRR
- -2.1%
- Equity multiple
- 0.92×
- Total profit
- $-6,128
- Equity at exit
- $40,243
- IRR
- 9.5%
- Equity multiple
- 1.80×
- Total profit
- $60,258
- Equity at exit
- $23,336
Cash invested: $75,572 (down + closing). Projections, not guarantees.
Landlord ↔ Tenant lean methodology
- Overall (STATE)
- 73 Landlord-Friendly
- State Ohio
- 73 Landlord-Friendly · R+6
- County
- — inherits STATE
- City
- — inherits STATE
ZIP-level market 44125
- Rents YoY
- 4.8%
- Active inventory
- 120
- Price-to-rent
- 14.6×
Monthly cashflow live
- Estimated rent
- $3,089 high interval (Pro) →
- Mortgage (P&I)
- −$1,415
- Tax from tax record
- −$413 /mo · $4,954/yr
- Insurance
- −$112
- HOA
- −$0
- Vacancy / Maint / Mgmt
- −$649
- Net cashflow
- $500
Break-even live
2-unit breakdown (identical units grouped — click to expand)
| Units | Beds | Baths | Est. rent |
|---|---|---|---|
| 2× units | 3.0 | 1.5 | $3,088 |
| #1 | 3.0 | 1.5 | $1,544 |
| #2 | 3.0 | 1.5 | $1,544 |
| Total (2 units) | $3,089 | ||
UW: 25.0% down · 7.5% · 30yr · 1.5% tax · 5.0% vac · 8.0% maint · 8.0% mgmt
Financing live
Cash to close
- Down payment
- $67,475
- Closing costs
- $8,097
- Reserves months
- —
- Total cash needed
- —
Loan-product check · same deal, 3 products live
Conventional
25% down · 7.5% · 30yr
- Down + closing
- —
- Monthly P&I
- —
- Monthly cashflow
- —
- DSCR
- —
- Eligible?
- —
Personal DTI + credit; lowest rate.
DSCR
20% down · 8.5% · 30yr
- Down + closing
- —
- Monthly P&I
- —
- Monthly cashflow
- —
- DSCR
- —
- Eligible?
- —
No personal income docs; deal must DSCR.
Hard money
10% down · 12.0% · 12mo
- Down + closing
- —
- Monthly P&I
- —
- Monthly cashflow
- —
- DSCR
- —
- Eligible?
- —
Short-term bridge; refi at stabilization.
Listing history 24 events
-
2026-02-13status Pending
-
2026-02-06$269,900 Active
-
2023-07-31soldstatus $165,000
-
2023-07-28soldstatus $165,000 Closed 616-char remark
Show marketing remark (616 chars)
Great investment opportunity available in this partially occupied duplex! The large property has 2 units, each with 3 bedrooms and 1 bath, separate entrances and basements! Unit 8217 is tenant occupied, renting for $1050/month on a month to month lease. Unit 8215 is vacant and mostly rent ready! There are vinyl windows throughout and a detached 2-car garage for convenient off-street parking! Great high demand location close to parks, schools, public transit, easy highway access, shopping and more! Don't miss your chance at adding solid value to your portfolio - schedule a showing to see this one for yourself!
-
2023-07-10status Pending 616-char remark
Show marketing remark (616 chars)
Great investment opportunity available in this partially occupied duplex! The large property has 2 units, each with 3 bedrooms and 1 bath, separate entrances and basements! Unit 8217 is tenant occupied, renting for $1050/month on a month to month lease. Unit 8215 is vacant and mostly rent ready! There are vinyl windows throughout and a detached 2-car garage for convenient off-street parking! Great high demand location close to parks, schools, public transit, easy highway access, shopping and more! Don't miss your chance at adding solid value to your portfolio - schedule a showing to see this one for yourself!
-
2023-06-29$180,000 Active 616-char remark
Show marketing remark (616 chars)
Great investment opportunity available in this partially occupied duplex! The large property has 2 units, each with 3 bedrooms and 1 bath, separate entrances and basements! Unit 8217 is tenant occupied, renting for $1050/month on a month to month lease. Unit 8215 is vacant and mostly rent ready! There are vinyl windows throughout and a detached 2-car garage for convenient off-street parking! Great high demand location close to parks, schools, public transit, easy highway access, shopping and more! Don't miss your chance at adding solid value to your portfolio - schedule a showing to see this one for yourself!
-
2018-04-27soldstatus $63,000 Sold
-
2018-04-27soldstatus $63,000
-
2018-04-06status Pending
-
2018-04-05$69,900 Active
-
2018-03-19status Pending
-
2018-03-19historical
-
2018-03-13historical Contingent
-
2018-01-12status Active
-
2017-11-22status Pending
-
2017-11-06$69,900 Active
-
2000-06-09soldstatus $144,900
-
2000-05-12historical
-
2000-03-14$144,900
-
1995-09-12soldstatus $111,000
-
1995-09-11soldstatus $111,000
-
1995-06-13$117,500
-
1990-07-03soldstatus $95,000
-
1978-03-01soldstatus $65,500
ⓘ Source: listings_history table (triggers on properties + properties_extension) + one-shot
backfill from property_details.listing_events for pre-trigger history.
Tax reassessment forecast OH · Partial reset (capped growth)
- Current annual tax
- $4,954 · $413/mo
- Projected year-2 tax
- $4,954 · $413/mo
- Expected delta
- $0/yr ($0/mo · 0.0%)
ⓘ Screening estimate from a state-policy table — verify with the county assessor before closing.
Climate risk First Street
- Flood 1/10 Low FEMA zone X (unshaded) · 0% chance over 30 yrs
- Wildfire 1/10 Low
- Heat 3/10 Moderate 7 d/yr ≥96°F today · 17 d/yr by 30 yrs out
- Wind 1/10 Low
- Air quality 3/10 Moderate 2 unhealthy d/yr today · 3 by 30 yrs out
Nearby sold comps map
Loading sold comps map…
Walkable amenities ~0.75 mi
Loading nearby amenities…
Taxation est. · year 1
- Rental income
- $37,068
- − Mortgage interest
- −$15,119
- − Property taxes
- −$4,954
- − Insurance
- −$1,350
- − Repairs & maintenance
- −$2,965
- − Management
- −$2,965
- − Depreciation
- −$7,852
- Taxable income
- $1,863
- Est. tax owed @ 24.0%
- −$447
- After-tax cash flow
- $5,548/yr
For passive investors: Depreciation is non-cash, so a rental often shows a tax loss while cash-flowing — sheltering income. Rental losses are passive: they offset passive income freely, and up to $25,000/yr can offset ordinary (W-2) income if you actively participate and your MAGI is under $100k (phasing out to $0 by $150k); unused losses carry forward. On sale, claimed depreciation is recaptured at up to 25%, and gains may owe capital-gains tax (a 1031 exchange can defer both). Figures are a year-1 estimate at your 24.0% rate — not tax advice; consult a CPA.
Schools (NCES district)
- District
- Garfield Heights City Schools
- NCES district ID
- 3904404
- Math proficiency
- 8% ▼ -19.00%
- Reading proficiency
- 22% ▼ -18.00%
- Median HH income
- $41,334
- Composite
- 12.88/100
- National rank
- #9590
- State rank
- #643 of 656 in OH
Livability — Garfield Heights
- Score
- 67/100
- State rank
- #593
- US rank
- #10152
Category grades
Schools grade is shown separately in the Schools card above.
Census & demographics
- Census place
- Garfield Heights, OH
- County
- Cuyahoga County · 1,090,369 people
- City population
- 29,461
- Metro
- Cleveland-Elyria, OH
- Population (ZIP)
- 29,461
- Household income
- $57,363
- Rent vs Own
- Severe rent burden
- 1738.0
Population outlook (Cuyahoga County) Hauer SSP2
- Today (2025)
- 1,244,621 people
- By 2030
- 1,230,093 · -1.2%
- By 2040
- 1,189,108 · -4.5%
- By 2050
- 1,145,706 · -7.9%
- By 2075
- 1,076,557 · -13.5%
- By 2100
- 978,987 · -21.3%
Race, ethnicity, and origin ACS 2023
- Neighborhood character
- Diverse neighborhood (Simpson 0.61)
- Race & ethnicity
- Black 47% White 41% Two or more races 7% Hispanic / Latino 6%
- Hispanic origin (detail)
- Mexican 2% Puerto Rican 3%
- Common ancestry
- Romanian 11% Slovak 1% Lithuanian 1%
- Foreign-born
- 3% · Canada
- Languages at home
- 94% English-only · Spanish 4% Russian/Polish/Slavic 1%
Political lean MEDSL · Cuyahoga
- 2024 margin
- Solid D (+31.5) · D 65.4% · R 33.9%
- 2008→2024 swing
- -7.4pp toward R · 2008: 38.9pp · 2024: 31.5pp
- All cycles
- 2024: D+31.5 2020: D+34.1 2016: D+35.0 2012: D+38.7 2008: D+38.9
Not yet ingested
- Civics
- —
Market trends
- HPI YoY
- ▼ -116.98%
- Current HPI
- 155.1507
- Rent YoY
- ▲ 4.80%
- Metro
- Cleveland-Elyria, OH
- State GDP YoY
- ▲ 1.98%
- F500 in state
- 48
Industry mix (Fortune 500 HQ in OH)
| Industry | F500 HQs | Revenue |
|---|---|---|
| Insurance | 3 | $145B |
|
||
| Industrial Machinery | 3 | $49B |
|
||
| Financial Services | 3 | $24B |
|
||
| Consumer Goods | 2 | $93B |
|
||
| Aerospace / Defense | 2 | $47B |
|
||
| Utilities | 2 | $33B |
|
||
Price history
+312.1% since first listed24 events — show timeline
- 2026-02-13 Pending — MLSNOW
- 2026-02-06 Listed $269,900 MLSNOW
- 2023-07-31 Sold (Public Records) $165,000 Public Records
- 2023-07-28 Sold (MLS) $165,000 MLSNOW
- 2023-07-10 Pending — MLSNOW
- 2023-06-29 Listed $180,000 MLSNOW
- 2018-04-27 Sold (Public Records) $63,000 Public Records
- 2018-04-27 Sold (MLS) $63,000 MLSNOW
- 2018-04-06 Pending — MLSNOW
- 2018-04-05 Listed $69,900 MLSNOW
- 2018-03-19 Pending — MLSNOW
- 2018-03-19 Listing Removed — MLSNOW
- 2018-03-13 Contingent — MLSNOW
- 2018-01-12 Relisted — MLSNOW
- 2017-11-22 Pending — MLSNOW
- 2017-11-06 Listed $69,900 MLSNOW
- 2000-06-09 Sold (Public Records) $144,900 Public Records
- 2000-05-12 Listing Removed — MLSNOW
- 2000-03-14 Listed $144,900 MLSNOW
- 1995-09-12 Sold (MLS) $111,000 MLSNOW
- 1995-09-11 Sold (Public Records) $111,000 Public Records
- 1995-06-13 Listed $117,500 MLSNOW
- 1990-07-03 Sold (Public Records) $95,000 Public Records
- 1978-03-01 Sold (Public Records) $65,500 Public Records
Property tax history
+1.3%/yrLatest (2025): $4,954 · -19.3% YoY. Source: county tax records.
Cash-flow waterfall
monthlySold comps — $/sqft
last 12 mo · ≤1 miLoading sold comps…