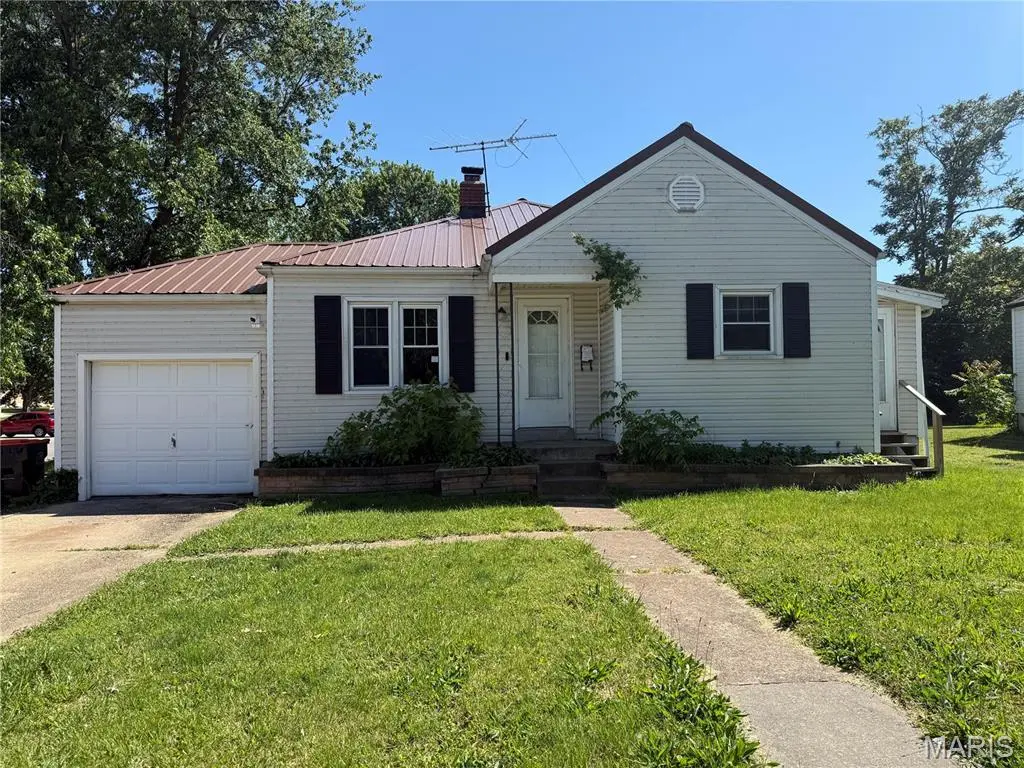
11 Greenwood Dr · Lebanon, MO
Flood risk 1/10 · Minimal
- FEMA flood zone
- X (unshaded)
- Chance of flooding over 30 yrs
- 0.0%
- Est. flood insurance / yr
- $507 – $1,088
Fire risk 5/10 · Moderate
- Est. fire insurance / yr
- $1,054 – $1,958
Heat risk 5/10 · Moderate
- Hot days now (above 106°F)
- 7 days/yr
- Hot days in 30 yrs
- 19 days/yr
Wind risk 2/10 · Minimal
- Chance of severe wind over 30 yrs
- 1.0%
Air-quality risk 1/10 · Minimal
- Unhealthy air days now
- 0 days/yr
- Unhealthy air days in 30 yrs
- 0 days/yr
Risk factors via First Street. Map © Google.
Why this score? — see what drove the B- grade
The composite is a weighted blend of 9 inputs, each scored 0–100. Each bar is that input's sub-score; the figure is the points it added to the 100-point composite (weight × sub-score).
- Cash flow +30.0/30.0
- DSCR +10.0/10.0
- 1% rule +8.9/10.0
- ARV discount +7.5/15.0
- Livability +3.2/5.0
- Schools +2.7/10.0
- Rent growth +2.5/5.0
- Condition / age +2.5/5.0
- Appreciation +0.0/10.0
$76,000
🖨 Deal sheet 📄 Offer letter ✓ Due diligence
Listing remarks MLS
You will not be disappointed in this spacious home priced to sell. This 3 bedroom 2 bath home has an extra room for a 2nd living room/office/playroom or dining room and an additional sunroom that could be used for a 4th bedroom if needed. This home has vinyl siding and all of the windows have been updated. Although it does have a full utility basement with a utility sink the laundry is located conveniently on the main level. The newer HVAC unit is all electric as well as the hot water heater. Some of the home has the original hardwood, trim and doors and adds so much character! There is an attached 1 car garage to the home but this property also has an additional 2 car garage/shop building with entrance off the side street. The attic is very large with plenty of additional storage area. With a fenced back yard it is perfect for all your needs. If you are looking for a home with plenty of room and not a lot of money, this it! Call to see before it is too late!
Key facts
- Large living area
- Sunroom
- Hardwood floors
Tags
Property features AI
Finance
- Financial info: Owned by bank; Lease not considered
Exterior
- Parking: Three-car garage
- Utilities: Public water; Public sewer; Electricity available
- Home design: Single-family residence; One level
- Construction: Vinyl siding
- Exterior features: City lot; Corner lot
Interior
- Kitchen: Dishwasher, Electric range, Refrigerator
- Bedrooms: Three bedrooms on the main level
- Bathrooms: Three full bathrooms (main level)
- Heating & cooling: Electric forced-air heating; Ceiling fans; Window AC units
- Interior features: Unfinished basement; Dishwasher; Electric range; Refrigerator
Neighborhood map
What this means for you Summary
Snapshot
- This is a 2-bed/3.0-bath other listed at $76k.
Deal economics
- At list price, monthly cash flow is $344 ($4k/yr) — positive.
- The deal already cash-flows at list — no discount required.
- Meets the 1% rule at list price ($1k rent vs $76k).
- Cap rate 11.7% vs local median 3.7% in Lebanon — top-decile yield for the area; either an underpriced asset or a hidden risk that comps aren't pricing in. Stress-test before assuming the spread holds.
Location & tenants
- Location reads 64/100 on livability (#308 in MO) — a middle-class / working-renter tenant base. Strengths: cost of living A+, housing A+, health & safety A-; Watch: crime D, amenities F, commute F.
- Lebanon R-III (town): math 29% / reading 35% proficiency, ranked #256 of 324 in MO (top 79%) — families likely to look elsewhere, expect single-tenant / working-renter base with shorter leases.
- Zoned schools: Lebanon Sr. High (math 16% / reading 34%, grade F, #435 of 521 statewide, top 83%, 1,474 students, 50% FRL) — zoned schools at 50% FRL track the district average.
- Market conditions: 256 active listings in the ZIP; 61 units permitted in Laclede County in 2024 (0 in 5+ unit buildings).
Forward outlook
- Local home prices are declining (-3.0%/yr); year-one equity from $525 of loan paydown is wiped out by about $2k of value loss. Plan a longer hold.
- Laclede County population projected at -13% by 2050 — secular population decline; favor cash flow + early exit over multi-decade hold.
- At projected returns (-3.0% appreciation + 3.0% rent growth), your $21k cash investment doubles in ~7 years — after that, you're playing with house money.
Negotiation context
- Only 7 days on market — expect competitive offers; lowballing is unlikely to land.
Risks & watch-outs
- Watch-outs: built in 1941 — expect roof / HVAC / electrical / plumbing capex.
- Climate carrying-cost: moderate wildfire risk; extreme-heat days projected 7→19/yr by 2055 (HVAC capex compounding) — expect insurance premiums to compound above CPI over the hold.
Questions for the listing agent
- Built in 1941 — when were the roof, HVAC, electrical panel, plumbing, and water heater last replaced?
- Is there a deadline driving the sale (1031 exchange, divorce, estate, relocation)? That informs how much negotiation room exists.
- Schools are D-rated, which usually means shorter tenancies and higher turnover. Who's the typical renter profile here, and what's been the actual vacancy rate?
- Crime grade is D in this area — have there been break-ins, vandalism, or insurance claims at this property in the last 3 years? What carrier currently insures it and at what premium?
- What's the average days-on-market for RENTAL listings here right now (not sales)? A rising rental-DOM trend means longer vacancies and softer asking-rent achievability than the comps imply.
- What's the recent tenant-quality profile in this submarket — average credit score on applications, eviction rate, late-payment / NSF rate, and stable-employment percentage? A property-management company in the area should have these aggregated.
- How much new for-sale + rental construction is in the pipeline within 1–3 miles? Heavy new supply typically softens prices + rents 12–24 months out; constrained supply supports both.
Investment metrics
- 1% rule
- 1.39% ✓
- Cap rate
- 11.72%
- Cash-on-cash
- 19.40%
- DSCR
- 1.86
- GRM
- 6.0
CMA / ARV
No comps found within radius.
Projected returns pro-forma
-3.0% appreciation · 3.0% rent growth · sell at horizon
- IRR
- 11.4%
- Equity multiple
- 1.45×
- Total profit
- $9,591
- Equity at exit
- $11,332
- IRR
- 20.4%
- Equity multiple
- 2.72×
- Total profit
- $36,544
- Equity at exit
- $6,571
Cash invested: $21,280 (down + closing). Projections, not guarantees.
Landlord ↔ Tenant lean methodology
- Overall (STATE)
- 81 Strongly Landlord-Friendly
- State Missouri
- 81 Strongly Landlord-Friendly · R+10
- County
- — inherits STATE
- City
- — inherits STATE
ZIP-level market 65536
- Home prices YoY
- -21.8%
- Active inventory
- 256
- Price-to-rent
- 6.0×
Monthly cashflow live
- Estimated rent
- $1,057 medium interval (Pro) →
- Mortgage (P&I)
- −$399
- Tax from tax record
- −$61 /mo · $726/yr
- Insurance
- −$32
- HOA
- −$0
- Vacancy / Maint / Mgmt
- −$222
- Net cashflow
- $344
Break-even live
UW: 25.0% down · 7.5% · 30yr · 1.5% tax · 5.0% vac · 8.0% maint · 8.0% mgmt
Financing live
Cash to close
- Down payment
- $19,000
- Closing costs
- $2,280
- Reserves months
- —
- Total cash needed
- —
Loan-product check · same deal, 3 products live
Conventional
25% down · 7.5% · 30yr
- Down + closing
- —
- Monthly P&I
- —
- Monthly cashflow
- —
- DSCR
- —
- Eligible?
- —
Personal DTI + credit; lowest rate.
DSCR
20% down · 8.5% · 30yr
- Down + closing
- —
- Monthly P&I
- —
- Monthly cashflow
- —
- DSCR
- —
- Eligible?
- —
No personal income docs; deal must DSCR.
Hard money
10% down · 12.0% · 12mo
- Down + closing
- —
- Monthly P&I
- —
- Monthly cashflow
- —
- DSCR
- —
- Eligible?
- —
Short-term bridge; refi at stabilization.
Listing history 3 events
-
2026-05-13$76,000 Active 721-char remark
-
2019-10-15soldstatus 984-char remark
Show marketing remark (984 chars)
You will not be disappointed in this spacious home priced to sell. This 3 bedroom 2 bath home has an extra room for a 2nd living room/office/playroom or dining room and an additional sunroom that could be used for a 4th bedroom if needed. This home has vinyl siding and all of the windows have been updated. Although it does have a full utility basement with a utility sink the laundry is located conveniently on the main level. The newer HVAC unit is all electric as well as the hot water heater. Some of the home has the original hardwood, trim and doors and adds so much character! There is an attached 1 car garage to the home but this property also has an additional 2 car garage/shop building with entrance off the side street. The attic is very large with plenty of additional storage area. With a fenced back yard it is perfect for all your needs. If you are looking for a home with plenty of room and not a lot of money, this it! Call to see before it is too late!
-
2003-10-27soldstatus
ⓘ Source: listings_history table (triggers on properties + properties_extension) + one-shot
backfill from property_details.listing_events for pre-trigger history.
Tax reassessment forecast MO · Resets to sale price
- Current annual tax
- $726 · $61/mo
- Projected year-2 tax
- $737 · $61/mo
- Expected delta
- +$11/yr (+$1/mo · 1.5%)
ⓘ Screening estimate from a state-policy table — verify with the county assessor before closing.
Climate risk First Street
- Flood 1/10 Low FEMA zone X (unshaded) · 0% chance over 30 yrs
- Wildfire 5/10 Major
- Heat 5/10 Major 7 d/yr ≥106°F today · 19 d/yr by 30 yrs out
- Wind 2/10 Low 100% chance of damaging wind over 30 yrs
- Air quality 1/10 Low 0 unhealthy d/yr today · 0 by 30 yrs out
Nearby sold comps map
Loading sold comps map…
Walkable amenities ~0.75 mi
Loading nearby amenities…
Taxation est. · year 1
- Rental income
- $12,680
- − Mortgage interest
- −$4,257
- − Property taxes
- −$726
- − Insurance
- −$380
- − Repairs & maintenance
- −$1,014
- − Management
- −$1,014
- − Depreciation
- −$2,211
- Taxable income
- $3,077
- Est. tax owed @ 24.0%
- −$738
- After-tax cash flow
- $3,390/yr
For passive investors: Depreciation is non-cash, so a rental often shows a tax loss while cash-flowing — sheltering income. Rental losses are passive: they offset passive income freely, and up to $25,000/yr can offset ordinary (W-2) income if you actively participate and your MAGI is under $100k (phasing out to $0 by $150k); unused losses carry forward. On sale, claimed depreciation is recaptured at up to 25%, and gains may owe capital-gains tax (a 1031 exchange can defer both). Figures are a year-1 estimate at your 24.0% rate — not tax advice; consult a CPA.
Schools (NCES district)
- District
- Lebanon R-III
- NCES district ID
- 2918270
- Math proficiency
- 29% ▼ -10.00%
- Reading proficiency
- 35% ▼ -8.00%
- Median HH income
- $38,352
- Composite
- 26.73/100
- National rank
- #7145
- State rank
- #256 of 324 in MO
Livability — Lebanon
- Score
- 64/100
- State rank
- #308
- US rank
- #14040
Category grades
Schools grade is shown separately in the Schools card above.
Census & demographics
- Census place
- Lebanon, MO
- County
- Laclede County · 29,915 people
- City population
- 29,915
- Metro
- Lebanon, MO
- Population (ZIP)
- 29,915
- Household income
- $53,783
- Rent vs Own
- Severe rent burden
- 641.0
Population outlook (Laclede County) Hauer SSP2
- Today (2025)
- 34,730 people
- By 2030
- 33,985 · -2.1%
- By 2040
- 32,213 · -7.2%
- By 2050
- 30,189 · -13.1%
- By 2075
- 24,782 · -28.6%
- By 2100
- 18,554 · -46.6%
Race, ethnicity, and origin ACS 2023
- Neighborhood character
- Predominantly White (90%)
- Race & ethnicity
- White 90% Two or more races 6% Hispanic / Latino 3%
- Common ancestry
- Lithuanian 2% Iranian 2% Italian 2%
- Foreign-born
- 2% · Canada
- Languages at home
- 97% English-only · Spanish 2% German/W. Germanic 1%
Political lean MEDSL · Laclede
- 2024 margin
- Solid R (+66.8) · D 16.1% · R 82.9%
- 2008→2024 swing
- +212.7pp toward D · 2008: -279.5pp · 2024: -66.8pp
- All cycles
- 2024: R+66.8 2020: R+65.4 2016: R+64.5 2012: R+44.5 2008: R+279.5
Not yet ingested
- Civics
- —
Market trends
- HPI YoY
- ▼ -54.82%
- Current HPI
- 196.7643
- Rent YoY
- —
- Metro
- Lebanon, MO
- State GDP YoY
- ▲ 1.84%
- F500 in state
- 20
Industry mix (Fortune 500 HQ in MO)
| Industry | F500 HQs | Revenue |
|---|---|---|
| Healthcare | 1 | $163B |
|
||
| Insurance | 1 | $21B |
|
||
| Industrial Technology | 1 | $17B |
|
||
| Retail | 1 | $16B |
|
||
| Industrial Distribution | 1 | $10B |
|
||
| Utilities | 1 | $9B |
|
||
Price history
5 events — show timeline
- 2026-06-12 Sold (MLS) — MARIS as Distributed by MLS Grid
- 2026-05-20 Pending — MARIS as Distributed by MLS Grid
- 2026-05-13 Listed $76,000 MARIS as Distributed by MLS Grid
- 2019-10-15 Sold (MLS) — MARIS as Distributed by MLS Grid
- 2003-10-27 Sold (Public Records) — Public Records
Property tax history
+2.4%/yrLatest (2025): $726 · +10.1% YoY. Source: county tax records.
Cash-flow waterfall
monthlySold comps — $/sqft
last 12 mo · ≤1 miLoading sold comps…