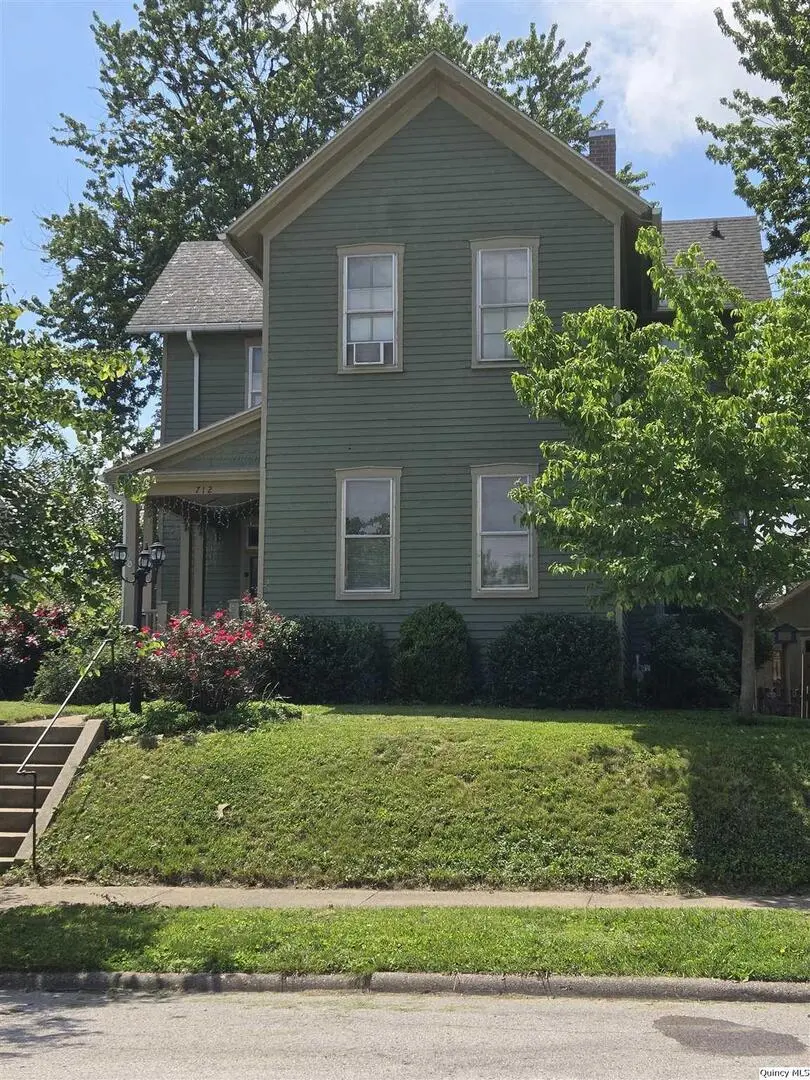
712 S 19th · Quincy, IL
Flood risk 1/10 · Minimal
- FEMA flood zone
- X (unshaded)
- Chance of flooding over 30 yrs
- 0.0%
- Est. flood insurance / yr
- $473 – $860
Fire risk 1/10 · Minimal
- Est. fire insurance / yr
- $804 – $1,492
Heat risk 4/10 · Minor
- Hot days now (above 106°F)
- 7 days/yr
- Hot days in 30 yrs
- 17 days/yr
Wind risk 2/10 · Minimal
- Chance of severe wind over 30 yrs
- —
Air-quality risk 2/10 · Minimal
- Unhealthy air days now
- 1 days/yr
- Unhealthy air days in 30 yrs
- 1 days/yr
Risk factors via First Street. Map © Google.
Why this score? — see what drove the D grade
The composite is a weighted blend of 9 inputs, each scored 0–100. Each bar is that input's sub-score; the figure is the points it added to the 100-point composite (weight × sub-score).
- Cash flow +14.1/30.0
- ARV discount +7.6/15.0
- Rent growth +5.0/5.0
- DSCR +4.3/10.0
- 1% rule +3.5/10.0
- Livability +3.4/5.0
- Condition / age +2.5/5.0
- Schools +2.2/10.0
- Appreciation +0.0/10.0
$169,900
🖨 Deal sheet (PDF) 📄 Offer letter ✓ Due diligence
Listing remarks
Welcome home to this 3 bed, 1 bath home in a quiet neighborhood! There are beautiful built-in's and exposed brick in several rooms that adds so much character and style. There are hardwood floors, tall ceilings and generously sized rooms. On the main floor there is a living room and den with an eat in kitchen, spacious pantry, laundry room and office. The den could be converted to a bedroom for the main level. The upper level offer 3 nice size bedrooms and a full bath. 1 bedroom has a built in bunk bed set. The basement is partially finished without egress windows. Outside you will find a screened in porch 11x22 with brick pavers, nice brick patio and lots of beautiful greenery and flowers
Key facts
- Screened in porch
- Spacious pantry
- Exposed brick
Tags
Property features AI
Finance
- Other: Possession at closing
Exterior
- Parking: Detached garage with alley access (1 garage space, 1 total parking)
- Utilities: Public water
- Home design: Detached single-family home; 2 stories
- Construction: Wood siding; Asphalt roof; Crawl space basement (partially finished/unfinished/partial)
- Exterior features: Patio; Porch; Fenced yard; Garden and landscaped lot; Pond on the property
Interior
- Kitchen: Range; Microwave; Refrigerator
- Bedrooms: 3 bedrooms (all on main level)
- Flooring: Hardwood flooring throughout most rooms; Carpet in the main-level utility room
- Bathrooms: 2 full bathrooms
- Heating & cooling: Forced air heating; Wall unit cooling
- Interior features: Ceiling fan(s); Water heater (gas); Internet (fiber)
- Laundry & utility: Washer and dryer; Main-level laundry; Utility room on main level
Neighborhood map
What this means for you Summary
Snapshot
- This is a 3-bed/1.0-bath single-family listed at $170k.
Deal economics
- At list price, monthly cash flow is $23 ($280/yr) — positive.
- The deal already cash-flows at list — no discount required.
- To meet the 1% rule (rent ≥ 1% of price), the offer needs to be $144k (15.4% below list).
- Recommended offer: $144k (15.4% below list) — sets the bar for 1% rule.
- Cap rate 6.5% vs local median 4.3% in Quincy — top-decile yield for the area; either an underpriced asset or a hidden risk that comps aren't pricing in. Stress-test before assuming the spread holds.
Location & tenants
- Location reads 67/100 on livability (#506 in IL) — a middle-class / working-renter tenant base. Strengths: cost of living A+, housing A+; Watch: crime D, employment D, amenities D-.
- Quincy SD 172 (town): math 24% / reading 27% proficiency, ranked #328 of 620 in IL (top 53%) — low school quality limits family demand, transient renter base, plan for 1-2y turnover.
- Zoned schools: Thomas S Baldwin Elem Sch (math 21% / reading 21%, grade F, #1,024 of 2,056 statewide, top 50%, 563 students, 0% FRL); Quincy Jr High School (math 25% / reading 30%, grade F, #295 of 665 statewide, top 45%, 1,348 students, 0% FRL); Quincy Sr High School (math 21% / reading 28%, grade F, #256 of 693 statewide, top 44%, 1,924 students, 0% FRL) — zoned schools average 0% FRL vs 48% district-wide (48 pts lower); this property's tenant base skews higher-income than the district average.
- Market conditions: Rents rising fast (+10.8%/yr); 180 active listings in the ZIP; 1 comparable units currently listed for rent nearby; 68 units permitted in Adams County in 2024 (0 in 5+ unit buildings).
- This rent runs 33% of the median local income ($52k/yr) — at the standard rent-burdened threshold; future hikes will face affordability resistance.
Forward outlook
- Local home prices are declining (-3.0%/yr); year-one equity from $1k of loan paydown is wiped out by about $5k of value loss. Plan a longer hold.
- Adams County population projected at -14% by 2050 — secular population decline; favor cash flow + early exit over multi-decade hold.
Negotiation context
- It's been on market 26 days — a 2% lower offer ($167k) is reasonable based on typical stale-listing flexibility.
Questions for the listing agent
- Is there a deadline driving the sale (1031 exchange, divorce, estate, relocation)? That informs how much negotiation room exists.
- Schools are D-rated, which usually means shorter tenancies and higher turnover. Who's the typical renter profile here, and what's been the actual vacancy rate?
- Crime grade is D in this area — have there been break-ins, vandalism, or insurance claims at this property in the last 3 years? What carrier currently insures it and at what premium?
- The area grade is low — what's the realistic commute time and amenity access for the typical tenant pool here? Any planned neighborhood developments (good or bad) we should know about?
- What's the average days-on-market for RENTAL listings here right now (not sales)? A rising rental-DOM trend means longer vacancies and softer asking-rent achievability than the comps imply.
- What's the recent tenant-quality profile in this submarket — average credit score on applications, eviction rate, late-payment / NSF rate, and stable-employment percentage? A property-management company in the area should have these aggregated.
- How much new for-sale + rental construction is in the pipeline within 1–3 miles? Heavy new supply typically softens prices + rents 12–24 months out; constrained supply supports both.
Investment metrics
- 1% rule
- 0.85% ✗
- Cap rate
- 6.46%
- Cash-on-cash
- 0.59%
- DSCR
- 1.03
- GRM
- 9.9
CMA / ARV
- ARV (on-the-fly)
- $170,429
- Comps found
- 12
Show comp detail 12 sales within ~0.75 mi
| Address | Dist | Beds/Ba | Sqft | Sold | Price | $/sf | Match |
|---|---|---|---|---|---|---|---|
| 704 S 16th St | 0.24mi | 3/2.5 | 1,810 (+3%) | 1mo | $175,000 | $97 | 77 |
| 1512 State St | 0.34mi | 2/1.0 (-1) | 1,600 (-9%) | 0mo | $148,000 | $93 | 64 |
| 716 S 17th St | 0.15mi | 2/1.0 (-1) | 1,499 (-15%) | 2mo | $125,000 | $83 | 61 |
| 2238 Hampshire St | 0.73mi | 3/1.5 | 1,746 (-1%) | 3mo | $210,000 | $120 | 60 |
| 828 S 11th St | 0.67mi | 4/1.0 (+1) | 1,718 (-2%) | 1mo | $140,500 | $82 | 59 |
| 2340 Jersey | 0.62mi | 3/2.5 | 1,802 (+3%) | 4mo | $285,000 | $158 | 58 |
| 607 S 17th St | 0.16mi | 2/2.0 (-1) | 1,510 (-14%) | 3mo | $122,000 | $81 | 58 |
| 820 S 16th St | 0.27mi | 4/2.0 (+1) | 1,540 (-12%) | 2mo | $175,000 | $114 | 57 |
| 1112 Payson Ave | 0.62mi | 4/1.0 (+1) | 1,645 (-6%) | 3mo | $157,000 | $95 | 53 |
| 2210 Jefferson St | 0.37mi | 4/1.5 (+1) | 2,005 (+14%) | 4mo | $150,000 | $75 | 49 |
| 2026 Hampshire St | 0.67mi | 3/2.0 | 1,595 (-9%) | 1mo | $245,000 | $154 | 49 |
| 2414 Monroe St | 0.62mi | 3/1.0 | 1,517 (-14%) | 2mo | $150,500 | $99 | 47 |
Match score weights: distance 35% · size 25% · config 20% · recency 20%. Top-matched comps best support the ARV.
Projected returns pro-forma
-3.0% appreciation · 8.0% rent growth · sell at horizon
- IRR
- -10.2%
- Equity multiple
- 0.61×
- Total profit
- $-18,463
- Equity at exit
- $25,333
- IRR
- 4.8%
- Equity multiple
- 1.43×
- Total profit
- $20,347
- Equity at exit
- $14,690
Cash invested: $47,572 (down + closing). Projections, not guarantees.
Landlord ↔ Tenant lean methodology
- Overall (STATE)
- 43 Moderately Tenant-Leaning
- State Illinois
- 43 Moderately Tenant-Leaning · D+7
- County
- — inherits STATE
- City
- — inherits STATE
ZIP-level market 62301
- Rents YoY
- 10.8%
- Active inventory
- 180
- Price-to-rent
- 9.9×
Monthly cashflow live
- Estimated rent
- $1,437 medium interval (Pro) →
- Mortgage (P&I)
- −$891
- Tax from tax record
- −$150 /mo · $1,805/yr
- Insurance
- −$71
- HOA
- −$0
- Vacancy / Maint / Mgmt
- −$302
- Net cashflow
- $23
Break-even live
Sensitivity live
| Price | -10% $120 | -5% $71 | +0% $23 | +5% $-25 | +10% $-73 |
|---|---|---|---|---|---|
| Rent | -10% $-90 | -5% $-33 | +0% $23 | +5% $80 | +10% $137 |
| Rate | -1.0pp $109 | -0.5pp $67 | base $23 | +0.5pp $-21 | +1.0pp $-65 |
UW: 25.0% down · 7.5% · 30yr · 1.5% tax · 5.0% vac · 8.0% maint · 8.0% mgmt
Financing live
Cash to close
- Down payment
- $42,475
- Closing costs
- $5,097
- Reserves months
- —
- Total cash needed
- —
Loan-product check · same deal, 3 products live
Conventional
25% down · 7.5% · 30yr
- Down + closing
- —
- Monthly P&I
- —
- Monthly cashflow
- —
- DSCR
- —
- Eligible?
- —
Personal DTI + credit; lowest rate.
DSCR
20% down · 8.5% · 30yr
- Down + closing
- —
- Monthly P&I
- —
- Monthly cashflow
- —
- DSCR
- —
- Eligible?
- —
No personal income docs; deal must DSCR.
Hard money
10% down · 12.0% · 12mo
- Down + closing
- —
- Monthly P&I
- —
- Monthly cashflow
- —
- DSCR
- —
- Eligible?
- —
Short-term bridge; refi at stabilization.
Rent comps 1 comps
| Address | Beds | Baths | Sqft | Rent | $/sqft | DOM | Units | Dist |
|---|---|---|---|---|---|---|---|---|
| 201 S 8th St Quincy, IL | 2.0 | 2.5 | 1785 | $1,800 | $1.01 | 45d | 1 | 1.06mi |
Listing history 16 events
-
2026-06-19days on market $169,900 Active 26 DOM
-
2026-06-18days on market $169,900 Active 25 DOM
-
2026-06-17days on market $169,900 Active 24 DOM
-
2026-06-16days on market $169,900 Active 23 DOM
-
2026-06-15days on market $169,900 Active 22 DOM
-
2026-06-14pricedays on market $169,900 Active 20 DOM
-
2026-06-12days on market $179,900 Active 19 DOM
-
2026-06-09days on market $179,900 Active 16 DOM
-
2026-06-08days on market $179,900 Active 15 DOM
-
2026-06-07days on market $179,900 Active 14 DOM
-
2026-06-03days on market $179,900 Active 10 DOM
-
2026-06-02days on market $179,900 Active 9 DOM
-
2026-06-01days on market $179,900 Active 8 DOM
-
2026-05-31days on market $179,900 Active 7 DOM
-
2026-05-30days on market $179,900 Active 6 DOM
-
2026-05-23$179,900 Active
ⓘ Source: listings_history table (triggers on properties + properties_extension) + one-shot
backfill from property_details.listing_events for pre-trigger history.
Tax reassessment forecast IL · Partial reset (capped growth)
- Current annual tax
- $1,805 · $150/mo
- Projected year-2 tax
- $2,831 · $236/mo
- Expected delta
- +$1,026/yr (+$85/mo · 56.8%)
ⓘ Screening estimate from a state-policy table — verify with the county assessor before closing.
Climate risk First Street
- Flood 1/10 Low FEMA zone X (unshaded) · 0% chance over 30 yrs
- Wildfire 1/10 Low
- Heat 4/10 Moderate 7 d/yr ≥106°F today · 17 d/yr by 30 yrs out
- Wind 2/10 Low
- Air quality 2/10 Low 1 unhealthy d/yr today · 1 by 30 yrs out
Nearby sold comps map
Loading sold comps map…
Walkable amenities ~0.75 mi
Loading nearby amenities…
Taxation est. · year 1
- Rental income
- $17,249
- − Mortgage interest
- −$9,517
- − Property taxes
- −$1,805
- − Insurance
- −$850
- − Repairs & maintenance
- −$1,380
- − Management
- −$1,380
- − Depreciation
- −$4,943
- Taxable loss
- −$2,625
- Est. tax savings @ 24.0%
- +$630
- After-tax cash flow
- $910/yr
For passive investors: Depreciation is non-cash, so a rental often shows a tax loss while cash-flowing — sheltering income. Rental losses are passive: they offset passive income freely, and up to $25,000/yr can offset ordinary (W-2) income if you actively participate and your MAGI is under $100k (phasing out to $0 by $150k); unused losses carry forward. On sale, claimed depreciation is recaptured at up to 25%, and gains may owe capital-gains tax (a 1031 exchange can defer both). Figures are a year-1 estimate at your 24.0% rate — not tax advice; consult a CPA.
Schools (NCES district)
- District
- Quincy SD 172
- NCES district ID
- 1733000
- Math proficiency
- 24% ▬ 0.00%
- Reading proficiency
- 27% ▬ 0.00%
- Median HH income
- $44,132
- Composite
- 21.91/100
- National rank
- #8229
- State rank
- #328 of 620 in IL
Livability — Quincy
- Score
- 67/100
- State rank
- #506
- US rank
- #10458
Category grades
Schools grade is shown separately in the Schools card above.
Census & demographics
- Census place
- Quincy, IL
- County
- Adams County · 30,746 people
- City population
- 30,746
- Metro
- Quincy, IL-MO
- Population (ZIP)
- 30,746
- Household income
- $52,055
- Rent vs Own
- Severe rent burden
- 1238.0
Population outlook (Adams County) Hauer SSP2
- Today (2025)
- 65,795 people
- By 2030
- 64,436 · -2.1%
- By 2040
- 61,007 · -7.3%
- By 2050
- 56,851 · -13.6%
- By 2075
- 46,424 · -29.4%
- By 2100
- 34,305 · -47.9%
Race, ethnicity, and origin ACS 2023
- Neighborhood character
- Predominantly White (84%)
- Race & ethnicity
- White 84% Two or more races 7% Black 6% Hispanic / Latino 3% Asian 1%
- Common ancestry
- Slovak 2% Iranian 1% Lithuanian 1%
- Foreign-born
- 2% · Canada
- Languages at home
- 96% English-only · Spanish 2%
Political lean MEDSL · Adams
- 2024 margin
- Solid R (+47.4) · D 25.6% · R 73.0% · Other 1.5%
- 2008→2024 swing
- -25.0pp toward R · 2008: -22.4pp · 2024: -47.4pp
- All cycles
- 2024: R+47.4 2020: R+46.5 2016: R+47.5 2012: R+35.2 2008: R+22.4
Not yet ingested
- Civics
- —
Market trends
- HPI YoY
- ▼ -121.44%
- Current HPI
- 131.7344
- Rent YoY
- ▲ 10.78%
- Metro
- Quincy, IL-MO
- State GDP YoY
- ▲ 1.59%
- F500 in state
- 60
Industry mix (Fortune 500 HQ in IL)
| Industry | F500 HQs | Revenue |
|---|---|---|
| Insurance | 4 | $201B |
|
||
| Consumer Goods | 4 | $87B |
|
||
| Industrial Machinery | 3 | $64B |
|
||
| Healthcare | 2 | $55B |
|
||
| Retail / Pharmacy | 1 | $148B |
|
||
| Agriculture / Food | 1 | $86B |
|
||
Price history
1 event — show timeline
- 2026-05-23 Listed $179,900 MRED as Distributed by MLS Grid
Property tax history
+2.8%/yrLatest (2023): $1,805 · +7.4% YoY. Source: county tax records.
Cash-flow waterfall
monthlySold comps — $/sqft
last 12 mo · ≤1 miLoading sold comps…