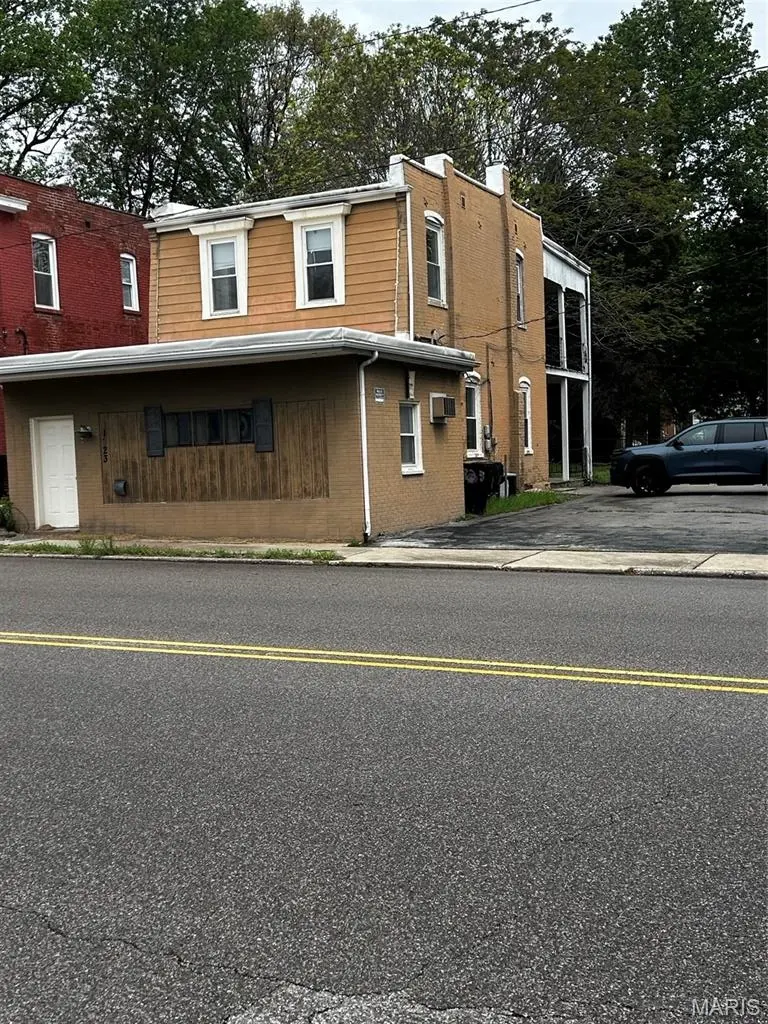
1823 W Main St · Belleville, IL
Flood risk No data
- FEMA flood zone
- —
- Chance of flooding over 30 yrs
- —
- Est. flood insurance / yr
- —
Fire risk No data
- Est. fire insurance / yr
- —
Heat risk No data
- Hot days now (above threshold)
- —
- Hot days in 30 yrs
- —
Wind risk No data
- Chance of severe wind over 30 yrs
- —
Air-quality risk No data
- Unhealthy air days now
- —
- Unhealthy air days in 30 yrs
- —
Risk factors via First Street. Map © Google.
Why this score? — see what drove the B- grade
The composite is a weighted blend of 9 inputs, each scored 0–100. Each bar is that input's sub-score; the figure is the points it added to the 100-point composite (weight × sub-score).
- Cash flow +30.0/30.0
- 1% rule +10.0/10.0
- DSCR +10.0/10.0
- ARV discount +7.5/15.0
- Livability +3.9/5.0
- Rent growth +3.6/5.0
- Schools +2.2/10.0
- Condition / age +2.2/5.0
- Appreciation +0.0/10.0
$45,000
🖨 Deal sheet (PDF) 📄 Offer letter ✓ Due diligence
Listing remarks
Opportunity is knocking with this 3-bedroom, 2-bath home ready for your vision and updates. Whether you’re an experienced investor or a buyer looking to build equity, this property offers a solid foundation for a rewarding renovation project. Featuring a functional layout, generous living space, and great bones, this home is primed for transformation. With the right updates, there’s strong potential for increased value and excellent return on investment. Situated in a desirable area with convenient access to local amenities, shopping, and dining, this property is perfectly positioned for resale or rental income. Bring your ideas and unlock the full potential of this diamond in t
Key facts
- 4,356 sq ft lot
- Built 1867
- Listed 3 days
Property features AI
Finance
- Financial info: Lease not considered
Exterior
- Utilities: Public water; Public sewer; Electric service provided by Ameren; Electricity available
- Home design: Single-family residence; Two levels; Owner by contract
- Construction: Concrete and stucco construction; Shingle roof
- Exterior features: Back yard; City street frontage
Interior
- Bedrooms: 3 bedrooms (all located on the upper level)
- Flooring: Hardwood; Laminate
- Bathrooms: 2 full bathrooms (one full bath on the main level, one full bath on the upper level)
- Heating & cooling: Natural gas heating; Central air conditioning
- Interior features: Hardwood and laminate flooring; No basement
Neighborhood map
What this means for you Summary
Snapshot
- This is a 3-bed/2.0-bath single-family listed at $45k. Condition is rated fair.
Deal economics
- At list price, monthly cash flow is $824 ($10k/yr) — positive.
- The deal already cash-flows at list — no discount required.
- Meets the 1% rule at list price ($1k rent vs $45k).
- Cap rate 28.3% vs local median 5.6% in Belleville — top-decile yield for the area; either an underpriced asset or a hidden risk that comps aren't pricing in. Stress-test before assuming the spread holds.
Location & tenants
- Location reads 78/100 on livability (#142 in IL, #2,604 nationally) — a middle-class / working-renter tenant base. Strengths: commute A+, cost of living A+, housing A+; Watch: crime F, amenities D-.
- Belleville Twp Hsd 201 (suburban): math 21% / reading 28% proficiency, ranked #308 of 620 in IL (top 50%) — low school quality limits family demand, transient renter base, plan for 1-2y turnover.
- Zoned schools: Belleville High School-West (math 19% / reading 26%, grade F, #317 of 693 statewide, top 46%, 2,234 students, 0% FRL).
- Market conditions: Rents rising fast (+4.6%/yr); 190 active listings in the ZIP; 6 comparable units currently listed for rent nearby; rentals at typical pace (median 19d on market — plan ~3-4 weeks tenant-placement turnaround); 783 units permitted in St. Clair County in 2024 (378 in 5+ unit buildings).
Forward outlook
- Local home prices are declining (-3.0%/yr); year-one equity from $311 of loan paydown is wiped out by about $1k of value loss. Plan a longer hold.
- St. Clair County population projected at -23% by 2050 — secular population decline; favor cash flow + early exit over multi-decade hold.
- At projected returns (-3.0% appreciation + 4.6% rent growth), your $13k cash investment doubles in ~2 years — after that, you're playing with house money.
Negotiation context
- Only 3 days on market — expect competitive offers; lowballing is unlikely to land.
Risks & watch-outs
- Watch-outs: built in 1867 — expect roof / HVAC / electrical / plumbing capex.
Questions for the listing agent
- Have any recent inspections been done? Can we get a copy of the seller's disclosures and any deferred-maintenance estimates?
- Built in 1867 — when were the roof, HVAC, electrical panel, plumbing, and water heater last replaced?
- Is there a deadline driving the sale (1031 exchange, divorce, estate, relocation)? That informs how much negotiation room exists.
- Crime grade is F in this area — have there been break-ins, vandalism, or insurance claims at this property in the last 3 years? What carrier currently insures it and at what premium?
- What's the average days-on-market for RENTAL listings here right now (not sales)? A rising rental-DOM trend means longer vacancies and softer asking-rent achievability than the comps imply.
- What's the recent tenant-quality profile in this submarket — average credit score on applications, eviction rate, late-payment / NSF rate, and stable-employment percentage? A property-management company in the area should have these aggregated.
- How much new for-sale + rental construction is in the pipeline within 1–3 miles? Heavy new supply typically softens prices + rents 12–24 months out; constrained supply supports both.
Investment metrics
- 1% rule
- 3.19% ✓
- Cap rate
- 28.26%
- Cash-on-cash
- 78.45%
- DSCR
- 4.49
- GRM
- 2.6
CMA / ARV
- ARV (on-the-fly)
- $144,750
- Comps found
- 12
Show comp detail 12 sales within ~0.75 mi
| Address | Dist | Beds/Ba | Sqft | Sold | Price | $/sf | Match |
|---|---|---|---|---|---|---|---|
| 18 S 21st St | 0.16mi | 4/2.5 (+1) | 1,929 (-0%) | 1mo | $157,500 | $82 | 85 |
| 604 N 17th St | 0.24mi | 3/2.0 | 1,925 (-0%) | 7mo | $146,000 | $76 | 83 |
| 207 S 17th St | 0.24mi | 3/2.0 | 1,997 (+4%) | 6mo | $10,000 | $5 | 78 |
| 209 N 14th St | 0.30mi | 3/2.0 | 2,040 (+6%) | 1mo | $40,000 | $20 | 76 |
| 6 Marian Ct | 0.26mi | 4/1.5 (+1) | 1,998 (+4%) | 10mo | $199,000 | $100 | 67 |
| 1305 Raab Ave | 0.45mi | 3/2.0 | 1,775 (-8%) | 4mo | $180,000 | $101 | 62 |
| 605 N 17th St | 0.22mi | 2/1.0 (-1) | 1,768 (-8%) | 6mo | $82,500 | $47 | 61 |
| 228 N 12th St | 0.41mi | 3/1.5 | 2,114 (+10%) | 9mo | $37,000 | $18 | 55 |
| 120 N 28th St | 0.56mi | 4/1.5 (+1) | 2,100 (+9%) | 2mo | $85,000 | $40 | 51 |
| 916 W Monroe St | 0.62mi | 2/1.0 (-1) | 1,820 (-6%) | 10mo | $36,000 | $20 | 45 |
| 508 W C St | 0.73mi | 3/1.5 | 1,674 (-13%) | 1mo | $125,000 | $75 | 41 |
| 100 Verne Ave | 0.64mi | 2/2.5 (-1) | 2,132 (+10%) | 8mo | $178,000 | $83 | 39 |
Match score weights: distance 35% · size 25% · config 20% · recency 20%. Top-matched comps best support the ARV.
Projected returns pro-forma
-3.0% appreciation · 4.56% rent growth · sell at horizon
- IRR
- 80.3%
- Equity multiple
- 4.77×
- Total profit
- $47,484
- Equity at exit
- $6,710
- IRR
- 84.1%
- Equity multiple
- 10.42×
- Total profit
- $118,691
- Equity at exit
- $3,891
Cash invested: $12,600 (down + closing). Projections, not guarantees.
Landlord ↔ Tenant lean methodology
- Overall (STATE)
- 43 Moderately Tenant-Leaning
- State Illinois
- 43 Moderately Tenant-Leaning · D+7
- County
- — inherits STATE
- City
- — inherits STATE
ZIP-level market 62226
- Rents YoY
- 4.6%
- Active inventory
- 190
- Price-to-rent
- 2.6×
Monthly cashflow live
- Estimated rent
- $1,436 high interval (Pro) →
- Mortgage (P&I)
- −$236
- Tax est. 1.5%
- −$56 /mo · $675/yr
- Insurance
- −$19
- HOA
- −$0
- Vacancy / Maint / Mgmt
- −$302
- Net cashflow
- $824
Break-even live
Sensitivity live
| Price | -10% $855 | -5% $839 | +0% $824 | +5% $808 | +10% $793 |
|---|---|---|---|---|---|
| Rent | -10% $710 | -5% $767 | +0% $824 | +5% $880 | +10% $937 |
| Rate | -1.0pp $846 | -0.5pp $835 | base $824 | +0.5pp $812 | +1.0pp $800 |
UW: 25.0% down · 7.5% · 30yr · 1.5% tax · 5.0% vac · 8.0% maint · 8.0% mgmt
Financing live
Cash to close
- Down payment
- $11,250
- Closing costs
- $1,350
- Reserves months
- —
- Total cash needed
- —
Loan-product check · same deal, 3 products live
Conventional
25% down · 7.5% · 30yr
- Down + closing
- —
- Monthly P&I
- —
- Monthly cashflow
- —
- DSCR
- —
- Eligible?
- —
Personal DTI + credit; lowest rate.
DSCR
20% down · 8.5% · 30yr
- Down + closing
- —
- Monthly P&I
- —
- Monthly cashflow
- —
- DSCR
- —
- Eligible?
- —
No personal income docs; deal must DSCR.
Hard money
10% down · 12.0% · 12mo
- Down + closing
- —
- Monthly P&I
- —
- Monthly cashflow
- —
- DSCR
- —
- Eligible?
- —
Short-term bridge; refi at stabilization.
Rent comps 6 comps
| Address | Beds | Baths | Sqft | Rent | $/sqft | DOM | Units | Dist |
|---|---|---|---|---|---|---|---|---|
| 109 S 13th St Belleville, IL | 3.0 | 1.5 | 1800 | $1,325 | $0.74 | 18d | 1 | 0.38mi |
| 310 N 10th St Belleville, IL | 2.0 | 1.0 | 1270 | $1,300 | $1.02 | 2d | 1 | 0.52mi |
| 1205 3rd Ave Belleville, IL | 4.0 | 2.0 | 1512 | $1,800 | $1.19 | 18d | 1 | 0.53mi |
| 618 W Monroe St Belleville, IL | 3.0 | 1.0 | 1500 | $1,050 | $0.70 | 24d | 1 | 0.87mi |
| 1912 N 17th St Swansea, IL | 2.0 | 1.0 | 1414 | $1,500 | $1.06 | 18d | 1 | 1.45mi |
| 1107 Bristow St Belleville, IL | 3.0 | 1.0 | 1238 | $1,500 | $1.21 | 13d | 1 | 1.47mi |
Listing history 2 events
-
2026-05-07status Pending
-
2026-05-04$45,000 Active
ⓘ Source: listings_history table (triggers on properties + properties_extension) + one-shot
backfill from property_details.listing_events for pre-trigger history.
Nearby sold comps map
Loading sold comps map…
Walkable amenities ~0.75 mi
Loading nearby amenities…
Taxation est. · year 1
- Rental income
- $17,236
- − Mortgage interest
- −$2,521
- − Property taxes
- −$675
- − Insurance
- −$225
- − Repairs & maintenance
- −$1,379
- − Management
- −$1,379
- − Depreciation
- −$1,309
- Taxable income
- $9,749
- Est. tax owed @ 24.0%
- −$2,340
- After-tax cash flow
- $7,545/yr
For passive investors: Depreciation is non-cash, so a rental often shows a tax loss while cash-flowing — sheltering income. Rental losses are passive: they offset passive income freely, and up to $25,000/yr can offset ordinary (W-2) income if you actively participate and your MAGI is under $100k (phasing out to $0 by $150k); unused losses carry forward. On sale, claimed depreciation is recaptured at up to 25%, and gains may owe capital-gains tax (a 1031 exchange can defer both). Figures are a year-1 estimate at your 24.0% rate — not tax advice; consult a CPA.
Condition & rehab AI · 6 photos
This 3-bedroom, 2-bath home requires moderate renovations to improve its condition and increase its value. Key areas for improvement include exterior siding, interior walls, and HVAC system. With proper updates, it has strong potential for increased resale or rental value.
Repairs flagged
- Major siding — Severe weathering
- Major interior walls — Peeling paint
- Major HVAC/mechanicals — Not visible
Value-add opportunities
- Both painting — Fresh paint enhances curb appeal and interior aesthetics
- Both landscaping — Well-maintained landscaping improves curb appeal and property value
- Both HVAC upgrade — Modern HVAC system improves comfort and energy efficiency
- Both exterior siding repair — New siding enhances curb appeal and structural integrity
Renovation cost estimate screening
| Repair item | Severity | Est. cost |
|---|---|---|
| siding · Severe weathering | Major | $15,000–50,000 |
| interior walls · Peeling paint | Major | $15,000–50,000 |
| HVAC/mechanicals · Not visible | Major | $15,000–50,000 |
| Total estimated repair cost · 3 items | $45,000–150,000 |
Value-add ROI direction
- Both painting — Fresh paint enhances curb appeal and interior aesthetics ↑
- Both landscaping — Well-maintained landscaping improves curb appeal and property value ↑
- Both HVAC upgrade — Modern HVAC system improves comfort and energy efficiency ↑
- Both exterior siding repair — New siding enhances curb appeal and structural integrity ↑
ⓘ Cost ranges are severity-bucket heuristics (US national rule-of-thumb). Get contractor quotes + a written scope before underwriting a rehab budget.
Schools (NCES district)
- District
- Belleville Twp Hsd 201
- NCES district ID
- 1705640
- Math proficiency
- 21% ▼ -8.00%
- Reading proficiency
- 28% ▼ -3.00%
- Median HH income
- $58,064
- Composite
- 22.39/100
- National rank
- #8115
- State rank
- #308 of 620 in IL
Livability — Belleville
- Score
- 78/100
- State rank
- #142
- US rank
- #2604
Category grades
Schools grade is shown separately in the Schools card above.
Census & demographics
- Census place
- Belleville, IL
- County
- Saint Clair County · 169,691 people
- City population
- 47,407
- Metro
- St. Louis, MO-IL
- Population (ZIP)
- 28,255
- Household income
- $70,797
- Rent vs Own
- Severe rent burden
- 824.0
Population outlook (St. Clair County) Hauer SSP2
- Today (2025)
- 250,366 people
- By 2030
- 240,511 · -3.9%
- By 2040
- 217,391 · -13.2%
- By 2050
- 192,699 · -23.0%
- By 2075
- 140,637 · -43.8%
- By 2100
- 100,499 · -59.9%
Race, ethnicity, and origin ACS 2023
- Neighborhood character
- Majority White (64%)
- Race & ethnicity
- White 64% Black 24% Two or more races 7% Hispanic / Latino 3% Asian 2%
- Common ancestry
- Romanian 4% Lithuanian 2% Slovak 2%
- Foreign-born
- 4% · Canada, China
- Languages at home
- 96% English-only · Chinese 1% Spanish 1%
Political lean MEDSL · St. Clair
- 2024 margin
- Lean D (+7.9) · D 53.0% · R 45.1% · Other 1.8%
- 2008→2024 swing
- -14.6pp toward R · 2008: 22.4pp · 2024: 7.9pp
- All cycles
- 2024: D+7.9 2020: D+8.7 2016: D+5.6 2012: D+14.5 2008: D+22.4
Not yet ingested
- Civics
- —
Market trends
- HPI YoY
- ▼ -83.57%
- Current HPI
- 133.9028
- Rent YoY
- ▲ 4.56%
- Metro
- St. Louis, MO-IL
- State GDP YoY
- ▲ 1.59%
- F500 in state
- 60
Industry mix (Fortune 500 HQ in IL)
| Industry | F500 HQs | Revenue |
|---|---|---|
| Insurance | 4 | $201B |
|
||
| Consumer Goods | 4 | $87B |
|
||
| Industrial Machinery | 3 | $64B |
|
||
| Healthcare | 2 | $55B |
|
||
| Retail / Pharmacy | 1 | $148B |
|
||
| Agriculture / Food | 1 | $86B |
|
||
Price history
2 events — show timeline
- 2026-05-07 Pending — MARIS as Distributed by MLS Grid
- 2026-05-04 Listed $45,000 MARIS as Distributed by MLS Grid
Cash-flow waterfall
monthlySold comps — $/sqft
last 12 mo · ≤1 miLoading sold comps…