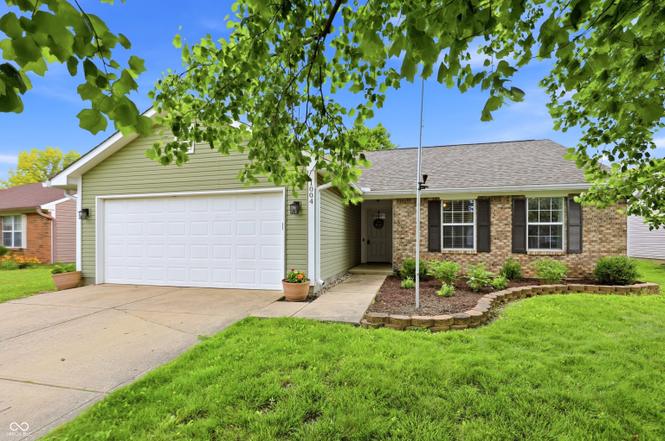
1004 Matterhorn Dr · Lebanon, IN
Flood risk 1/10 · Minimal
- FEMA flood zone
- X (unshaded)
- Chance of flooding over 30 yrs
- 0.0%
- Est. flood insurance / yr
- $507 – $1,088
Fire risk 1/10 · Minimal
- Est. fire insurance / yr
- $717 – $1,331
Heat risk 3/10 · Minor
- Hot days now (above 102°F)
- 7 days/yr
- Hot days in 30 yrs
- 18 days/yr
Wind risk 2/10 · Minimal
- Chance of severe wind over 30 yrs
- 0.0%
Air-quality risk 2/10 · Minimal
- Unhealthy air days now
- 1 days/yr
- Unhealthy air days in 30 yrs
- 2 days/yr
Risk factors via First Street. Map © Google.
Why this score? — see what drove the D grade
The composite is a weighted blend of 9 inputs, each scored 0–100. Each bar is that input's sub-score; the figure is the points it added to the 100-point composite (weight × sub-score).
- Cash flow +14.5/30.0
- ARV discount +6.8/15.0
- DSCR +4.4/10.0
- Schools +3.7/10.0
- 1% rule +3.3/10.0
- Livability +3.3/5.0
- Rent growth +2.5/5.0
- Condition / age +2.5/5.0
- Appreciation +0.0/10.0
$259,900
🖨 Deal sheet (PDF) 📄 Offer letter ✓ Due diligence
Listing remarks MLS
This beautiful 3 bedroom 2 bath ranch is move in ready with updates galore. You''ll love the open concept living space full of natural light. The cathedral ceilings and fireplace in the living room are perfect your family gatherings. The master bedroom has its own master suite with a large walk in closet. The house has new carpet throughout, new paint, indoor lighting has all been upgraded. All kitchen appliances, washer and dryer, and water softener are included. New roof 2017, new siding and exterior paint done 2018, ring doorbell stays with the home. TV, TV mounts, and curtains not included with home.
Key facts
- Open concept living
- Vaulted great room
- Private backyard
Tags
Property features AI
Finance
- HOA & community: Homeowners association with annual fee of $100; HOA governed by covenants and restrictions
Exterior
- Parking: Attached 2-car garage
- Utilities: Public water; Municipal sewer connected; Solid waste service available
- Home design: Single-family residence; One story; Faces south
- Construction: Brick and vinyl siding exterior; Slab foundation
- Exterior features: Covered patio; Mini barn; Privacy fencing around the yard; Sidewalks; Small trees (under 20 ft)
Interior
- Kitchen: Electric oven; Microwave with hood; Dishwasher; Garbage disposal; Refrigerator
- Bedrooms: Three bedrooms on the main level; Primary bedroom with walk-in closet
- Bathrooms: Two full bathrooms on the main level; Primary bath with full shower stall and suite layout
- Heating & cooling: Forced-air heating (natural gas); Central air conditioning
- Interior features: Vaulted ceilings; Walk-in closets; Gas-log fireplace
- Laundry & utility: Main-level laundry room; Washer and dryer included; Gas water heater; Owned water softener
Neighborhood map
What this means for you Summary
Snapshot
- This is a 3-bed/2.0-bath single-family listed at $260k.
Deal economics
- At list price, monthly cash flow is $59 ($705/yr) — positive.
- The deal already cash-flows at list — no discount required.
- To meet the 1% rule (rent ≥ 1% of price), the offer needs to be $215k (17.4% below list).
- Recommended offer: $215k (17.4% below list) — sets the bar for 1% rule.
- Cap rate 6.6% vs local median 3.6% in Lebanon — top-decile yield for the area; either an underpriced asset or a hidden risk that comps aren't pricing in. Stress-test before assuming the spread holds.
Location & tenants
- Location reads 66/100 on livability (#296 in IN) — a middle-class / working-renter tenant base. Strengths: cost of living A+, housing A+; Watch: amenities F, commute F, health & safety F.
- Lebanon Community School Corporation (town): math 41% / reading 44% proficiency, ranked #115 of 301 in IN (top 38%) — families likely to look elsewhere, expect single-tenant / working-renter base with shorter leases.
- Zoned schools: Harney Elementary School (math 32% / reading 28%, grade F, #693 of 994 statewide, top 70%, 504 students, 44% FRL); Lebanon Middle School (math 35% / reading 40%, grade F, #146 of 330 statewide, top 46%, 807 students, 46% FRL); Lebanon Senior High School (math 43% / reading 68%, grade C, #75 of 369 statewide, top 20%, 1,027 students, 38% FRL).
- Market conditions: 185 active listings in the ZIP; 12 comparable units currently listed for rent nearby; rentals at typical pace (median 17d on market — plan ~3-4 weeks tenant-placement turnaround); 898 units permitted in Boone County in 2024 (0 in 5+ unit buildings).
- This rent runs 37% of the median local income ($69k/yr) — at the standard rent-burdened threshold; future hikes will face affordability resistance.
Forward outlook
- Local home prices are declining (-3.0%/yr); year-one equity from $2k of loan paydown is wiped out by about $8k of value loss. Plan a longer hold.
- Boone County population projected at +46% by 2050 — long-run rental-demand tailwind backs the buy-and-hold thesis.
Negotiation context
- Only 3 days on market — expect competitive offers; lowballing is unlikely to land.
- 6 sale attempts since 26y ago with the ask held roughly flat each time — persistent listings suggest the price (not the market) is what's stuck; bring a comps-based counter.
- Current owner paid $155k; list at $260k implies a 68% gain — meaningful room to come down on a strong offer.
Questions for the listing agent
- What does the HOA fee cover, when was the last increase, and are there any pending special assessments or reserve-fund shortfalls?
- Is there a deadline driving the sale (1031 exchange, divorce, estate, relocation)? That informs how much negotiation room exists.
- The area grade is low — what's the realistic commute time and amenity access for the typical tenant pool here? Any planned neighborhood developments (good or bad) we should know about?
- What's the average days-on-market for RENTAL listings here right now (not sales)? A rising rental-DOM trend means longer vacancies and softer asking-rent achievability than the comps imply.
- What's the recent tenant-quality profile in this submarket — average credit score on applications, eviction rate, late-payment / NSF rate, and stable-employment percentage? A property-management company in the area should have these aggregated.
- How much new for-sale + rental construction is in the pipeline within 1–3 miles? Heavy new supply typically softens prices + rents 12–24 months out; constrained supply supports both.
Investment metrics
- 1% rule
- 0.83% ✗
- Cap rate
- 6.56%
- Cash-on-cash
- 0.97%
- DSCR
- 1.04
- GRM
- 10.1
CMA / ARV
- ARV (on-the-fly)
- $255,715
- Comps found
- 12
Show comp detail 12 sales within ~0.75 mi
| Address | Dist | Beds/Ba | Sqft | Sold | Price | $/sf | Match |
|---|---|---|---|---|---|---|---|
| 1010 Maple Dr W | 0.06mi | 3/2.0 | 1,304 (+2%) | 3mo | $260,000 | $199 | 92 |
| 2009 Jason Dr | 0.15mi | 3/2.0 | 1,296 (+1%) | 3mo | $225,000 | $174 | 89 |
| 2121 Jason Dr | 0.22mi | 3/2.0 | 1,216 (-5%) | 1mo | $250,000 | $206 | 80 |
| 2102 Yosemite Dr | 0.11mi | 3/2.0 | 1,400 (+9%) | 3mo | $263,000 | $188 | 77 |
| 816 Northfield Dr | 0.32mi | 3/1.5 | 1,268 (-1%) | 5mo | $252,000 | $199 | 76 |
| 2114 Hannah Ct | 0.45mi | 3/2.5 | 1,326 (+3%) | 2mo | $275,000 | $207 | 70 |
| 2114 Yosemite Dr | 0.13mi | 3/2.0 | 1,440 (+12%) | 7mo | $252,000 | $175 | 68 |
| 1020 Northfield Dr | 0.28mi | 3/2.0 | 1,435 (+12%) | 1mo | $253,864 | $177 | 66 |
| 1606 Ashley Dr | 0.52mi | 3/2.0 | 1,200 (-7%) | 4mo | $239,500 | $200 | 62 |
| 1701 Crimson Ln | 0.56mi | 3/2.0 | 1,166 (-9%) | 0mo | $199,000 | $171 | 58 |
| 1611 Garfield St | 0.40mi | 3/1.0 | 1,104 (-14%) | 0mo | $249,000 | $226 | 53 |
| 208 Tahoe Dr | 0.64mi | 3/2.0 | 1,417 (+10%) | 6mo | $310,000 | $219 | 48 |
Match score weights: distance 35% · size 25% · config 20% · recency 20%. Top-matched comps best support the ARV.
Projected returns pro-forma
-3.0% appreciation · 3.0% rent growth · sell at horizon
- IRR
- -14.8%
- Equity multiple
- 0.47×
- Total profit
- $-38,441
- Equity at exit
- $38,752
- IRR
- -6.2%
- Equity multiple
- 0.60×
- Total profit
- $-28,924
- Equity at exit
- $22,471
Cash invested: $72,772 (down + closing). Projections, not guarantees.
Landlord ↔ Tenant lean methodology
- Overall (STATE)
- 90 Strongly Landlord-Friendly
- State Indiana
- 90 Strongly Landlord-Friendly · R+11
- County
- — inherits STATE
- City
- — inherits STATE
ZIP-level market 46052
- Active inventory
- 185
- Price-to-rent
- 10.1×
Monthly cashflow live
- Estimated rent
- $2,146 high interval (Pro) →
- Mortgage (P&I)
- −$1,363
- Tax from tax record
- −$157 /mo · $1,890/yr
- Insurance
- −$108
- HOA
- −$8
- Vacancy / Maint / Mgmt
- −$451
- Net cashflow
- $59
Break-even live
Sensitivity live
| Price | -10% $206 | -5% $132 | +0% $59 | +5% $-15 | +10% $-88 |
|---|---|---|---|---|---|
| Rent | -10% $-111 | -5% $-26 | +0% $59 | +5% $143 | +10% $228 |
| Rate | -1.0pp $190 | -0.5pp $125 | base $59 | +0.5pp $-9 | +1.0pp $-77 |
UW: 25.0% down · 7.5% · 30yr · 1.5% tax · 5.0% vac · 8.0% maint · 8.0% mgmt
Financing live
Cash to close
- Down payment
- $64,975
- Closing costs
- $7,797
- Reserves months
- —
- Total cash needed
- —
Loan-product check · same deal, 3 products live
Conventional
25% down · 7.5% · 30yr
- Down + closing
- —
- Monthly P&I
- —
- Monthly cashflow
- —
- DSCR
- —
- Eligible?
- —
Personal DTI + credit; lowest rate.
DSCR
20% down · 8.5% · 30yr
- Down + closing
- —
- Monthly P&I
- —
- Monthly cashflow
- —
- DSCR
- —
- Eligible?
- —
No personal income docs; deal must DSCR.
Hard money
10% down · 12.0% · 12mo
- Down + closing
- —
- Monthly P&I
- —
- Monthly cashflow
- —
- DSCR
- —
- Eligible?
- —
Short-term bridge; refi at stabilization.
Rent comps 12 comps
| Address | Beds | Baths | Sqft | Rent | $/sqft | DOM | Units | Dist |
|---|---|---|---|---|---|---|---|---|
| 2102 Yosemite Dr Lebanon, IN | 3.0 | 2.0 | 1400 | $2,300 | $1.64 | 6d | 1 | 0.12mi |
| 2102 Yosemite Dr Lebanon, IN | 3.0 | 2.0 | 1400 | $2,300 | $1.64 | 16d | 1 | 0.12mi |
| 806 Harney Dr Lebanon, IN | 3.0 | 1.0 | 1170 | $2,500 | $2.14 | 19d | 1 | 0.47mi |
| 1704 Crimson Ln Lebanon, IN | 3.0 | 2.0 | 1110 | $2,000 | $1.80 | 19d | 1 | 0.59mi |
| 411 East Dr Ulen, IN | 3.0 | 1.0 | 1588 | $1,450 | $0.91 | 13d | 1 | 0.84mi |
| 830 Campbell St Lebanon, IN | 2.0–4.0 | 2.0 | 1728 | $1,604 | $0.93 | 0d | 1 | 0.84mi |
| 721 Crown Pointe Dr Lebanon, IN | 2.0–3.0 | 1.0–2.0 | 991 | $1,413 | $1.43 | 0d | 5 | 0.88mi |
| 718 N Lebanon St Lebanon, IN | 4.0 | 1.5 | 1560 | $1,795 | $1.15 | 25d | 1 | 0.97mi |
| 814 Powell St Lebanon, IN | 4.0 | 1.5 | 1647 | $1,650 | $1.00 | 23d | 1 | 1.08mi |
| 702 Edgewood Dr Lebanon, IN | 3.0 | 1.5 | 1026 | $1,595 | $1.55 | 22d | 1 | 1.33mi |
| 114 S Meridian St Lebanon, IN | 2.0 | 2.0 | 1200 | $1,595 | $1.33 | 9d | 1 | 1.41mi |
| 230 S Lebanon St Lebanon, IN | 2.0 | 1.0–2.0 | 676 | $1,550 | $2.29 | 0d | 2 | 1.48mi |
HOA detail
- Monthly dues
- $8 · $96/yr
- Likely covers
- water
Listing history 3 events
-
2026-06-21statusdays on market $259,900 Pending 3 DOM
-
2026-06-17remarks 699-char remark
-
2026-06-17$259,900 Active 1 DOM
ⓘ Source: listings_history table (triggers on properties + properties_extension) + one-shot
backfill from property_details.listing_events for pre-trigger history.
Tax reassessment forecast IN · Partial reset (capped growth)
- Current annual tax
- $1,890 · $157/mo
- Projected year-2 tax
- $2,049 · $171/mo
- Expected delta
- +$160/yr (+$13/mo · 8.5%)
ⓘ Screening estimate from a state-policy table — verify with the county assessor before closing.
Climate risk First Street
- Flood 1/10 Low FEMA zone X (unshaded) · 0% chance over 30 yrs
- Wildfire 1/10 Low
- Heat 3/10 Moderate 7 d/yr ≥102°F today · 18 d/yr by 30 yrs out
- Wind 2/10 Low 0% chance of damaging wind over 30 yrs
- Air quality 2/10 Low 1 unhealthy d/yr today · 2 by 30 yrs out
Nearby sold comps map
Loading sold comps map…
Walkable amenities ~0.75 mi
Loading nearby amenities…
Taxation est. · year 1
- Rental income
- $25,753
- − Mortgage interest
- −$14,558
- − Property taxes
- −$1,890
- − Insurance
- −$1,300
- − Repairs & maintenance
- −$2,060
- − Management
- −$2,060
- − HOA
- −$96
- − Depreciation
- −$7,561
- Taxable loss
- −$3,772
- Est. tax savings @ 24.0%
- +$905
- After-tax cash flow
- $1,610/yr
For passive investors: Depreciation is non-cash, so a rental often shows a tax loss while cash-flowing — sheltering income. Rental losses are passive: they offset passive income freely, and up to $25,000/yr can offset ordinary (W-2) income if you actively participate and your MAGI is under $100k (phasing out to $0 by $150k); unused losses carry forward. On sale, claimed depreciation is recaptured at up to 25%, and gains may owe capital-gains tax (a 1031 exchange can defer both). Figures are a year-1 estimate at your 24.0% rate — not tax advice; consult a CPA.
Schools (NCES district)
- District
- Lebanon Community School Corporation
- NCES district ID
- 1805790
- Math proficiency
- 41% ▼ -11.00%
- Reading proficiency
- 44% ▼ -5.00%
- Median HH income
- $52,178
- Composite
- 36.77/100
- National rank
- #4571
- State rank
- #115 of 301 in IN
Livability — Lebanon
- Score
- 66/100
- State rank
- #296
- US rank
- #11943
Category grades
Schools grade is shown separately in the Schools card above.
Census & demographics
- Census place
- Lebanon, IN
- County
- Boone County · 69,822 people
- City population
- 23,553
- Metro
- Indianapolis-Carmel-Anderson, IN
- Population (ZIP)
- 23,553
- Household income
- $68,930
- Rent vs Own
- Severe rent burden
- 235.0
Population outlook (Boone County) Hauer SSP2
- Today (2025)
- 77,877 people
- By 2030
- 85,185 · +9.4%
- By 2040
- 99,753 · +28.1%
- By 2050
- 113,572 · +45.8%
- By 2075
- 145,674 · +87.1%
- By 2100
- 161,165 · +106.9%
Race, ethnicity, and origin ACS 2023
- Neighborhood character
- Predominantly White (91%)
- Race & ethnicity
- White 91% Two or more races 6% Hispanic / Latino 6% Black 1%
- Hispanic origin (detail)
- Mexican 4%
- Common ancestry
- Serbian 4% Slovak 2% Italian 2%
- Foreign-born
- 3% · Canada, Jamaica
- Languages at home
- 95% English-only · Spanish 4%
Political lean MEDSL · Boone
- 2024 margin
- R (+16.0) · D 41.0% · R 57.0% · Other 2.0%
- 2008→2024 swing
- +9.8pp toward D · 2008: -25.8pp · 2024: -16.0pp
- All cycles
- 2024: R+16.0 2020: R+18.4 2016: R+29.5 2012: R+37.8 2008: R+25.8
Not yet ingested
- Civics
- —
Market trends
- HPI YoY
- ▼ -188.54%
- Current HPI
- 229.2844
- Rent YoY
- —
- Metro
- Indianapolis-Carmel-Anderson, IN
- State GDP YoY
- ▲ 2.90%
- F500 in state
- 18
Industry mix (Fortune 500 HQ in IN)
| Industry | F500 HQs | Revenue |
|---|---|---|
| Industrial Machinery | 2 | $37B |
|
||
| Healthcare | 1 | $177B |
|
||
| Pharmaceuticals | 1 | $45B |
|
||
| Metals / Steel | 1 | $18B |
|
||
| Agriculture | 1 | $17B |
|
||
| Packaging | 1 | $12B |
|
||
Price history
+165.5% since first listed18 events — show timeline
- 2026-06-17 Listed $259,900 MIBOR as Distributed by MLS Grid
- 2020-04-24 Sold (MLS) $155,000 MIBOR as Distributed by MLS Grid
- 2020-03-21 Pending — MIBOR as Distributed by MLS Grid
- 2020-03-20 Listed $155,000 MIBOR as Distributed by MLS Grid
- 2017-02-10 Sold (Public Records) $125,000 Public Records
- 2017-02-08 Sold (MLS) $125,000 MIBOR as Distributed by MLS Grid
- 2017-01-25 Pending — MIBOR as Distributed by MLS Grid
- 2017-01-17 Contingent — MIBOR as Distributed by MLS Grid
- 2016-12-11 Price Changed $129,000 MIBOR as Distributed by MLS Grid
- 2016-11-18 Listed $132,000 MIBOR as Distributed by MLS Grid
- 2009-07-02 Listing Removed — MIBOR as Distributed by MLS Grid
- 2009-07-02 Sold (Public Records) $116,000 Public Records
- 2009-07-02 Sold (MLS) $116,000 MIBOR as Distributed by MLS Grid
- 2009-06-04 Listed $119,900 MIBOR as Distributed by MLS Grid
- 2003-08-20 Sold (MLS) $105,000 MIBOR as Distributed by MLS Grid
- 2003-07-01 Listed $104,000 MIBOR as Distributed by MLS Grid
- 2000-07-27 Sold (MLS) $94,900 MIBOR as Distributed by MLS Grid
- 2000-03-29 Listed $97,900 MIBOR as Distributed by MLS Grid
Property tax history
+6.7%/yrLatest (2025): $1,890 · -10.1% YoY. Source: county tax records.
Cash-flow waterfall
monthlySold comps — $/sqft
last 12 mo · ≤1 miLoading sold comps…