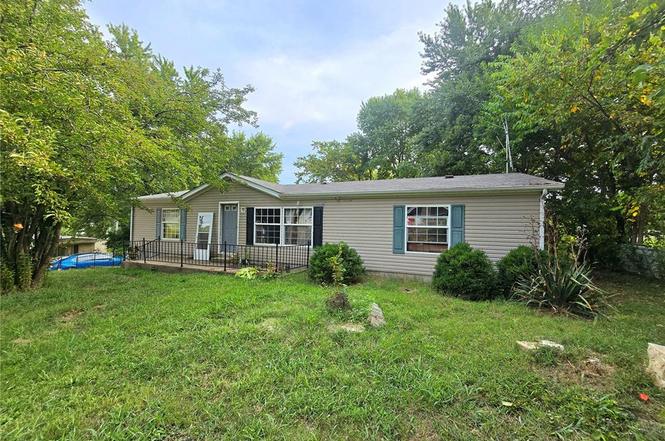
19050 Sikes Rd · Ste. Genevieve, MO
Flood risk 1/10 · Minimal
- FEMA flood zone
- X (unshaded)
- Chance of flooding over 30 yrs
- 0.0%
- Est. flood insurance / yr
- $473 – $860
Fire risk 1/10 · Minimal
- Est. fire insurance / yr
- $1,054 – $1,958
Heat risk 4/10 · Minor
- Hot days now (above 107°F)
- 7 days/yr
- Hot days in 30 yrs
- 19 days/yr
Wind risk 2/10 · Minimal
- Chance of severe wind over 30 yrs
- 1.0%
Air-quality risk 1/10 · Minimal
- Unhealthy air days now
- 0 days/yr
- Unhealthy air days in 30 yrs
- 0 days/yr
Risk factors via First Street. Map © Google.
Why this score? — see what drove the C grade
The composite is a weighted blend of 9 inputs, each scored 0–100. Each bar is that input's sub-score; the figure is the points it added to the 100-point composite (weight × sub-score).
- Cash flow +25.1/30.0
- DSCR +8.2/10.0
- ARV discount +7.5/15.0
- 1% rule +5.3/10.0
- Schools +4.1/10.0
- Rent growth +2.5/5.0
- Livability +2.5/5.0
- Condition / age +2.5/5.0
- Appreciation +0.0/10.0
$107,000
🖨 Deal sheet 📄 Offer letter ✓ Due diligence
Listing remarks
* Accepting Back Up Offers! * This spacious 3 bed, 2 bath manufactured home on a basement offers an incredible opportunity for homeowners or investors looking for functionality and value. There is fencing on all sides but the driveway for added privacy and convenience. Newer roof, septic and hot water heater. There is a large deck perfect for entertaining or relaxing. The walk-out basement is ready for storage, a workshop or possible future living space. Add your personal touches and build your equity as you go, through renovations and creating your dream home on a budget! Whether you are a DIYer, investor or buyer looking for space and potential, this location is a rare find in the Ste. G
Key facts
- Large deck
- Fencing on all sides
- 2 storage sheds
Tags
Neighborhood map
What this means for you Summary
Snapshot
- This is a 3-bed/2.0-bath other listed at $107k.
Deal economics
- At list price, monthly cash flow is $238 ($3k/yr) — positive.
- The deal already cash-flows at list — no discount required.
- Meets the 1% rule at list price ($1k rent vs $107k).
- Recommended offer: $94k (12.0% below list) — sets the bar for market timing.
Location & tenants
- Location reads: area grade C — affects rentability + tenant quality, not the cash-flow math above.
- Ste. Genevieve County R-II (town): math 46% / reading 50% proficiency, ranked #59 of 324 in MO (top 18%) — families likely to look elsewhere, expect single-tenant / working-renter base with shorter leases.
- Zoned schools: Ste. Genevieve Elem. (math 50% / reading 48%, grade D, #331 of 1,115 statewide, top 30%, 550 students, 44% FRL); Ste. Genevieve Sr. High (math 22% / reading 67%, grade F, #179 of 521 statewide, top 39%, 517 students, 34% FRL) — zoned schools at 39% FRL track the district average.
- Market conditions: 54 active listings in the ZIP; 8 units permitted in Ste. Genevieve County in 2024 (0 in 5+ unit buildings).
Forward outlook
- Local home prices are declining (-3.0%/yr); year-one equity from $740 of loan paydown is wiped out by about $3k of value loss. Plan a longer hold.
- Ste. Genevieve County population projected to shrink 10% by 2050 — rents likely to lag national; underwrite the cash flow, not the appreciation.
Negotiation context
- It's been on market 196 days — a 12% lower offer ($94k) is reasonable based on typical stale-listing flexibility.
- 5 sale attempts; this cycle's ask has dropped $58k (35%) from the opening price — seller is motivated, your offer sets the floor, not the list.
Questions for the listing agent
- It's been on market 196 days. Have you received any prior offers? Is the seller open to a 12% concession, seller financing, or rate buy-down credit?
- Why hasn't it sold? Are there any deal-killer items the seller is aware of (foundation, flood, title, zoning, code violations)?
- Is there a deadline driving the sale (1031 exchange, divorce, estate, relocation)? That informs how much negotiation room exists.
- What's the average days-on-market for RENTAL listings here right now (not sales)? A rising rental-DOM trend means longer vacancies and softer asking-rent achievability than the comps imply.
- What's the recent tenant-quality profile in this submarket — average credit score on applications, eviction rate, late-payment / NSF rate, and stable-employment percentage? A property-management company in the area should have these aggregated.
- How much new for-sale + rental construction is in the pipeline within 1–3 miles? Heavy new supply typically softens prices + rents 12–24 months out; constrained supply supports both.
Investment metrics
- 1% rule
- 1.03% ✓
- Cap rate
- 8.96%
- Cash-on-cash
- 9.53%
- DSCR
- 1.42
- GRM
- 8.1
CMA / ARV
No comps found within radius.
Projected returns pro-forma
-3.0% appreciation · 3.0% rent growth · sell at horizon
- IRR
- -2.0%
- Equity multiple
- 0.93×
- Total profit
- $-2,236
- Equity at exit
- $15,954
- IRR
- 7.7%
- Equity multiple
- 1.58×
- Total profit
- $17,369
- Equity at exit
- $9,251
Cash invested: $29,960 (down + closing). Projections, not guarantees.
Landlord ↔ Tenant lean methodology
- Overall (STATE)
- 81 Strongly Landlord-Friendly
- State Missouri
- 81 Strongly Landlord-Friendly · R+10
- County
- — inherits STATE
- City
- — inherits STATE
ZIP-level market 63670
- Home prices YoY
- -23.6%
- Active inventory
- 54
- Price-to-rent
- 8.1×
Monthly cashflow live
- Estimated rent
- $1,105 medium interval (Pro) →
- Mortgage (P&I)
- −$561
- Tax from tax record
- −$29 /mo · $348/yr
- Insurance
- −$45
- HOA
- −$0
- Vacancy / Maint / Mgmt
- −$232
- Net cashflow
- $238
Break-even live
UW: 25.0% down · 7.5% · 30yr · 1.5% tax · 5.0% vac · 8.0% maint · 8.0% mgmt
Financing live
Cash to close
- Down payment
- $26,750
- Closing costs
- $3,210
- Reserves months
- —
- Total cash needed
- —
Loan-product check · same deal, 3 products live
Conventional
25% down · 7.5% · 30yr
- Down + closing
- —
- Monthly P&I
- —
- Monthly cashflow
- —
- DSCR
- —
- Eligible?
- —
Personal DTI + credit; lowest rate.
DSCR
20% down · 8.5% · 30yr
- Down + closing
- —
- Monthly P&I
- —
- Monthly cashflow
- —
- DSCR
- —
- Eligible?
- —
No personal income docs; deal must DSCR.
Hard money
10% down · 12.0% · 12mo
- Down + closing
- —
- Monthly P&I
- —
- Monthly cashflow
- —
- DSCR
- —
- Eligible?
- —
Short-term bridge; refi at stabilization.
Listing history 15 events
-
2026-04-20status Pending
-
2026-04-16status Active
-
2026-04-14historical Active Under Contract
-
2026-04-14status Pending
-
2026-04-02status Active
-
2026-02-17price $107,000
-
2026-01-28price $114,900
-
2026-01-15price $118,900
-
2025-12-30status Active
-
2025-12-05status Pending
-
2025-11-28price $120,000
-
2025-10-11price $125,000
-
2025-09-26price $130,000
-
2025-09-09$165,000 Active
-
2025-04-07$160,000 Active
ⓘ Source: listings_history table (triggers on properties + properties_extension) + one-shot
backfill from property_details.listing_events for pre-trigger history.
Tax reassessment forecast MO · Resets to sale price
- Current annual tax
- $348 · $29/mo
- Projected year-2 tax
- $1,038 · $86/mo
- Expected delta
- +$690/yr (+$57/mo · 198.1%)
ⓘ Screening estimate from a state-policy table — verify with the county assessor before closing.
Climate risk First Street
- Flood 1/10 Low FEMA zone X (unshaded) · 0% chance over 30 yrs
- Wildfire 1/10 Low
- Heat 4/10 Moderate 7 d/yr ≥107°F today · 19 d/yr by 30 yrs out
- Wind 2/10 Low 100% chance of damaging wind over 30 yrs
- Air quality 1/10 Low 0 unhealthy d/yr today · 0 by 30 yrs out
Nearby sold comps map
Loading sold comps map…
Walkable amenities ~0.75 mi
Loading nearby amenities…
Taxation est. · year 1
- Rental income
- $13,255
- − Mortgage interest
- −$5,994
- − Property taxes
- −$348
- − Insurance
- −$535
- − Repairs & maintenance
- −$1,060
- − Management
- −$1,060
- − Depreciation
- −$3,113
- Taxable income
- $1,144
- Est. tax owed @ 24.0%
- −$275
- After-tax cash flow
- $2,580/yr
For passive investors: Depreciation is non-cash, so a rental often shows a tax loss while cash-flowing — sheltering income. Rental losses are passive: they offset passive income freely, and up to $25,000/yr can offset ordinary (W-2) income if you actively participate and your MAGI is under $100k (phasing out to $0 by $150k); unused losses carry forward. On sale, claimed depreciation is recaptured at up to 25%, and gains may owe capital-gains tax (a 1031 exchange can defer both). Figures are a year-1 estimate at your 24.0% rate — not tax advice; consult a CPA.
Schools (NCES district)
- District
- Ste. Genevieve County R-II
- NCES district ID
- 2929370
- Math proficiency
- 46% ▼ -10.00%
- Reading proficiency
- 50% ▼ -7.00%
- Median HH income
- $47,013
- Composite
- 40.83/100
- National rank
- #3632
- State rank
- #59 of 324 in MO
Livability — Ste. Genevieve
No livability data for this city. (Only ~50 U.S. cities are tracked.)
Census & demographics
- Population (ZIP)
- 12,294
Population outlook (Ste. Genevieve County) Hauer SSP2
- Today (2025)
- 17,453 people
- By 2030
- 17,119 · -1.9%
- By 2040
- 16,361 · -6.3%
- By 2050
- 15,719 · -9.9%
- By 2075
- 14,849 · -14.9%
- By 2100
- 13,504 · -22.6%
Race, ethnicity, and origin ACS 2023
- Neighborhood character
- Predominantly White (93%)
- Race & ethnicity
- White 93% Two or more races 4% Black 2% Hispanic / Latino 2%
- Common ancestry
- Lithuanian 10% Romanian 2% Slovak 2%
- Foreign-born
- 0%
- Languages at home
- 99% English-only · Spanish 1% German/W. Germanic 1%
Political lean MEDSL · Ste. Genevieve
- 2024 margin
- Solid R (+45.0) · D 26.9% · R 71.9% · Other 1.2%
- 2008→2024 swing
- -59.2pp toward R · 2008: 14.1pp · 2024: -45.0pp
- All cycles
- 2024: R+45.0 2020: R+41.3 2016: R+34.9 2012: R+3.0 2008: D+14.1
Not yet ingested
- Civics
- —
Market trends
- HPI YoY
- ▼ -59.70%
- Current HPI
- 193.0646
- Rent YoY
- —
- Metro
- —
- State GDP YoY
- ▲ 1.84%
- F500 in state
- 20
Industry mix (Fortune 500 HQ in MO)
| Industry | F500 HQs | Revenue |
|---|---|---|
| Healthcare | 1 | $163B |
|
||
| Insurance | 1 | $21B |
|
||
| Industrial Technology | 1 | $17B |
|
||
| Retail | 1 | $16B |
|
||
| Industrial Distribution | 1 | $10B |
|
||
| Utilities | 1 | $9B |
|
||
Price history
-33.1% since first listed15 events — show timeline
- 2026-04-20 Pending — MARIS as Distributed by MLS Grid
- 2026-04-16 Relisted — MARIS as Distributed by MLS Grid
- 2026-04-14 Contingent — MARIS as Distributed by MLS Grid
- 2026-04-14 Pending — MARIS as Distributed by MLS Grid
- 2026-04-02 Relisted — MARIS as Distributed by MLS Grid
- 2026-02-17 Price Changed $107,000 MARIS as Distributed by MLS Grid
- 2026-01-28 Price Changed $114,900 MARIS as Distributed by MLS Grid
- 2026-01-15 Price Changed $118,900 MARIS as Distributed by MLS Grid
- 2025-12-30 Relisted — MARIS as Distributed by MLS Grid
- 2025-12-05 Pending — MARIS as Distributed by MLS Grid
- 2025-11-28 Price Changed $120,000 MARIS as Distributed by MLS Grid
- 2025-10-11 Price Changed $125,000 MARIS as Distributed by MLS Grid
- 2025-09-26 Price Changed $130,000 MARIS as Distributed by MLS Grid
- 2025-09-09 Listed $165,000 MARIS as Distributed by MLS Grid
- 2025-04-07 Listed $160,000 MARIS as Distributed by MLS Grid
Property tax history
+0.5%/yrLatest (2025): $348 · +27.6% YoY. Source: county tax records.
Cash-flow waterfall
monthlySold comps — $/sqft
last 12 mo · ≤1 miLoading sold comps…