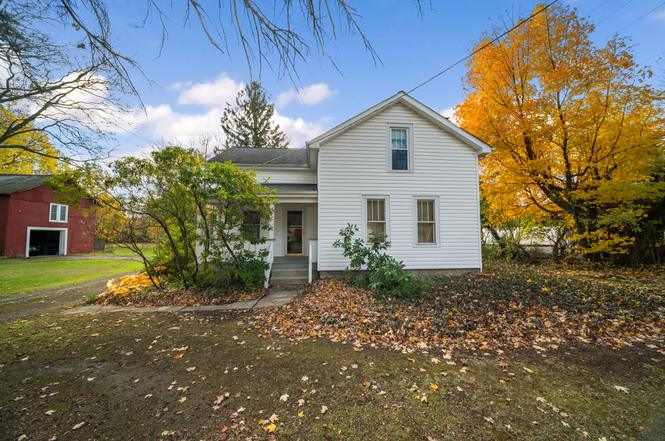
7767 Maple St · Fairview, PA
Flood risk 1/10 · Minimal
- FEMA flood zone
- X (unshaded)
- Chance of flooding over 30 yrs
- 0.0%
- Est. flood insurance / yr
- $473 – $860
Fire risk 1/10 · Minimal
- Est. fire insurance / yr
- $511 – $949
Heat risk 2/10 · Minimal
- Hot days now (above 90°F)
- 7 days/yr
- Hot days in 30 yrs
- 18 days/yr
Wind risk 1/10 · Minimal
- Chance of severe wind over 30 yrs
- —
Air-quality risk 3/10 · Minor
- Unhealthy air days now
- 2 days/yr
- Unhealthy air days in 30 yrs
- 4 days/yr
Risk factors via First Street. Map © Google.
Why this score? — see what drove the B- grade
The composite is a weighted blend of 9 inputs, each scored 0–100. Each bar is that input's sub-score; the figure is the points it added to the 100-point composite (weight × sub-score).
- Cash flow +24.9/30.0
- ARV discount +13.1/15.0
- DSCR +8.1/10.0
- 1% rule +6.1/10.0
- Schools +5.7/10.0
- Livability +4.2/5.0
- Rent growth +2.5/5.0
- Condition / age +2.5/5.0
- Appreciation +0.0/10.0
$259,900
🖨 Deal sheet (PDF) 📄 Offer letter ✓ Due diligence
Listing remarks
This three-bedroom, one-bath farmhouse sits on just over 3 acres and offers a great mix of open space, woods, and convenience. The property includes a grassy yard with an invisible fence, a versatile barn with a garage-style door, and wooded acreage that leads right to Trout Run Creek. Perfect for anyone who enjoys having room to roam. Off the main roads in between the ball fields and gravel pit ponds but just minutes from 90 and the school this location offers privacy with convenience. The home has solid bones and is ready for someone to bring their own style to the interior. The exterior was fully redone in 2001, the HVAC is about 5 years old, the hot water tank is roughly 11 years old, a
Key facts
- Trout run creek
- Invisible fence
- Versatile barn
Tags
Neighborhood map
What this means for you Summary
Snapshot
- This is a 3-bed/1.0-bath single-family listed at $260k.
Deal economics
- At list price, monthly cash flow is $558 ($7k/yr) — positive.
- The deal already cash-flows at list — no discount required.
- Meets the 1% rule at list price ($3k rent vs $260k).
- Recommended offer: $229k (12.0% below list) — sets the bar for market timing.
- Cap rate 8.9% vs local median 2.2% in Fairview — top-decile yield for the area; either an underpriced asset or a hidden risk that comps aren't pricing in. Stress-test before assuming the spread holds.
Location & tenants
- Location reads 83/100 on livability (#123 in PA, #963 nationally) — a professional / high-income tenant draw. Strengths: crime A+, employment A+, cost of living A+; Watch: amenities F, commute F.
- Fairview SD (rural): math 54% / reading 74% proficiency, ranked #42 of 539 in PA (top 8%) — acceptable for families but not a draw, mixed tenant base, ~2y average lease; only 17% free/reduced lunch — higher-income household profile.
- Zoned schools: Fairview El Sch (math 61% / reading 74%, grade B+, #192 of 1,518 statewide, top 13%, 717 students, 24% FRL); Fairview Ms (math 41% / reading 74%, grade B, #61 of 512 statewide, top 13%, 571 students, 27% FRL); Fairview Hs (math 98% / reading 77%, grade A, #6 of 437 statewide, top 1%, 588 students, 21% FRL).
- Market conditions: 38 active listings in the ZIP; 1 comparable units currently listed for rent nearby; 364 units permitted in Erie County in 2024 (188 in 5+ unit buildings).
Forward outlook
- Local home prices are declining (-3.0%/yr); year-one equity from $2k of loan paydown is wiped out by about $8k of value loss. Plan a longer hold.
- Erie County population projected at -14% by 2050 — secular population decline; favor cash flow + early exit over multi-decade hold.
Negotiation context
- It's been on market 162 days — a 12% lower offer ($229k) is reasonable based on typical stale-listing flexibility.
- Current owner paid $78k; list at $260k implies a 231% gain — meaningful room to come down on a strong offer.
Risks & watch-outs
- Watch-outs: built in 1940 — expect roof / HVAC / electrical / plumbing capex.
Questions for the listing agent
- It's been on market 162 days. Have you received any prior offers? Is the seller open to a 12% concession, seller financing, or rate buy-down credit?
- Built in 1940 — when were the roof, HVAC, electrical panel, plumbing, and water heater last replaced?
- Why hasn't it sold? Are there any deal-killer items the seller is aware of (foundation, flood, title, zoning, code violations)?
- Is there a deadline driving the sale (1031 exchange, divorce, estate, relocation)? That informs how much negotiation room exists.
- Schools are A-rated — typically a magnet for longer-tenancy family renters. What's the average tenant stay here, and is there a school-zone premium baked into asking?
- What's the average days-on-market for RENTAL listings here right now (not sales)? A rising rental-DOM trend means longer vacancies and softer asking-rent achievability than the comps imply.
- What's the recent tenant-quality profile in this submarket — average credit score on applications, eviction rate, late-payment / NSF rate, and stable-employment percentage? A property-management company in the area should have these aggregated.
- How much new for-sale + rental construction is in the pipeline within 1–3 miles? Heavy new supply typically softens prices + rents 12–24 months out; constrained supply supports both.
Investment metrics
- 1% rule
- 1.11% ✓
- Cap rate
- 8.87%
- Cash-on-cash
- 9.20%
- DSCR
- 1.41
- GRM
- 7.5
CMA / ARV
- ARV (on-the-fly)
- $297,000
- Comps found
- 10
Show comp detail 10 sales within ~0.75 mi
| Address | Dist | Beds/Ba | Sqft | Sold | Price | $/sf | Match |
|---|---|---|---|---|---|---|---|
| 7767 Maple St | 0.00mi | 3/1.0 | 1,500 (0%) | 1mo | $245,000 | $163 | 99 |
| 3553 Alameda Dr | 0.09mi | 3/2.5 | 1,640 (+9%) | 4mo | $325,000 | $198 | 71 |
| 7728 Welcana Dr | 0.21mi | 3/1.0 | 1,452 (-3%) | 18mo | $252,000 | $174 | 70 |
| 3831 Royann Dr | 0.31mi | 3/1.5 | 1,508 (+0%) | 21mo | $330,000 | $219 | 65 |
| 3242 Lynann Ln | 0.37mi | 3/2.0 | 1,412 (-6%) | 13mo | $286,000 | $203 | 58 |
| 3205 Lynann Ln | 0.40mi | 4/2.0 (+1) | 1,626 (+8%) | 2mo | $300,000 | $185 | 57 |
| 3899 Fairview Ct | 0.34mi | 3/2.5 | 1,371 (-9%) | 11mo | $280,000 | $204 | 55 |
| 4103 Avonia Rd | 0.56mi | 3/2.0 | 1,448 (-4%) | 16mo | $175,000 | $121 | 51 |
| 7621 Welcana Dr | 0.33mi | 4/2.0 (+1) | 1,712 (+14%) | 7mo | $272,000 | $159 | 46 |
| 7472 Water St | 0.71mi | 3/2.0 | 1,375 (-8%) | 17mo | $320,000 | $233 | 35 |
Match score weights: distance 35% · size 25% · config 20% · recency 20%. Top-matched comps best support the ARV.
Projected returns pro-forma
-3.0% appreciation · 3.0% rent growth · sell at horizon
- IRR
- -2.4%
- Equity multiple
- 0.91×
- Total profit
- $-6,601
- Equity at exit
- $38,752
- IRR
- 7.3%
- Equity multiple
- 1.55×
- Total profit
- $39,977
- Equity at exit
- $22,471
Cash invested: $72,772 (down + closing). Projections, not guarantees.
Landlord ↔ Tenant lean methodology
- Overall (STATE)
- 62 Landlord-Friendly
- State Pennsylvania
- 62 Landlord-Friendly · EVEN
- County
- — inherits STATE
- City
- — inherits STATE
ZIP-level market 16415
- Home prices YoY
- -26.1%
- Active inventory
- 38
- Price-to-rent
- 7.5×
Monthly cashflow live
- Estimated rent
- $2,885 medium interval (Pro) →
- Mortgage (P&I)
- −$1,363
- Tax from tax record
- −$250 /mo · $3,003/yr
- Insurance
- −$108
- HOA
- −$0
- Vacancy / Maint / Mgmt
- −$606
- Net cashflow
- $558
Break-even live
Sensitivity live
| Price | -10% $705 | -5% $631 | +0% $558 | +5% $484 | +10% $411 |
|---|---|---|---|---|---|
| Rent | -10% $330 | -5% $444 | +0% $558 | +5% $672 | +10% $786 |
| Rate | -1.0pp $689 | -0.5pp $624 | base $558 | +0.5pp $490 | +1.0pp $422 |
UW: 25.0% down · 7.5% · 30yr · 1.5% tax · 5.0% vac · 8.0% maint · 8.0% mgmt
Financing live
Cash to close
- Down payment
- $64,975
- Closing costs
- $7,797
- Reserves months
- —
- Total cash needed
- —
Loan-product check · same deal, 3 products live
Conventional
25% down · 7.5% · 30yr
- Down + closing
- —
- Monthly P&I
- —
- Monthly cashflow
- —
- DSCR
- —
- Eligible?
- —
Personal DTI + credit; lowest rate.
DSCR
20% down · 8.5% · 30yr
- Down + closing
- —
- Monthly P&I
- —
- Monthly cashflow
- —
- DSCR
- —
- Eligible?
- —
No personal income docs; deal must DSCR.
Hard money
10% down · 12.0% · 12mo
- Down + closing
- —
- Monthly P&I
- —
- Monthly cashflow
- —
- DSCR
- —
- Eligible?
- —
Short-term bridge; refi at stabilization.
Rent comps 1 comps
| Address | Beds | Baths | Sqft | Rent | $/sqft | DOM | Units | Dist |
|---|---|---|---|---|---|---|---|---|
| 5885 Bluestone Dr Fairview, PA | 1.0–3.0 | 1.0–2.5 | 1445 | $2,885 | $2.00 | 45d | 51 | 1.42mi |
Listing history 4 events
-
2026-05-26status Pending
-
2026-04-25status Pending
-
2025-11-14$259,900 Active
-
1993-04-14soldstatus $78,500
ⓘ Source: listings_history table (triggers on properties + properties_extension) + one-shot
backfill from property_details.listing_events for pre-trigger history.
Tax reassessment forecast PA · Partial reset (capped growth)
- Current annual tax
- $3,003 · $250/mo
- Projected year-2 tax
- $3,555 · $296/mo
- Expected delta
- +$552/yr (+$46/mo · 18.4%)
ⓘ Screening estimate from a state-policy table — verify with the county assessor before closing.
Climate risk First Street
- Flood 1/10 Low FEMA zone X (unshaded) · 0% chance over 30 yrs
- Wildfire 1/10 Low
- Heat 2/10 Low 7 d/yr ≥90°F today · 18 d/yr by 30 yrs out
- Wind 1/10 Low
- Air quality 3/10 Moderate 2 unhealthy d/yr today · 4 by 30 yrs out
Nearby sold comps map
Loading sold comps map…
Walkable amenities ~0.75 mi
Loading nearby amenities…
Taxation est. · year 1
- Rental income
- $34,620
- − Mortgage interest
- −$14,558
- − Property taxes
- −$3,003
- − Insurance
- −$1,300
- − Repairs & maintenance
- −$2,770
- − Management
- −$2,770
- − Depreciation
- −$7,561
- Taxable income
- $2,659
- Est. tax owed @ 24.0%
- −$638
- After-tax cash flow
- $6,054/yr
For passive investors: Depreciation is non-cash, so a rental often shows a tax loss while cash-flowing — sheltering income. Rental losses are passive: they offset passive income freely, and up to $25,000/yr can offset ordinary (W-2) income if you actively participate and your MAGI is under $100k (phasing out to $0 by $150k); unused losses carry forward. On sale, claimed depreciation is recaptured at up to 25%, and gains may owe capital-gains tax (a 1031 exchange can defer both). Figures are a year-1 estimate at your 24.0% rate — not tax advice; consult a CPA.
Schools (NCES district)
- District
- Fairview SD
- NCES district ID
- 4209570
- Math proficiency
- 54% ▼ -13.00%
- Reading proficiency
- 74% ▼ -9.00%
- Median HH income
- $74,956
- Composite
- 56.7/100
- National rank
- #1130
- State rank
- #42 of 539 in PA
Livability — Fairview
- Score
- 83/100
- State rank
- #123
- US rank
- #963
Category grades
Schools grade is shown separately in the Schools card above.
Census & demographics
- Census place
- Fairview, PA
- Population (ZIP)
- 10,251
Population outlook (Erie County) Hauer SSP2
- Today (2025)
- 272,159 people
- By 2030
- 266,299 · -2.2%
- By 2040
- 250,987 · -7.8%
- By 2050
- 234,925 · -13.7%
- By 2075
- 199,164 · -26.8%
- By 2100
- 162,985 · -40.1%
Race, ethnicity, and origin ACS 2023
- Neighborhood character
- Predominantly White (92%)
- Race & ethnicity
- White 92% Two or more races 3% Asian 3% Hispanic / Latino 1%
- Common ancestry
- Romanian 14% Slovak 2% Lithuanian 1%
- Foreign-born
- 3% · Canada
- Languages at home
- 97% English-only · Spanish 1% Other Asian/Pacific 1%
Political lean MEDSL · Erie
- 2024 margin
- Toss-up / Even · D 49.0% · R 50.0%
- 2008→2024 swing
- -20.9pp toward R · 2008: 19.9pp · 2024: -1.0pp
- All cycles
- 2024: R+1.0 2020: D+1.0 2016: R+2.0 2012: D+16.9 2008: D+19.9
Not yet ingested
- Civics
- —
Market trends
- HPI YoY
- ▼ -90.57%
- Current HPI
- 256.1235
- Rent YoY
- —
- Metro
- —
- State GDP YoY
- ▲ 1.68%
- F500 in state
- 34
Industry mix (Fortune 500 HQ in PA)
| Industry | F500 HQs | Revenue |
|---|---|---|
| Healthcare | 2 | $309B |
|
||
| Insurance | 2 | $27B |
|
||
| Telecommunications / Media | 1 | $124B |
|
||
| Industrial Distribution | 1 | $22B |
|
||
| Financial Services | 1 | $20B |
|
||
| Chemicals / Materials | 1 | $18B |
|
||
Price history
+231.1% since first listed4 events — show timeline
- 2026-05-26 Pending — GEBOR
- 2026-04-25 Pending — GEBOR
- 2025-11-14 Listed $259,900 GEBOR
- 1993-04-14 Sold (Public Records) $78,500 Public Records
Property tax history
+2.6%/yrLatest (2026): $3,003 · +3.2% YoY. Source: county tax records.
Cash-flow waterfall
monthlySold comps — $/sqft
last 12 mo · ≤1 miLoading sold comps…