 Multi-family
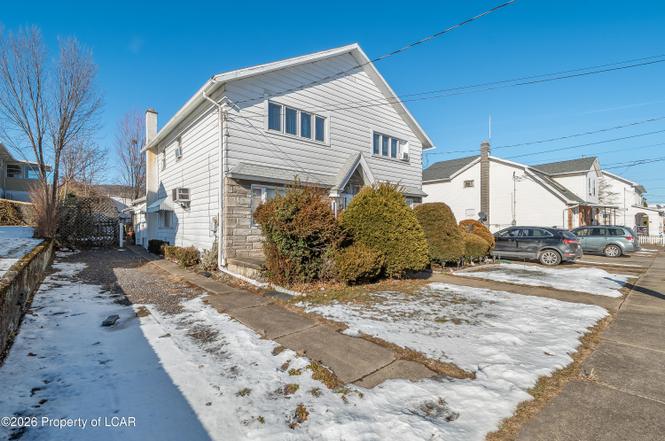
322 Salem St · West Pittston, PA
Flood risk 1/10 · Minimal
- FEMA flood zone
- X (unshaded)
- Chance of flooding over 30 yrs
- 0.0%
- Est. flood insurance / yr
- $507 – $1,088
Fire risk 2/10 · Minimal
- Est. fire insurance / yr
- $511 – $949
Heat risk 4/10 · Minor
- Hot days now (above 96°F)
- 7 days/yr
- Hot days in 30 yrs
- 17 days/yr
Wind risk 3/10 · Minor
- Chance of severe wind over 30 yrs
- 4.0%
Air-quality risk 2/10 · Minimal
- Unhealthy air days now
- 1 days/yr
- Unhealthy air days in 30 yrs
- 2 days/yr
Risk factors via First Street. Map © Google.
Why this score? — see what drove the C grade
The composite is a weighted blend of 9 inputs, each scored 0–100. Each bar is that input's sub-score; the figure is the points it added to the 100-point composite (weight × sub-score).
- Cash flow +20.1/30.0
- ARV discount +15.0/15.0
- DSCR +6.4/10.0
- 1% rule +5.0/10.0
- Livability +3.9/5.0
- Schools +3.2/10.0
- Rent growth +2.5/5.0
- Condition / age +2.5/5.0
- Appreciation +0.0/10.0
$140,000
🖨 Deal sheet 📄 Offer letter ✓ Due diligence
Multi-family units
County records classify this as Multi-Family (2-4 Unit). Listing-text estimate: 1 unit. estimate disagrees with records
Listing remarks
Well-kept, three-bedroom, half-double located in West Pittston offering spacious living & family rooms, a large kitchen with ample room for dining, and a screened-in rear porch overlooking a private backyard. Additional highlights include a private driveway, above-ground pool, as well as fresh carpeting & paint.
Key facts
- Private driveway
- Private backyard
- Large kitchen
Tags
Neighborhood map
What this means for you Summary
Snapshot
- This is a 3-bed/1.0-bath multifamily listed at $140k.
Deal economics
- At list price, monthly cash flow is $174 ($2k/yr) — positive.
- The deal already cash-flows at list — no discount required.
- Meets the 1% rule at list price ($1k rent vs $140k).
Location & tenants
- Location reads 77/100 on livability (#333 in PA, #2,927 nationally) — a middle-class / working-renter tenant base. Strengths: cost of living A+, health & safety A+, crime A-; Watch: amenities D, commute F.
- Wyoming Area SD (suburban): math 24% / reading 51% proficiency, ranked #381 of 539 in PA (top 71%) — families likely to look elsewhere, expect single-tenant / working-renter base with shorter leases.
- Market conditions: 59 active listings in the ZIP; 13 comparable units currently listed for rent nearby; rentals leasing fast (median 14d on market — plan ~1-2 weeks tenant-placement turnaround); 349 units permitted in Luzerne County in 2024 (16 in 5+ unit buildings).
Forward outlook
- Local home prices are declining (-3.0%/yr); year-one equity from $968 of loan paydown is wiped out by about $4k of value loss. Plan a longer hold.
- Luzerne County population projected at +4% by 2050 — modest demand growth; plan on rents tracking national, not racing it.
Negotiation context
- Only 8 days on market — expect competitive offers; lowballing is unlikely to land.
- Current owner paid $44k; list at $140k implies a 221% gain — meaningful room to come down on a strong offer.
Risks & watch-outs
- Watch-outs: built in 1900 — expect roof / HVAC / electrical / plumbing capex.
Questions for the listing agent
- Built in 1900 — when were the roof, HVAC, electrical panel, plumbing, and water heater last replaced?
- Is there a deadline driving the sale (1031 exchange, divorce, estate, relocation)? That informs how much negotiation room exists.
- Schools are B-rated — typically a magnet for longer-tenancy family renters. What's the average tenant stay here, and is there a school-zone premium baked into asking?
- What's the average days-on-market for RENTAL listings here right now (not sales)? A rising rental-DOM trend means longer vacancies and softer asking-rent achievability than the comps imply.
- What's the recent tenant-quality profile in this submarket — average credit score on applications, eviction rate, late-payment / NSF rate, and stable-employment percentage? A property-management company in the area should have these aggregated.
- How much new apartment / multifamily construction is in the pipeline within 1–3 miles? Heavy new supply (>2% of stock underway) typically softens rents 12–24 months out; light construction supports rent growth.
Investment metrics
- 1% rule
- 1.00% ✓
- Cap rate
- 7.78%
- Cash-on-cash
- 5.31%
- DSCR
- 1.24
- GRM
- 8.3
CMA / ARV
- ARV (on-the-fly)
- $190,384
- Comps found
- 1
Show comp detail 1 sale within ~0.75 mi
| Address | Dist | Beds/Ba | Sqft | Sold | Price | $/sf | Match |
|---|---|---|---|---|---|---|---|
| 621 Foundry St | 0.11mi | 3/2.0 | 1,200 (-8%) | 19mo | $175,000 | $146 | 61 |
Match score weights: distance 35% · size 25% · config 20% · recency 20%. Top-matched comps best support the ARV.
Projected returns pro-forma
-3.0% appreciation · 3.0% rent growth · sell at horizon
- IRR
- -8.1%
- Equity multiple
- 0.70×
- Total profit
- $-11,629
- Equity at exit
- $20,874
- IRR
- 1.5%
- Equity multiple
- 1.11×
- Total profit
- $4,119
- Equity at exit
- $12,105
Cash invested: $39,200 (down + closing). Projections, not guarantees.
Landlord ↔ Tenant lean methodology
- Overall (STATE)
- 62 Landlord-Friendly
- State Pennsylvania
- 62 Landlord-Friendly · EVEN
- County
- — inherits STATE
- City
- — inherits STATE
ZIP-level market 18643
- Home prices YoY
- -22.8%
- Active inventory
- 59
- Price-to-rent
- 8.3×
Monthly cashflow live
- Estimated rent
- $1,406 high interval (Pro) →
- Mortgage (P&I)
- −$734
- Tax from tax record
- −$145 /mo · $1,737/yr
- Insurance
- −$58
- HOA
- −$0
- Vacancy / Maint / Mgmt
- −$295
- Net cashflow
- $174
Break-even live
UW: 25.0% down · 7.5% · 30yr · 1.5% tax · 5.0% vac · 8.0% maint · 8.0% mgmt
Financing live
Cash to close
- Down payment
- $35,000
- Closing costs
- $4,200
- Reserves months
- —
- Total cash needed
- —
Loan-product check · same deal, 3 products live
Conventional
25% down · 7.5% · 30yr
- Down + closing
- —
- Monthly P&I
- —
- Monthly cashflow
- —
- DSCR
- —
- Eligible?
- —
Personal DTI + credit; lowest rate.
DSCR
20% down · 8.5% · 30yr
- Down + closing
- —
- Monthly P&I
- —
- Monthly cashflow
- —
- DSCR
- —
- Eligible?
- —
No personal income docs; deal must DSCR.
Hard money
10% down · 12.0% · 12mo
- Down + closing
- —
- Monthly P&I
- —
- Monthly cashflow
- —
- DSCR
- —
- Eligible?
- —
Short-term bridge; refi at stabilization.
Rent comps 13 comps
| Address | Beds | Baths | Sqft | Rent | $/sqft | DOM | Units | Dist |
|---|---|---|---|---|---|---|---|---|
| 329 Fremont St West Pittston, PA | 3.0 | 1.0 | 1250 | $1,400 | $1.12 | 43d | 1 | 0.11mi |
| 327 Fremont St Unit 329 West Pittston, PA | 3.0 | 1.0 | 1250 | $1,400 | $1.12 | 43d | 1 | 0.12mi |
| 226 Fremont St West Pittston, PA | 3.0 | 2.0 | 1140 | $1,395 | $1.22 | 13d | 1 | 0.14mi |
| 202 Philadelphia Ave West Pittston, PA | 2.0 | 1.5 | 1550 | $1,600 | $1.03 | 13d | 1 | 0.51mi |
| 3 Miller St Pittston, PA | 3.0 | 1.0 | 1007 | $1,200 | $1.19 | 43d | 1 | 0.97mi |
| 7 Miller St Pittston, PA | 2.0 | 1.0 | 1120 | $1,150 | $1.03 | 13d | 1 | 0.97mi |
| 1104 Chicory Ct Exeter, PA | 3.0 | 1.5 | 1280 | $1,700 | $1.33 | 13d | 1 | 0.98mi |
| 109 Main St Pittston, PA | 2.0–3.0 | 2.0 | 1070 | $1,300 | $1.21 | 13d | 1 | 1.13mi |
| 178 Parsonage St Pittston, PA | 3.0 | 1.0 | 1500 | $1,500 | $1.00 | 13d | 1 | 1.20mi |
| 24 E Columbus Ave Pittston, PA | 2.0 | 1.0 | 896 | $1,200 | $1.34 | 21d | 1 | 1.23mi |
| 102A Searle St Pittston, PA | 3.0 | 1.0 | 960 | $1,350 | $1.41 | 43d | 1 | 1.27mi |
| 118 1/2 Broad St Pittston, PA | 2.0 | 1.0 | 950 | $1,200 | $1.26 | 13d | 1 | 1.28mi |
| 252 S Main St Pittston, PA | 4.0 | 2.5 | 1548 | $1,750 | $1.13 | 43d | 1 | 1.30mi |
Listing history 3 events
-
2026-02-03status Pending
-
2026-01-26$140,000 Active
-
2011-10-31soldstatus $43,600
ⓘ Source: listings_history table (triggers on properties + properties_extension) + one-shot
backfill from property_details.listing_events for pre-trigger history.
Tax reassessment forecast PA · Partial reset (capped growth)
- Current annual tax
- $1,737 · $145/mo
- Projected year-2 tax
- $1,975 · $165/mo
- Expected delta
- +$237/yr (+$20/mo · 13.7%)
ⓘ Screening estimate from a state-policy table — verify with the county assessor before closing.
Climate risk First Street
- Flood 1/10 Low FEMA zone X (unshaded) · 0% chance over 30 yrs
- Wildfire 2/10 Low
- Heat 4/10 Moderate 7 d/yr ≥96°F today · 17 d/yr by 30 yrs out
- Wind 3/10 Moderate 4% chance of damaging wind over 30 yrs
- Air quality 2/10 Low 1 unhealthy d/yr today · 2 by 30 yrs out
Nearby sold comps map
Loading sold comps map…
Walkable amenities ~0.75 mi
Loading nearby amenities…
Taxation est. · year 1
- Rental income
- $16,874
- − Mortgage interest
- −$7,842
- − Property taxes
- −$1,737
- − Insurance
- −$700
- − Repairs & maintenance
- −$1,350
- − Management
- −$1,350
- − Depreciation
- −$4,073
- Taxable loss
- −$178
- Est. tax savings @ 24.0%
- +$43
- After-tax cash flow
- $2,126/yr
For passive investors: Depreciation is non-cash, so a rental often shows a tax loss while cash-flowing — sheltering income. Rental losses are passive: they offset passive income freely, and up to $25,000/yr can offset ordinary (W-2) income if you actively participate and your MAGI is under $100k (phasing out to $0 by $150k); unused losses carry forward. On sale, claimed depreciation is recaptured at up to 25%, and gains may owe capital-gains tax (a 1031 exchange can defer both). Figures are a year-1 estimate at your 24.0% rate — not tax advice; consult a CPA.
Schools (NCES district)
- District
- Wyoming Area SD
- NCES district ID
- 4226730
- Math proficiency
- 24% ▼ -23.00%
- Reading proficiency
- 51% ▼ -13.00%
- Median HH income
- $48,856
- Composite
- 32.21/100
- National rank
- #5776
- State rank
- #381 of 539 in PA
Livability — West Pittston
- Score
- 77/100
- State rank
- #333
- US rank
- #2927
Category grades
Schools grade is shown separately in the Schools card above.
Census & demographics
- Census place
- West Pittston, PA
- Population (ZIP)
- 12,683
Population outlook (Luzerne County) Hauer SSP2
- Today (2025)
- 319,505 people
- By 2030
- 319,943 · +0.1%
- By 2040
- 322,643 · +1.0%
- By 2050
- 330,817 · +3.5%
- By 2075
- 379,145 · +18.7%
- By 2100
- 431,908 · +35.2%
Race, ethnicity, and origin ACS 2023
- Neighborhood character
- Predominantly White (92%)
- Race & ethnicity
- White 92% Hispanic / Latino 3% Black 3% Two or more races 2%
- Common ancestry
- Romanian 20% Scotch-Irish 5% Iranian 2%
- Foreign-born
- 3% · Canada
- Languages at home
- 93% English-only · Spanish 2% German/W. Germanic 1% Other Indo-European 1%
Political lean MEDSL · Luzerne
- 2024 margin
- R (+19.2) · D 40.0% · R 59.2%
- 2008→2024 swing
- -27.6pp toward R · 2008: 8.4pp · 2024: -19.2pp
- All cycles
- 2024: R+19.2 2020: R+14.4 2016: R+19.6 2012: D+4.8 2008: D+8.4
Not yet ingested
- Civics
- —
Market trends
- HPI YoY
- ▼ -76.48%
- Current HPI
- 259.5339
- Rent YoY
- —
- Metro
- —
- State GDP YoY
- ▲ 1.68%
- F500 in state
- 34
Industry mix (Fortune 500 HQ in PA)
| Industry | F500 HQs | Revenue |
|---|---|---|
| Healthcare | 2 | $309B |
|
||
| Insurance | 2 | $27B |
|
||
| Telecommunications / Media | 1 | $124B |
|
||
| Industrial Distribution | 1 | $22B |
|
||
| Financial Services | 1 | $20B |
|
||
| Chemicals / Materials | 1 | $18B |
|
||
Price history
+221.1% since first listed3 events — show timeline
- 2026-02-03 Pending — LCAR
- 2026-01-26 Listed $140,000 LCAR
- 2011-10-31 Sold (Public Records) $43,600 Public Records
Property tax history
+3.1%/yrLatest (2026): $1,737 · +2.6% YoY. Source: county tax records.
Cash-flow waterfall
monthlySold comps — $/sqft
last 12 mo · ≤1 miLoading sold comps…