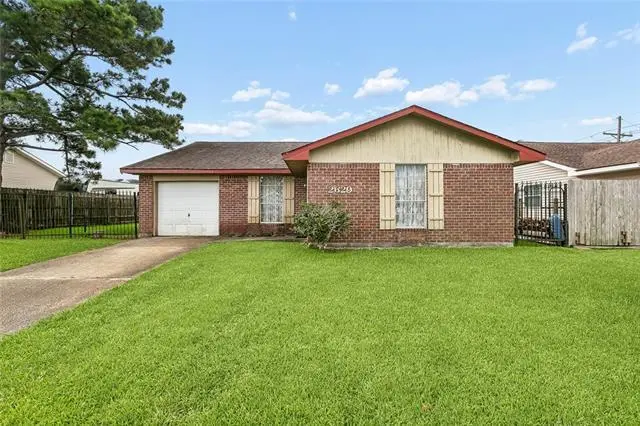
2629 Cascade Dr · Estelle, LA
Flood risk 8/10 · Major
- FEMA flood zone
- X
- Chance of flooding over 30 yrs
- 0.76%
- Est. flood insurance / yr
- $507 – $1,088
Fire risk 1/10 · Minimal
- Est. fire insurance / yr
- $1,269 – $2,357
Heat risk 10/10 · Severe
- Hot days now (above 108°F)
- 7 days/yr
- Hot days in 30 yrs
- 21 days/yr
Wind risk 10/10 · Severe
- Chance of severe wind over 30 yrs
- 99.0%
Air-quality risk 3/10 · Minor
- Unhealthy air days now
- 2 days/yr
- Unhealthy air days in 30 yrs
- 3 days/yr
Risk factors via First Street. Map © Google.
Why this score? — see what drove the B grade
The composite is a weighted blend of 9 inputs, each scored 0–100. Each bar is that input's sub-score; the figure is the points it added to the 100-point composite (weight × sub-score).
- Cash flow +28.6/30.0
- ARV discount +15.0/15.0
- DSCR +10.0/10.0
- 1% rule +7.2/10.0
- Livability +3.2/5.0
- Rent growth +2.8/5.0
- Schools +2.5/10.0
- Condition / age +2.5/5.0
- Appreciation +0.0/10.0
$170,000
🖨 Deal sheet (PDF) 📄 Offer letter ✓ Due diligence
Listing remarks MLS
Welcome home! This spacious 4-bedroom, 2-bathroom residence is ready for its next chapter. Featuring two distinct living spaces, you are greeted by a welcoming front living room upon entry, plus a second family room in the back that flows seamlessly into the kitchen. The kitchen is bathed in natural light, thanks to an abundance of windows. Designed with a desirable split floor plan, the primary suite features a generous walk-in closet and sits privately off the main living area, while three additional bedrooms and a full bath are tucked down the hallway. Enjoy incredible peace of mind with major mechanical updates already done: a brand-new HVAC and water heater (1 year old) and a solid roof (10 years old). With great bones and solid systems, this 1978 gem is a fantastic opportunity--bring your favorite paint colors and flooring ideas to easily transform this house into your dream home!
Key facts
- Walk-in closet
- Split floor plan
- Second family room
Tags
Property features AI
Exterior
- Parking: Garage (one space)
- Utilities: Public water; Public sewer
- Home design: Single-story; Brick and HardiPlank-type exterior; Shingle roof; Slab foundation; Average condition
- Construction: Built with brick and HardiPlank-type materials
- Exterior features: Fence; Outside city limits; Rectangular lot; Lot dimensions: 76 x 97 x 61 x 95
Interior
- Kitchen: Dishwasher; Range; Refrigerator
- Bathrooms: 2 full bathrooms
- Heating & cooling: Central heating; Central air conditioning
- Interior features: Ceiling fan(s)
- Laundry & utility: Washer hookup; Dryer hookup
Neighborhood map
What this means for you Summary
Snapshot
- This is a 4-bed/2.0-bath single-family listed at $170k.
Deal economics
- At list price, monthly cash flow is $496 ($6k/yr) — positive.
- The deal already cash-flows at list — no discount required.
- Meets the 1% rule at list price ($2k rent vs $170k).
- Recommended offer: $167k (1.5% below list) — sets the bar for market timing.
- Cap rate 10.3% vs local median 5.6% in Estelle — top-decile yield for the area; either an underpriced asset or a hidden risk that comps aren't pricing in. Stress-test before assuming the spread holds.
Location & tenants
- Location reads 64/100 on livability (#183 in LA) — a middle-class / working-renter tenant base. Strengths: cost of living A+, housing A+, employment B; Watch: schools F, crime F, amenities F.
- Jefferson Parish (suburban): math 24% / reading 34% proficiency, ranked #44 of 98 in LA (top 45%) — low school quality limits family demand, transient renter base, plan for 1-2y turnover; 70% free/reduced lunch — lower-income household profile, screen leases tightly.
- Market conditions: Rents rising (+1.1%/yr); 298 active listings in the ZIP; 11 comparable units currently listed for rent nearby; rentals at typical pace (median 25d on market — plan ~3-4 weeks tenant-placement turnaround); 518 units permitted in Jefferson Parish in 2024 (43 in 5+ unit buildings).
- At $2,068/mo this rent would consume 45% of the median local household income ($55k/yr) (locally 1807% of renters already pay >50% of income on rent) — very limited rent-growth headroom before tenants either downsize or default.
Forward outlook
- Local home prices are declining (-3.0%/yr); year-one equity from $1k of loan paydown is wiped out by about $5k of value loss. Plan a longer hold.
Negotiation context
- It's been on market 15 days — a 2% lower offer ($167k) is reasonable based on typical stale-listing flexibility.
- 2 sale attempts with the ask held roughly flat each time — persistent listings suggest the price (not the market) is what's stuck; bring a comps-based counter.
- Current owner paid $42k; list at $170k implies a 310% gain — meaningful room to come down on a strong offer.
Risks & watch-outs
- Watch-outs: flood insurance adds $66/mo.
- Climate carrying-cost: severe flood risk; severe wind risk, 99% chance of damaging wind over 30y; extreme-heat days projected 7→21/yr by 2055 (HVAC capex compounding) — expect insurance premiums to compound above CPI over the hold.
Questions for the listing agent
- Built in 1978 — when were the roof, HVAC, electrical panel, plumbing, and water heater last replaced?
- What's the actual annual flood-insurance premium (NFIP or private), and is the property in a SFHA with mandatory coverage?
- Is there a deadline driving the sale (1031 exchange, divorce, estate, relocation)? That informs how much negotiation room exists.
- Schools are F-rated, which usually means shorter tenancies and higher turnover. Who's the typical renter profile here, and what's been the actual vacancy rate?
- Crime grade is F in this area — have there been break-ins, vandalism, or insurance claims at this property in the last 3 years? What carrier currently insures it and at what premium?
- What's the average days-on-market for RENTAL listings here right now (not sales)? A rising rental-DOM trend means longer vacancies and softer asking-rent achievability than the comps imply.
- What's the recent tenant-quality profile in this submarket — average credit score on applications, eviction rate, late-payment / NSF rate, and stable-employment percentage? A property-management company in the area should have these aggregated.
- How much new for-sale + rental construction is in the pipeline within 1–3 miles? Heavy new supply typically softens prices + rents 12–24 months out; constrained supply supports both.
Investment metrics
- 1% rule
- 1.22% ✓
- Cap rate
- 10.27%
- Cash-on-cash
- 14.19%
- DSCR
- 1.63
- GRM
- 6.9
CMA / ARV
- ARV (on-the-fly)
- $230,400
- Comps found
- 12
Show comp detail 12 sales within ~0.75 mi
| Address | Dist | Beds/Ba | Sqft | Sold | Price | $/sf | Match |
|---|---|---|---|---|---|---|---|
| 2625 Misty Meadows Dr | 0.06mi | 4/2.0 | 1,520 (-1%) | 2mo | $215,000 | $141 | 94 |
| 2529 Misty Meadows Dr | 0.13mi | 3/2.0 (-1) | 1,644 (+7%) | 6mo | $247,000 | $150 | 72 |
| 2820 Pritchard Rd | 0.44mi | 3/2.0 (-1) | 1,560 (+2%) | 4mo | $159,900 | $103 | 68 |
| 2729 Blanche St | 0.54mi | 4/2.0 | 1,494 (-3%) | 2mo | $244,000 | $163 | 68 |
| 2708 Pritchard Rd | 0.41mi | 3/2.0 (-1) | 1,466 (-5%) | 2mo | $266,000 | $181 | 67 |
| 2700 Dolores Dr | 0.37mi | 4/2.0 | 1,400 (-9%) | 2mo | $207,000 | $148 | 66 |
| 3829 Alexander Ln | 0.60mi | 3/2.0 (-1) | 1,600 (+4%) | 2mo | $245,000 | $153 | 58 |
| 2930 Laurie Ln | 0.50mi | 3/2.0 (-1) | 1,641 (+7%) | 6mo | $245,000 | $149 | 55 |
| 2401 Taffy Dr | 0.72mi | 4/2.0 | 1,456 (-5%) | 5mo | $95,000 | $65 | 54 |
| 2516 Arizona Dr | 0.40mi | 3/2.0 (-1) | 1,735 (+13%) | 6mo | $173,000 | $100 | 50 |
| 2824 Virginia Lee Dr | 0.52mi | 3/2.0 (-1) | 1,353 (-12%) | 3mo | $215,000 | $159 | 48 |
| 2404 Taffy Dr | 0.73mi | 3/2.0 (-1) | 1,454 (-5%) | 8mo | $228,000 | $157 | 46 |
Match score weights: distance 35% · size 25% · config 20% · recency 20%. Top-matched comps best support the ARV.
Projected returns pro-forma
-3.0% appreciation · 1.05% rent growth · sell at horizon
- IRR
- 0.1%
- Equity multiple
- 1.00×
- Total profit
- $94
- Equity at exit
- $25,348
- IRR
- 7.6%
- Equity multiple
- 1.53×
- Total profit
- $25,116
- Equity at exit
- $14,698
Cash invested: $47,600 (down + closing). Projections, not guarantees.
Landlord ↔ Tenant lean methodology
- Overall (STATE)
- 90 Strongly Landlord-Friendly
- State Louisiana
- 90 Strongly Landlord-Friendly · R+12
- County
- — inherits STATE
- City
- — inherits STATE
ZIP-level market 70072
- Rents YoY
- 1.1%
- Active inventory
- 298
- Price-to-rent
- 6.9×
Monthly cashflow live
- Estimated rent
- $2,068 high interval (Pro) →
- Mortgage (P&I)
- −$891
- Tax from tax record
- −$109 /mo · $1,303/yr
- Insurance
- −$71
- Flood insurance flood zone
- −$66 /mo · $798/yr
- HOA
- −$0
- Vacancy / Maint / Mgmt
- −$434
- Net cashflow
- $496
Break-even live
Sensitivity live
| Price | -10% $593 | -5% $544 | +0% $496 | +5% $448 | +10% $400 |
|---|---|---|---|---|---|
| Rent | -10% $333 | -5% $415 | +0% $496 | +5% $578 | +10% $660 |
| Rate | -1.0pp $582 | -0.5pp $540 | base $496 | +0.5pp $452 | +1.0pp $407 |
UW: 25.0% down · 7.5% · 30yr · 1.5% tax · 5.0% vac · 8.0% maint · 8.0% mgmt
Financing live
Cash to close
- Down payment
- $42,500
- Closing costs
- $5,100
- Reserves months
- —
- Total cash needed
- —
Loan-product check · same deal, 3 products live
Conventional
25% down · 7.5% · 30yr
- Down + closing
- —
- Monthly P&I
- —
- Monthly cashflow
- —
- DSCR
- —
- Eligible?
- —
Personal DTI + credit; lowest rate.
DSCR
20% down · 8.5% · 30yr
- Down + closing
- —
- Monthly P&I
- —
- Monthly cashflow
- —
- DSCR
- —
- Eligible?
- —
No personal income docs; deal must DSCR.
Hard money
10% down · 12.0% · 12mo
- Down + closing
- —
- Monthly P&I
- —
- Monthly cashflow
- —
- DSCR
- —
- Eligible?
- —
Short-term bridge; refi at stabilization.
Rent comps 11 comps
| Address | Beds | Baths | Sqft | Rent | $/sqft | DOM | Units | Dist |
|---|---|---|---|---|---|---|---|---|
| 2417 Highland Meadows Dr Marrero, LA | 4.0 | 2.0 | 1400 | $1,950 | $1.39 | 45d | 1 | 0.22mi |
| 2544 Jeanne St Marrero, LA | 4.0 | 2.0 | 1158 | $2,300 | $1.99 | 25d | 1 | 0.32mi |
| 2425 Ramsey Dr Marrero, LA | 4.0 | 2.0 | 1500 | $1,800 | $1.20 | 3d | 1 | 0.55mi |
| 2748 Erin Dr Marrero, LA | 3.0 | 2.0 | 1460 | $1,850 | $1.27 | 25d | 1 | 0.65mi |
| 116 Sunrise Dr Marrero, LA | 3.0 | 1.5 | 1225 | $1,750 | $1.43 | 45d | 1 | 0.77mi |
| 2704 Sieglinde Ct Marrero, LA | 3.0 | 2.0 | 1122 | $1,850 | $1.65 | 25d | 1 | 0.89mi |
| 2612 Susie Ct Marrero, LA | 3.0 | 2.0 | 1852 | $2,200 | $1.19 | 21d | 1 | 1.11mi |
| 5913 S Oak Dr Marrero, LA | 4.0 | 2.0 | 1300 | $1,950 | $1.50 | 25d | 1 | 1.15mi |
| 4613 Ames Blvd Marrero, LA | 3.0 | 2.0 | 1461 | $2,350 | $1.61 | 45d | 1 | 1.21mi |
| 5300 Alpaca Dr Marrero, LA | 4.0 | 2.0 | 1650 | $1,995 | $1.21 | 15d | 1 | 1.22mi |
| 2632 Dove Ave Unit NA Marrero, LA | 3.0 | 2.0 | 1250 | $1,650 | $1.32 | 45d | 1 | 1.30mi |
Listing history 11 events
-
2026-06-21days on market $170,000 Active 15 DOM
-
2026-06-18days on market $170,000 Active 12 DOM
-
2026-06-17days on market $170,000 Active 11 DOM
-
2026-06-16days on market $170,000 Active 10 DOM
-
2026-06-15days on market $170,000 Active 9 DOM
-
2026-06-13days on market $170,000 Active 7 DOM
-
2026-06-10days on market $170,000 Active 4 DOM
-
2026-06-09days on market $170,000 Active 3 DOM
-
2026-06-08days on market $170,000 Active 2 DOM
-
2026-06-07remarks 699-char remark
-
2026-06-07$170,000 Active 1 DOM
ⓘ Source: listings_history table (triggers on properties + properties_extension) + one-shot
backfill from property_details.listing_events for pre-trigger history.
Tax reassessment forecast LA · Resets to sale price
- Current annual tax
- $1,303 · $109/mo
- Projected year-2 tax
- $1,303 · $109/mo
- Expected delta
- $0/yr ($0/mo · 0.0%)
ⓘ Screening estimate from a state-policy table — verify with the county assessor before closing.
Climate risk First Street
- Flood 8/10 Severe FEMA zone X · 76% chance over 30 yrs
- Wildfire 1/10 Low
- Heat 10/10 Extreme 7 d/yr ≥108°F today · 21 d/yr by 30 yrs out
- Wind 10/10 Extreme 99% chance of damaging wind over 30 yrs
- Air quality 3/10 Moderate 2 unhealthy d/yr today · 3 by 30 yrs out
Nearby sold comps map
Loading sold comps map…
Walkable amenities ~0.75 mi
Loading nearby amenities…
Taxation est. · year 1
- Rental income
- $24,816
- − Mortgage interest
- −$9,523
- − Property taxes
- −$1,303
- − Insurance
- −$1,648
- − Repairs & maintenance
- −$1,985
- − Management
- −$1,985
- − Depreciation
- −$4,945
- Taxable income
- $3,427
- Est. tax owed @ 24.0%
- −$822
- After-tax cash flow
- $5,134/yr
For passive investors: Depreciation is non-cash, so a rental often shows a tax loss while cash-flowing — sheltering income. Rental losses are passive: they offset passive income freely, and up to $25,000/yr can offset ordinary (W-2) income if you actively participate and your MAGI is under $100k (phasing out to $0 by $150k); unused losses carry forward. On sale, claimed depreciation is recaptured at up to 25%, and gains may owe capital-gains tax (a 1031 exchange can defer both). Figures are a year-1 estimate at your 24.0% rate — not tax advice; consult a CPA.
Schools (NCES district)
- District
- Jefferson Parish
- NCES district ID
- 2200840
- Math proficiency
- 24% ▼ -36.00%
- Reading proficiency
- 34% ▼ -30.00%
- Median HH income
- $48,421
- Composite
- 25.19/100
- National rank
- #7511
- State rank
- #44 of 98 in LA
Livability — Estelle
- Score
- 64/100
- State rank
- #183
- US rank
- #14840
Category grades
Schools grade is shown separately in the Schools card above.
Census & demographics
- Census place
- Estelle, LA
- County
- Jefferson Parish · 426,999 people
- Metro
- New Orleans-Metairie, LA
- Population (ZIP)
- 55,693
- Household income
- $54,885
- Rent vs Own
- Severe rent burden
- 1807.0
Population outlook (Jefferson County) Hauer SSP2
- Today (2025)
- 451,696 people
- By 2030
- 455,451 · +0.8%
- By 2040
- 458,308 · +1.5%
- By 2050
- 461,031 · +2.1%
- By 2075
- 476,351 · +5.5%
- By 2100
- 499,377 · +10.6%
Race, ethnicity, and origin ACS 2023
- Neighborhood character
- Diverse neighborhood (Simpson 0.67)
- Race & ethnicity
- Black 40% White 39% Hispanic / Latino 12% Two or more races 7% Asian 5%
- Hispanic origin (detail)
- Mexican 4% Dominican 1%
- Common ancestry
- Lithuanian 12% Hispanic 1%
- Foreign-born
- 10% · Canada, Vietnam, Jamaica
- Languages at home
- 85% English-only · Spanish 8% Vietnamese 4% French/Haitian/Cajun 2%
Political lean MEDSL · Jefferson
- 2024 margin
- R (+12.9) · D 42.5% · R 55.5% · Other 2.1%
- 2008→2024 swing
- +13.6pp toward D · 2008: -26.6pp · 2024: -12.9pp
- All cycles
- 2024: R+12.9 2020: R+11.1 2016: R+14.8 2012: R+18.4 2008: R+26.6
Not yet ingested
- Civics
- —
Market trends
- HPI YoY
- ▼ -89.87%
- Current HPI
- 161.7477
- Rent YoY
- ▲ 1.05%
- Metro
- New Orleans-Metairie, LA
- State GDP YoY
- ▲ 3.29%
- F500 in state
- 10
Industry mix (Fortune 500 HQ in LA)
| Industry | F500 HQs | Revenue |
|---|---|---|
| Telecommunications | 2 | $23B |
|
||
| Utilities | 1 | $12B |
|
||
| Wholesale / Distribution | 1 | $5B |
|
||
| Advertising | 1 | $2B |
|
||
Price history
+309.6% since first listed3 events — show timeline
- 2026-06-06 Listed $170,000 AcadianaMLS
- 2026-06-06 Listed $170,000 GSREIN
- 1981-12-01 Sold (Public Records) $41,500 Public Records
Property tax history
+1.1%/yrLatest (2025): $1,303 · +0.3% YoY. Source: county tax records.
Cash-flow waterfall
monthlySold comps — $/sqft
last 12 mo · ≤1 miLoading sold comps…