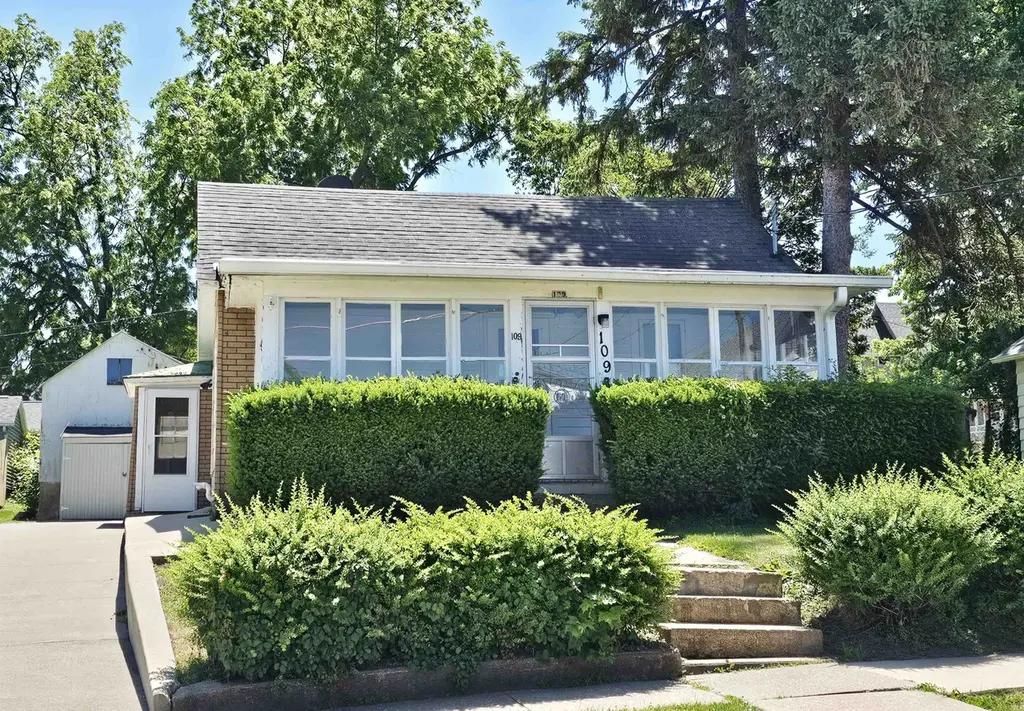
109 E Maple St · Maquoketa, IA
Flood risk 1/10 · Minimal
- FEMA flood zone
- X (unshaded)
- Chance of flooding over 30 yrs
- 0.0%
- Est. flood insurance / yr
- $473 – $860
Fire risk 4/10 · Minor
- Est. fire insurance / yr
- $902 – $1,676
Heat risk 3/10 · Minor
- Hot days now (above 102°F)
- 7 days/yr
- Hot days in 30 yrs
- 15 days/yr
Wind risk 2/10 · Minimal
- Chance of severe wind over 30 yrs
- —
Air-quality risk 2/10 · Minimal
- Unhealthy air days now
- 2 days/yr
- Unhealthy air days in 30 yrs
- 2 days/yr
Risk factors via First Street. Map © Google.
Why this score? — see what drove the B grade
The composite is a weighted blend of 9 inputs, each scored 0–100. Each bar is that input's sub-score; the figure is the points it added to the 100-point composite (weight × sub-score).
- Cash flow +30.0/30.0
- DSCR +10.0/10.0
- 1% rule +9.9/10.0
- ARV discount +7.5/15.0
- Schools +4.6/10.0
- Livability +3.5/5.0
- Rent growth +2.5/5.0
- Condition / age +2.5/5.0
- Appreciation +0.0/10.0
$59,000
🖨 Deal sheet (PDF) 📄 Offer letter ✓ Due diligence
Listing remarks
This is a great home for a first time buyer or investor. 2 bedroom, 1 bath, enclosed front porch, covered back entrance, dining room, new concrete, some windows, newer water heater, central air, breakers, added insulation, small garage, storage sheds. Take a look today - this is an affordable way into home ownership.
Key facts
- New concrete
- Dining room
- Newer water heater
Tags
Property features AI
Exterior
- Parking: Detached parking (1 space)
- Utilities: Public water; Public sewer
- Home design: Single-family residence, detached; One story
- Construction: Built with other construction materials; Stone foundation; Flat and shingle roof
- Exterior features: Porch with a screened area; Shed(s); Has a view
Interior
- Kitchen: Range
- Bedrooms: 2 bedrooms on the main level
- Bathrooms: 1 full bathroom (on the main level)
- Heating & cooling: Forced air heating (natural gas); Central air conditioning
- Interior features: Window treatments; Partial basement
- Laundry & utility: Laundry located on the lower level
Neighborhood map
What this means for you Summary
Snapshot
- This is a 2-bed/2.0-bath single-family listed at $59k.
Deal economics
- At list price, monthly cash flow is $316 ($4k/yr) — positive.
- The deal already cash-flows at list — no discount required.
- Meets the 1% rule at list price ($877 rent vs $59k).
Location & tenants
- Location reads 70/100 on livability (#362 in IA) — a middle-class / working-renter tenant base. Strengths: cost of living A+, housing A+, health & safety A+; Watch: amenities F, commute F, employment D-.
- Maquoketa Community School District (town): math 52% / reading 57% proficiency, ranked #270 of 289 in IA (top 93%) — acceptable for families but not a draw, mixed tenant base, ~2y average lease.
- Zoned schools: Cardinal Elementary School (271 students, 58% FRL); Maquoketa Middle School (math 46% / reading 55%, grade C, #214 of 246 statewide, top 87%, 315 students, 53% FRL); Maquoketa Community High School (math 63% / reading 68%, grade B, #204 of 336 statewide, top 61%, 498 students, 48% FRL) — zoned schools at 53% FRL track the district average.
- Market conditions: 35 active listings in the ZIP; 20 units permitted in Jackson County in 2024 (0 in 5+ unit buildings).
Forward outlook
- Local home prices are declining (-3.0%/yr); year-one equity from $408 of loan paydown is wiped out by about $2k of value loss. Plan a longer hold.
- Jackson County population projected at -15% by 2050 — secular population decline; favor cash flow + early exit over multi-decade hold.
- At projected returns (-3.0% appreciation + 3.0% rent growth), your $17k cash investment doubles in ~6 years — after that, you're playing with house money.
Negotiation context
- Only 2 days on market — expect competitive offers; lowballing is unlikely to land.
Risks & watch-outs
- Watch-outs: built in 1880 — expect roof / HVAC / electrical / plumbing capex.
Questions for the listing agent
- Built in 1880 — when were the roof, HVAC, electrical panel, plumbing, and water heater last replaced?
- Is there a deadline driving the sale (1031 exchange, divorce, estate, relocation)? That informs how much negotiation room exists.
- Schools are B-rated — typically a magnet for longer-tenancy family renters. What's the average tenant stay here, and is there a school-zone premium baked into asking?
- What's the average days-on-market for RENTAL listings here right now (not sales)? A rising rental-DOM trend means longer vacancies and softer asking-rent achievability than the comps imply.
- What's the recent tenant-quality profile in this submarket — average credit score on applications, eviction rate, late-payment / NSF rate, and stable-employment percentage? A property-management company in the area should have these aggregated.
- How much new for-sale + rental construction is in the pipeline within 1–3 miles? Heavy new supply typically softens prices + rents 12–24 months out; constrained supply supports both.
Investment metrics
- 1% rule
- 1.49% ✓
- Cap rate
- 12.72%
- Cash-on-cash
- 22.97%
- DSCR
- 2.02
- GRM
- 5.6
CMA / ARV
- ARV (on-the-fly)
- $119,808
- Comps found
- 12
Show comp detail 12 sales within ~0.75 mi
| Address | Dist | Beds/Ba | Sqft | Sold | Price | $/sf | Match |
|---|---|---|---|---|---|---|---|
| 407 S Niagara St | 0.21mi | 2/1.0 | 864 (-8%) | 6mo | $78,500 | $91 | 68 |
| 309 S Vermont St | 0.42mi | 2/1.0 | 994 (+6%) | 6mo | $55,000 | $55 | 61 |
| 312 N Eliza St | 0.51mi | 2/1.0 | 960 (+3%) | 9mo | $145,000 | $151 | 60 |
| 212 S Jones Ave | 0.30mi | 2/2.0 | 1,008 (+8%) | 16mo | $140,000 | $139 | 60 |
| 109 N Dearborn St | 0.44mi | 2/1.0 | 988 (+6%) | 8mo | $95,000 | $96 | 60 |
| 310 N Dearborn St | 0.58mi | 1/1.0 (-1) | 951 (+2%) | 5mo | $108,000 | $114 | 57 |
| 209 S Vermont St | 0.42mi | 2/1.0 | 1,038 (+11%) | 5mo | $157,000 | $151 | 54 |
| 108 W Monroe St | 0.63mi | 1/1.0 (-1) | 1,001 (+7%) | 4mo | $79,900 | $80 | 47 |
| 405 Thomas Ave | 0.62mi | 2/1.5 | 1,008 (+8%) | 16mo | $149,900 | $149 | 42 |
| 316 N Dearborn St | 0.61mi | 2/1.0 | 1,056 (+13%) | 14mo | $130,000 | $123 | 35 |
| 407 N Walnut St | 0.71mi | 3/1.5 (+1) | 816 (-13%) | 12mo | $154,000 | $189 | 29 |
| 410 Butternut St | 0.74mi | 3/2.0 (+1) | 1,056 (+13%) | 18mo | $135,000 | $128 | 24 |
Match score weights: distance 35% · size 25% · config 20% · recency 20%. Top-matched comps best support the ARV.
Projected returns pro-forma
-3.0% appreciation · 3.0% rent growth · sell at horizon
- IRR
- 15.9%
- Equity multiple
- 1.64×
- Total profit
- $10,570
- Equity at exit
- $8,797
- IRR
- 24.5%
- Equity multiple
- 3.13×
- Total profit
- $35,109
- Equity at exit
- $5,101
Cash invested: $16,520 (down + closing). Projections, not guarantees.
Landlord ↔ Tenant lean methodology
- Overall (STATE)
- 83 Strongly Landlord-Friendly
- State Iowa
- 83 Strongly Landlord-Friendly · R+6
- County
- — inherits STATE
- City
- — inherits STATE
ZIP-level market 52060
- Home prices YoY
- -21.2%
- Active inventory
- 35
- Price-to-rent
- 5.6×
Monthly cashflow live
- Estimated rent
- $877 medium interval (Pro) →
- Mortgage (P&I)
- −$309
- Tax from tax record
- −$43 /mo · $516/yr
- Insurance
- −$25
- HOA
- −$0
- Vacancy / Maint / Mgmt
- −$184
- Net cashflow
- $316
Break-even live
Sensitivity live
| Price | -10% $350 | -5% $333 | +0% $316 | +5% $299 | +10% $283 |
|---|---|---|---|---|---|
| Rent | -10% $247 | -5% $281 | +0% $316 | +5% $351 | +10% $385 |
| Rate | -1.0pp $346 | -0.5pp $331 | base $316 | +0.5pp $301 | +1.0pp $285 |
UW: 25.0% down · 7.5% · 30yr · 1.5% tax · 5.0% vac · 8.0% maint · 8.0% mgmt
Financing live
Cash to close
- Down payment
- $14,750
- Closing costs
- $1,770
- Reserves months
- —
- Total cash needed
- —
Loan-product check · same deal, 3 products live
Conventional
25% down · 7.5% · 30yr
- Down + closing
- —
- Monthly P&I
- —
- Monthly cashflow
- —
- DSCR
- —
- Eligible?
- —
Personal DTI + credit; lowest rate.
DSCR
20% down · 8.5% · 30yr
- Down + closing
- —
- Monthly P&I
- —
- Monthly cashflow
- —
- DSCR
- —
- Eligible?
- —
No personal income docs; deal must DSCR.
Hard money
10% down · 12.0% · 12mo
- Down + closing
- —
- Monthly P&I
- —
- Monthly cashflow
- —
- DSCR
- —
- Eligible?
- —
Short-term bridge; refi at stabilization.
Listing history 3 events
-
2026-06-05statusdays on market $59,000 Pending 2 DOM
-
2026-06-03remarks 318-char remark
-
2026-06-03$59,000 Active 1 DOM
ⓘ Source: listings_history table (triggers on properties + properties_extension) + one-shot
backfill from property_details.listing_events for pre-trigger history.
Tax reassessment forecast IA · Partial reset (capped growth)
- Current annual tax
- $516 · $43/mo
- Projected year-2 tax
- $721 · $60/mo
- Expected delta
- +$205/yr (+$17/mo · 39.8%)
ⓘ Screening estimate from a state-policy table — verify with the county assessor before closing.
Climate risk First Street
- Flood 1/10 Low FEMA zone X (unshaded) · 0% chance over 30 yrs
- Wildfire 4/10 Moderate
- Heat 3/10 Moderate 7 d/yr ≥102°F today · 15 d/yr by 30 yrs out
- Wind 2/10 Low
- Air quality 2/10 Low 2 unhealthy d/yr today · 2 by 30 yrs out
Nearby sold comps map
Loading sold comps map…
Walkable amenities ~0.75 mi
Loading nearby amenities…
Taxation est. · year 1
- Rental income
- $10,529
- − Mortgage interest
- −$3,305
- − Property taxes
- −$516
- − Insurance
- −$295
- − Repairs & maintenance
- −$842
- − Management
- −$842
- − Depreciation
- −$1,716
- Taxable income
- $3,012
- Est. tax owed @ 24.0%
- −$723
- After-tax cash flow
- $3,071/yr
For passive investors: Depreciation is non-cash, so a rental often shows a tax loss while cash-flowing — sheltering income. Rental losses are passive: they offset passive income freely, and up to $25,000/yr can offset ordinary (W-2) income if you actively participate and your MAGI is under $100k (phasing out to $0 by $150k); unused losses carry forward. On sale, claimed depreciation is recaptured at up to 25%, and gains may owe capital-gains tax (a 1031 exchange can defer both). Figures are a year-1 estimate at your 24.0% rate — not tax advice; consult a CPA.
Schools (NCES district)
- District
- Maquoketa Community School District
- NCES district ID
- 1918510
- Math proficiency
- 52% ▼ -9.00%
- Reading proficiency
- 57% ▼ -5.00%
- Median HH income
- $39,880
- Composite
- 45.54/100
- National rank
- #2602
- State rank
- #270 of 289 in IA
Livability — Maquoketa
- Score
- 70/100
- State rank
- #362
- US rank
- #7540
Category grades
Schools grade is shown separately in the Schools card above.
Census & demographics
- Census place
- Maquoketa, IA
- Population (ZIP)
- 8,139
Population outlook (Jackson County) Hauer SSP2
- Today (2025)
- 18,736 people
- By 2030
- 18,227 · -2.7%
- By 2040
- 17,049 · -9.0%
- By 2050
- 15,848 · -15.4%
- By 2075
- 13,660 · -27.1%
- By 2100
- 11,167 · -40.4%
Race, ethnicity, and origin ACS 2023
- Neighborhood character
- Predominantly White (95%)
- Race & ethnicity
- White 95% Two or more races 2% Black 2%
- Common ancestry
- Romanian 2% Slovak 2% Portuguese 2%
- Foreign-born
- 1%
- Languages at home
- 97% English-only · German/W. Germanic 1% Spanish 1%
Political lean MEDSL · Jackson
- 2024 margin
- Solid R (+32.5) · D 33.1% · R 65.6% · Other 1.3%
- 2008→2024 swing
- -56.9pp toward R · 2008: 24.4pp · 2024: -32.5pp
- All cycles
- 2024: R+32.5 2020: R+26.1 2016: R+19.4 2012: D+16.8 2008: D+24.4
Not yet ingested
- Civics
- —
Market trends
- HPI YoY
- ▼ -57.28%
- Current HPI
- 213.2315
- Rent YoY
- —
- Metro
- —
- State GDP YoY
- ▲ 2.48%
- F500 in state
- 4
Industry mix (Fortune 500 HQ in IA)
| Industry | F500 HQs | Revenue |
|---|---|---|
| Financial Services | 1 | $16B |
|
||
| Retail / Convenience | 1 | $15B |
|
||
Price history
1 event — show timeline
- 2026-06-02 Listed $59,000 ECIMLS
Property tax history
+1.5%/yrLatest (2025): $516 · +2.8% YoY. Source: county tax records.
Cash-flow waterfall
monthlySold comps — $/sqft
last 12 mo · ≤1 miLoading sold comps…