 🏗️ New Construction
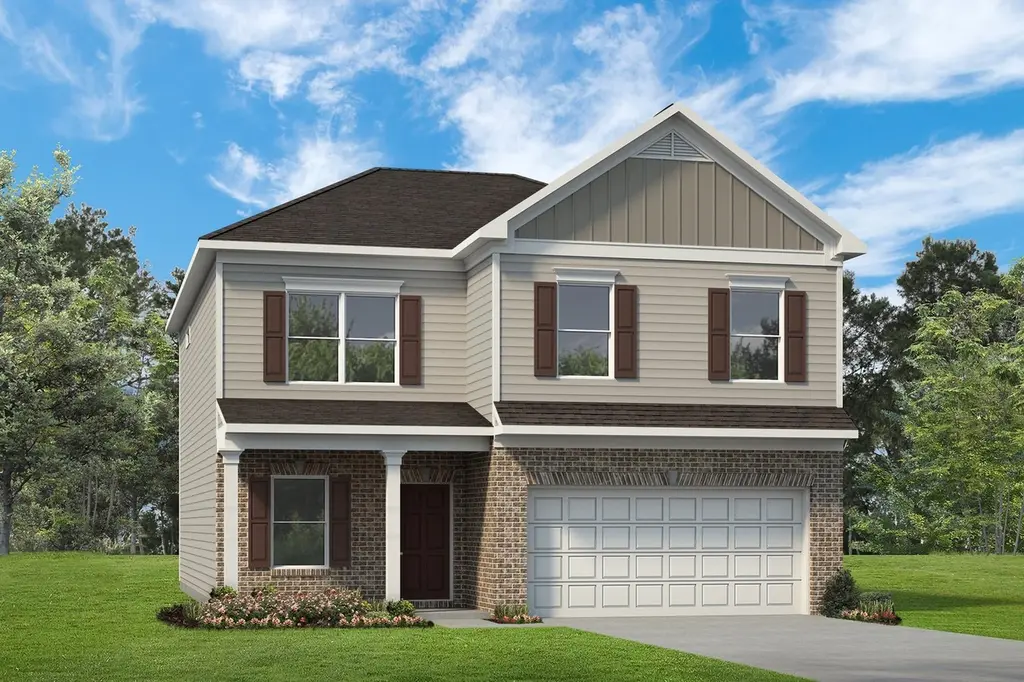
The Harrington Plan · Kingston, GA
Flood risk No data
- FEMA flood zone
- —
- Chance of flooding over 30 yrs
- —
- Est. flood insurance / yr
- —
Fire risk No data
- Est. fire insurance / yr
- —
Heat risk No data
- Hot days now (above threshold)
- —
- Hot days in 30 yrs
- —
Wind risk No data
- Chance of severe wind over 30 yrs
- —
Air-quality risk No data
- Unhealthy air days now
- —
- Unhealthy air days in 30 yrs
- —
Risk factors via First Street. Map © Google.
Why this score? — see what drove the D- grade
The composite is a weighted blend of 9 inputs, each scored 0–100. Each bar is that input's sub-score; the figure is the points it added to the 100-point composite (weight × sub-score).
- Cash flow +10.3/30.0
- ARV discount +7.5/15.0
- Condition / age +4.0/5.0
- Livability +3.2/5.0
- 1% rule +3.1/10.0
- DSCR +3.0/10.0
- Schools +2.9/10.0
- Rent growth +2.5/5.0
- Appreciation +0.0/10.0
$288,900
🖨 Deal sheet (PDF) 📄 Offer letter ✓ Due diligence
Listing remarks MLS
Based on our top-selling plan, the Harrington delights with its massive second-floor owner's suite privately tucked away on the same level as its three additional bedrooms. The first floor impresses with an open concept family room, breakfast nook and large center island, plus a dining room that can be a living room, study or a 5th bedroom/bathroom. Explore your choices for the Harrington kitchen, using our Interactive Kitchen Designer Tool as well.
Key facts
- 2 parking spots
- Listed 485 days
Neighborhood map
What this means for you Summary
Snapshot
- This is a 4-bed/2.5-bath single-family listed at $289k. Condition is rated good.
Deal economics
- At list price, monthly cash flow is $-170 ($-2k/yr) — negative.
- To cash-flow at today's rent, offer at most $286k (1.1% below list).
- To meet the 1% rule (rent ≥ 1% of price), the offer needs to be $250k (13.5% below list).
- Recommended offer: $250k (13.5% below list) — sets the bar for 1% rule.
Location & tenants
- Location reads 63/100 on livability (#294 in GA) — a middle-class / working-renter tenant base. Strengths: crime A+, cost of living A+, housing B+; Watch: amenities F, commute F, employment F.
- Bartow County (rural): math 33% / reading 34% proficiency, ranked #70 of 174 in GA (top 40%) — families likely to look elsewhere, expect single-tenant / working-renter base with shorter leases.
- Zoned schools: Kingston Elementary School (math 15% / reading 21%, grade F, #926 of 1,228 statewide, top 76%, 526 students, 68% FRL); Cass Middle School (math 35% / reading 36%, grade F, #185 of 470 statewide, top 40%, 879 students, 58% FRL); Cass High School (math 17% / reading 25%, grade F, #225 of 424 statewide, top 54%, 1,551 students, 51% FRL).
- Market conditions: 115 active listings in the ZIP; 6 comparable units currently listed for rent nearby; rentals at typical pace (median 23d on market — plan ~3-4 weeks tenant-placement turnaround); 1,618 units permitted in Bartow County in 2024 (265 in 5+ unit buildings).
Forward outlook
- Local home prices are declining (-3.0%/yr); year-one equity from $2k of loan paydown is wiped out by about $9k of value loss. Plan a longer hold.
Negotiation context
- It's been on market 485 days — a 12% lower offer ($254k) is reasonable based on typical stale-listing flexibility.
Questions for the listing agent
- What do current leases actually rent for vs. the listed asking? Can we see a recent rent roll and the last 12 months of T-12 income?
- It's been on market 485 days. Have you received any prior offers? Is the seller open to a 13% concession, seller financing, or rate buy-down credit?
- Why hasn't it sold? Are there any deal-killer items the seller is aware of (foundation, flood, title, zoning, code violations)?
- Is there a deadline driving the sale (1031 exchange, divorce, estate, relocation)? That informs how much negotiation room exists.
- Schools are F-rated, which usually means shorter tenancies and higher turnover. Who's the typical renter profile here, and what's been the actual vacancy rate?
- The area grade is low — what's the realistic commute time and amenity access for the typical tenant pool here? Any planned neighborhood developments (good or bad) we should know about?
- What's the average days-on-market for RENTAL listings here right now (not sales)? A rising rental-DOM trend means longer vacancies and softer asking-rent achievability than the comps imply.
- What's the recent tenant-quality profile in this submarket — average credit score on applications, eviction rate, late-payment / NSF rate, and stable-employment percentage? A property-management company in the area should have these aggregated.
- How much new for-sale + rental construction is in the pipeline within 1–3 miles? Heavy new supply typically softens prices + rents 12–24 months out; constrained supply supports both.
Investment metrics
- 1% rule
- 0.81% ✗
- Cap rate
- 5.64%
- Cash-on-cash
- -2.34%
- DSCR
- 0.90
- GRM
- 10.3
CMA / ARV
- ARV (median comp)
- $310,227
- List price
- $288,900
- Delta
- -6.87%
- Verdict
- FAIR
- Comps
- 20 within 1.0 mi
Show comp detail 10 sales within ~0.75 mi
| Address | Dist | Beds/Ba | Sqft | Sold | Price | $/sf | Match |
|---|---|---|---|---|---|---|---|
| 76 Oxford Ln | 0.56mi | 4/2.5 | 2,486 (-3%) | 7mo | $320,000 | $129 | 63 |
| 529 Pemberton St | 0.33mi | 5/3.0 (+1) | 2,232 (-13%) | 3mo | $306,000 | $137 | 53 |
| 521 Pemberton St | 0.39mi | 5/3.0 (+1) | 2,232 (-13%) | 4mo | $305,000 | $137 | 50 |
| 65 Oxford Ln | 0.63mi | 4/2.5 | 2,192 (-14%) | 3mo | $295,000 | $135 | 44 |
| 207 Coventry Ct | 0.70mi | 5/4.0 (+1) | 2,384 (-7%) | 7mo | $315,000 | $132 | 39 |
| 552 Pemberton St | 0.24mi | 5/3.0 (+1) | 2,180 (-15%) | 22mo | $338,990 | $156 | 38 |
| 535 Pemberton St | 0.30mi | 5/3.0 (+1) | 2,180 (-15%) | 21mo | $319,888 | $147 | 36 |
| 536 Pemberton St | 0.32mi | 5/3.0 (+1) | 2,180 (-15%) | 22mo | $338,990 | $156 | 35 |
| 530 Pemberton St | 0.35mi | 5/3.0 (+1) | 2,180 (-15%) | 23mo | $338,990 | $156 | 33 |
| 11 Plymouth Ct | 0.75mi | 5/3.0 (+1) | 2,212 (-14%) | 10mo | $295,000 | $133 | 26 |
Match score weights: distance 35% · size 25% · config 20% · recency 20%. Top-matched comps best support the ARV.
Projected returns pro-forma
-3.0% appreciation · 3.0% rent growth · sell at horizon
- IRR
- -20.2%
- Equity multiple
- 0.30×
- Total profit
- $-61,038
- Equity at exit
- $46,256
- IRR
- -13.2%
- Equity multiple
- 0.23×
- Total profit
- $-66,912
- Equity at exit
- $26,823
Cash invested: $86,863 (down + closing). Projections, not guarantees.
Landlord ↔ Tenant lean methodology
- Overall (STATE)
- 90 Strongly Landlord-Friendly
- State Georgia
- 90 Strongly Landlord-Friendly · R+3
- County
- — inherits STATE
- City
- — inherits STATE
ZIP-level market 30145
- Home prices YoY
- -18.3%
- Active inventory
- 115
- Price-to-rent
- 9.6×
Monthly cashflow live
- Estimated rent
- $2,499 high interval (Pro) →
- Mortgage (P&I)
- −$1,627
- Tax est. 1.5%
- −$388 /mo · $4,653/yr
- Insurance
- −$129
- HOA
- −$0
- Vacancy / Maint / Mgmt
- −$525
- Net cashflow
- $-170
Break-even live
Sensitivity live
| Price | -10% $45 | -5% $-62 | +0% $-170 | +5% $-277 | +10% $-384 |
|---|---|---|---|---|---|
| Rent | -10% $-367 | -5% $-268 | +0% $-170 | +5% $-71 | +10% $28 |
| Rate | -1.0pp $-13 | -0.5pp $-91 | base $-170 | +0.5pp $-250 | +1.0pp $-332 |
UW: 25.0% down · 7.5% · 30yr · 1.5% tax · 5.0% vac · 8.0% maint · 8.0% mgmt
Financing live
Cash to close
- Down payment
- $77,557
- Closing costs
- $9,307
- Reserves months
- —
- Total cash needed
- —
Loan-product check · same deal, 3 products live
Conventional
25% down · 7.5% · 30yr
- Down + closing
- —
- Monthly P&I
- —
- Monthly cashflow
- —
- DSCR
- —
- Eligible?
- —
Personal DTI + credit; lowest rate.
DSCR
20% down · 8.5% · 30yr
- Down + closing
- —
- Monthly P&I
- —
- Monthly cashflow
- —
- DSCR
- —
- Eligible?
- —
No personal income docs; deal must DSCR.
Hard money
10% down · 12.0% · 12mo
- Down + closing
- —
- Monthly P&I
- —
- Monthly cashflow
- —
- DSCR
- —
- Eligible?
- —
Short-term bridge; refi at stabilization.
Rent comps 6 comps
| Address | Beds | Baths | Sqft | Rent | $/sqft | DOM | Units | Dist |
|---|---|---|---|---|---|---|---|---|
| 126 Oxford Ln Kingston, GA | 5.0 | 3.0 | 2232 | $2,695 | $1.21 | 22d | 1 | 0.20mi |
| 626 Tudor St Euharlee, GA | 5.0 | 3.0 | 2232 | $2,695 | $1.21 | 14d | 1 | 0.27mi |
| 522 Pemberton St Euharlee, GA | 4.0 | 3.0 | 1779 | $2,200 | $1.24 | 45d | 1 | 0.37mi |
| 518 Pemberton St Euharlee, GA | 4.0 | 3.0 | 1808 | $2,500 | $1.38 | 22d | 1 | 0.40mi |
| 538 Pemberton St Kingston, GA | 4.0 | 3.0 | 1808 | $2,300 | $1.27 | 45d | 1 | 0.43mi |
| 210 Coventry Ct Kingston, GA | 4.0 | 2.5 | 2014 | $1,969 | $0.98 | 3d | 1 | 0.71mi |
Listing history 16 events
-
2026-06-21days on market $288,900 Active 485 DOM
-
2026-06-18days on market $288,900 Active 482 DOM
-
2026-06-17days on market $288,900 Active 481 DOM
-
2026-06-16days on market $288,900 Active 480 DOM
-
2026-06-15days on market $288,900 Active 479 DOM
-
2026-06-13pricedays on market $288,900 Active 477 DOM
-
2026-06-09days on market $306,900 Active 473 DOM
-
2026-06-08days on market $306,900 Active 472 DOM
-
2026-06-07days on market $306,900 Active 471 DOM
-
2026-06-04days on market $306,900 Active 468 DOM
-
2026-06-03days on market $306,900 Active 467 DOM
-
2026-06-02days on market $306,900 Active 466 DOM
-
2026-06-01days on market $306,900 Active 465 DOM
-
2026-05-31days on market $306,900 Active 464 DOM
-
2026-03-20price $306,900 453-char remark
Show marketing remark (453 chars)
Based on our top-selling plan, the Harrington delights with its massive second-floor owner's suite privately tucked away on the same level as its three additional bedrooms. The first floor impresses with an open concept family room, breakfast nook and large center island, plus a dining room that can be a living room, study or a 5th bedroom/bathroom. Explore your choices for the Harrington kitchen, using our Interactive Kitchen Designer Tool as well.
-
2025-02-22$321,900 Active 453-char remark
Show marketing remark (453 chars)
Based on our top-selling plan, the Harrington delights with its massive second-floor owner's suite privately tucked away on the same level as its three additional bedrooms. The first floor impresses with an open concept family room, breakfast nook and large center island, plus a dining room that can be a living room, study or a 5th bedroom/bathroom. Explore your choices for the Harrington kitchen, using our Interactive Kitchen Designer Tool as well.
ⓘ Source: listings_history table (triggers on properties + properties_extension) + one-shot
backfill from property_details.listing_events for pre-trigger history.
Nearby sold comps map
Loading sold comps map…
Walkable amenities ~0.75 mi
Loading nearby amenities…
Taxation est. · year 1
- Rental income
- $29,988
- − Mortgage interest
- −$17,378
- − Property taxes
- −$4,653
- − Insurance
- −$1,551
- − Repairs & maintenance
- −$2,399
- − Management
- −$2,399
- − Depreciation
- −$9,025
- Taxable loss
- −$7,417
- Est. tax savings @ 24.0%
- +$1,780
- After-tax cash flow
- $-256/yr
For passive investors: Depreciation is non-cash, so a rental often shows a tax loss while cash-flowing — sheltering income. Rental losses are passive: they offset passive income freely, and up to $25,000/yr can offset ordinary (W-2) income if you actively participate and your MAGI is under $100k (phasing out to $0 by $150k); unused losses carry forward. On sale, claimed depreciation is recaptured at up to 25%, and gains may owe capital-gains tax (a 1031 exchange can defer both). Figures are a year-1 estimate at your 24.0% rate — not tax advice; consult a CPA.
Condition & rehab AI · 12 photos
This single-family home is in good condition with no major repairs needed. It offers a good balance of curb appeal and interior features, making it a solid investment.
Value-add opportunities
- Both Painting exterior and interior walls — Fresh paint enhances curb appeal and interior aesthetics.
- Both Landscaping improvements — Enhances curb appeal and adds value to the property.
- Resale Kitchen backsplash — A backsplash can add visual interest and functionality to the kitchen.
Renovation cost estimate screening
Value-add ROI direction
- Both Painting exterior and interior walls — Fresh paint enhances curb appeal and interior aesthetics. ↑
- Both Landscaping improvements — Enhances curb appeal and adds value to the property. ↑
- Resale Kitchen backsplash — A backsplash can add visual interest and functionality to the kitchen. ↑
ⓘ Cost ranges are severity-bucket heuristics (US national rule-of-thumb). Get contractor quotes + a written scope before underwriting a rehab budget.
Schools (NCES district)
- District
- Bartow County
- NCES district ID
- 1300330
- Math proficiency
- 33% ▼ -8.00%
- Reading proficiency
- 34% ▼ -7.00%
- Median HH income
- $50,596
- Composite
- 29.16/100
- National rank
- #6577
- State rank
- #70 of 174 in GA
Livability — Kingston
- Score
- 63/100
- State rank
- #294
- US rank
- #16075
Category grades
Schools grade is shown separately in the Schools card above.
Census & demographics
- Census place
- Kingston, GA
- Population (ZIP)
- 9,065
Population outlook (Bartow County) Hauer SSP2
- Today (2025)
- 107,887 people
- By 2030
- 109,594 · +1.6%
- By 2040
- 111,038 · +2.9%
- By 2050
- 109,046 · +1.1%
- By 2075
- 99,484 · -7.8%
- By 2100
- 83,431 · -22.7%
Race, ethnicity, and origin ACS 2023
- Neighborhood character
- Predominantly White (88%)
- Race & ethnicity
- White 88% Black 5% Two or more races 4% Hispanic / Latino 3%
- Common ancestry
- Slovak 3% Serbian 2% Scotch-Irish 1%
- Foreign-born
- 2% · Canada, Vietnam
- Languages at home
- 97% English-only · Spanish 3%
Political lean MEDSL · Bartow
- 2024 margin
- Solid R (+51.0) · D 24.2% · R 75.2%
- 2008→2024 swing
- -5.8pp toward R · 2008: -45.2pp · 2024: -51.0pp
- All cycles
- 2024: R+51.0 2020: R+50.7 2016: R+55.2 2012: R+51.7 2008: R+45.2
Not yet ingested
- Civics
- —
Market trends
- HPI YoY
- ▼ -63.20%
- Current HPI
- 282.8922
- Rent YoY
- —
- Metro
- —
- State GDP YoY
- ▲ 2.66%
- F500 in state
- 28
Industry mix (Fortune 500 HQ in GA)
| Industry | F500 HQs | Revenue |
|---|---|---|
| Paper / Packaging | 2 | $29B |
|
||
| Retail | 1 | $160B |
|
||
| Transportation / Logistics | 1 | $91B |
|
||
| Airlines | 1 | $62B |
|
||
| Consumer Goods | 1 | $47B |
|
||
| Utilities | 1 | $25B |
|
||
Price history
-4.7% since first listed2 events — show timeline
- 2026-03-20 Price Changed $306,900 Zillow
- 2025-02-22 Listed $321,900 Zillow
Cash-flow waterfall
monthlySold comps — $/sqft
last 12 mo · ≤1 miLoading sold comps…