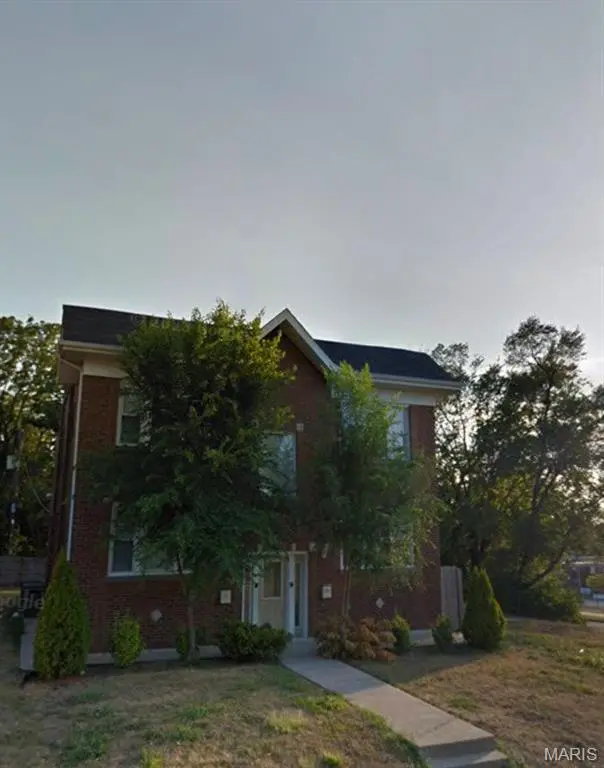
5964 Oakherst Pl Unit A · St. Louis, MO
Flood risk 1/10 · Minimal
- FEMA flood zone
- X (unshaded)
- Chance of flooding over 30 yrs
- 0.0%
- Est. flood insurance / yr
- $507 – $1,088
Fire risk 1/10 · Minimal
- Est. fire insurance / yr
- $1,054 – $1,958
Heat risk 5/10 · Moderate
- Hot days now (above 107°F)
- 7 days/yr
- Hot days in 30 yrs
- 20 days/yr
Wind risk 2/10 · Minimal
- Chance of severe wind over 30 yrs
- 1.0%
Air-quality risk 4/10 · Minor
- Unhealthy air days now
- 4 days/yr
- Unhealthy air days in 30 yrs
- 5 days/yr
Risk factors via First Street. Map © Google.
Why this score? — see what drove the C+ grade
The composite is a weighted blend of 9 inputs, each scored 0–100. Each bar is that input's sub-score; the figure is the points it added to the 100-point composite (weight × sub-score).
- Cash flow +29.8/30.0
- DSCR +10.0/10.0
- 1% rule +8.4/10.0
- ARV discount +7.5/15.0
- Rent growth +3.1/5.0
- Livability +2.5/5.0
- Condition / age +2.5/5.0
- Schools +1.2/10.0
- Appreciation +0.0/10.0
$127,000
🖨 Deal sheet 📄 Offer letter ✓ Due diligence
Listing remarks MLS
Calling all Investors! Looking to begin or expand your portfolio? Look no further! Cash flow with a solid renter in place!
Key facts
- Built 1923
- Listed 99 days
Neighborhood map
What this means for you Summary
Snapshot
- This is a 3-bed/2.0-bath condo listed at $127k.
Deal economics
- At list price, monthly cash flow is $466 ($6k/yr) — positive.
- The deal already cash-flows at list — no discount required.
- Meets the 1% rule at list price ($2k rent vs $127k).
- Recommended offer: $116k (9.0% below list) — sets the bar for market timing.
- Cap rate 10.7% vs local median 5.0% in St. Louis — top-decile yield for the area; either an underpriced asset or a hidden risk that comps aren't pricing in. Stress-test before assuming the spread holds.
Location & tenants
- Location reads: area grade C — affects rentability + tenant quality, not the cash-flow math above.
- St. Louis City (urban): math 10% / reading 18% proficiency, ranked #312 of 324 in MO (top 96%) — low school quality limits family demand, transient renter base, plan for 1-2y turnover; 80% free/reduced lunch — lower-income household profile, screen leases tightly.
- Market conditions: Rents rising (+2.4%/yr); 118 active listings in the ZIP; 40 comparable units currently listed for rent nearby; rentals at typical pace (median 18d on market — plan ~3-4 weeks tenant-placement turnaround); 294 units permitted in St. Louis city in 2024 (227 in 5+ unit buildings).
- This rent runs 45% of the median local income ($46k/yr) — at the standard rent-burdened threshold; future hikes will face affordability resistance.
Forward outlook
- Local home prices are declining (-3.0%/yr); year-one equity from $878 of loan paydown is wiped out by about $4k of value loss. Plan a longer hold.
- St. Louis County population projected to shrink 6% by 2050 — rents likely to lag national; underwrite the cash flow, not the appreciation.
- At projected returns (-3.0% appreciation + 2.4% rent growth), your $36k cash investment doubles in ~8 years — after that, you're playing with house money.
Negotiation context
- It's been on market 100 days — a 9% lower offer ($116k) is reasonable based on typical stale-listing flexibility.
Risks & watch-outs
- Watch-outs: built in 1923 — expect roof / HVAC / electrical / plumbing capex.
- Climate carrying-cost: extreme-heat days projected 7→20/yr by 2055 (HVAC capex compounding) — expect insurance premiums to compound above CPI over the hold.
Questions for the listing agent
- It's been on market 100 days. Have you received any prior offers? Is the seller open to a 9% concession, seller financing, or rate buy-down credit?
- Built in 1923 — when were the roof, HVAC, electrical panel, plumbing, and water heater last replaced?
- Any open or pending special assessments — roof, HVAC, plumbing, elevator, façade? What's the per-unit balance and payoff schedule, and is the seller paying it off at close or rolling it to the buyer?
- Why hasn't it sold? Are there any deal-killer items the seller is aware of (foundation, flood, title, zoning, code violations)?
- Is there a deadline driving the sale (1031 exchange, divorce, estate, relocation)? That informs how much negotiation room exists.
- What's the average days-on-market for RENTAL listings here right now (not sales)? A rising rental-DOM trend means longer vacancies and softer asking-rent achievability than the comps imply.
- What's the recent tenant-quality profile in this submarket — average credit score on applications, eviction rate, late-payment / NSF rate, and stable-employment percentage? A property-management company in the area should have these aggregated.
- How much new apartment / multifamily construction is in the pipeline within 1–3 miles? Heavy new supply (>2% of stock underway) typically softens rents 12–24 months out; light construction supports rent growth.
Investment metrics
- 1% rule
- 1.34% ✓
- Cap rate
- 10.70%
- Cash-on-cash
- 15.74%
- DSCR
- 1.70
- GRM
- 6.2
CMA / ARV
No comps found within radius.
Projected returns pro-forma
-3.0% appreciation · 2.39% rent growth · sell at horizon
- IRR
- 5.9%
- Equity multiple
- 1.23×
- Total profit
- $8,119
- Equity at exit
- $18,936
- IRR
- 14.8%
- Equity multiple
- 2.16×
- Total profit
- $41,224
- Equity at exit
- $10,981
Cash invested: $35,560 (down + closing). Projections, not guarantees.
Landlord ↔ Tenant lean methodology
- Overall (STATE)
- 81 Strongly Landlord-Friendly
- State Missouri
- 81 Strongly Landlord-Friendly · R+10
- County
- — inherits STATE
- City
- — inherits STATE
ZIP-level market 63112
- Rents YoY
- 2.4%
- Active inventory
- 118
- Price-to-rent
- 6.2×
Monthly cashflow live
- Estimated rent
- $1,701 high interval (Pro) →
- Mortgage (P&I)
- −$666
- Tax est. 1.5%
- −$159 /mo · $1,905/yr
- Insurance
- −$53
- HOA
- −$0
- Vacancy / Maint / Mgmt
- −$357
- Net cashflow
- $466
Break-even live
UW: 25.0% down · 7.5% · 30yr · 1.5% tax · 5.0% vac · 8.0% maint · 8.0% mgmt
Financing live
Cash to close
- Down payment
- $31,750
- Closing costs
- $3,810
- Reserves months
- —
- Total cash needed
- —
Loan-product check · same deal, 3 products live
Conventional
25% down · 7.5% · 30yr
- Down + closing
- —
- Monthly P&I
- —
- Monthly cashflow
- —
- DSCR
- —
- Eligible?
- —
Personal DTI + credit; lowest rate.
DSCR
20% down · 8.5% · 30yr
- Down + closing
- —
- Monthly P&I
- —
- Monthly cashflow
- —
- DSCR
- —
- Eligible?
- —
No personal income docs; deal must DSCR.
Hard money
10% down · 12.0% · 12mo
- Down + closing
- —
- Monthly P&I
- —
- Monthly cashflow
- —
- DSCR
- —
- Eligible?
- —
Short-term bridge; refi at stabilization.
Rent comps 40 comps
| Address | Beds | Baths | Sqft | Rent | $/sqft | DOM | Units | Dist |
|---|---|---|---|---|---|---|---|---|
| 1266 Amherst Pl Unit 2nd floor St. Louis, MO | 2.0 | 1.0 | 1050 | $1,000 | $0.95 | 43d | 1 | 0.13mi |
| 1019 N Skinker Pkwy St. Louis, MO | 1.0–3.0 | 1.0–3.0 | 1137 | $2,795 | $2.46 | 1d | 9 | 0.44mi |
| 5804 Cates Ave Unit 2 St. Louis, MO | 3.0 | 1.0 | 1500 | $1,500 | $1.00 | 4d | 1 | 0.68mi |
| 6043 Clemens Ave Apt 2E St. Louis, MO | 2.0 | 1.0 | 1023 | $1,075 | $1.05 | 23d | 1 | 0.69mi |
| 5760 Theodosia Ave Saint Louis, MO | 3.0 | 1.5 | 1702 | $1,420 | $0.83 | 23d | 1 | 0.72mi |
| 908 Eastgate Ave Unit 2N University City, MO | 2.0 | 1.0 | 900 | $1,300 | $1.44 | 4d | 1 | 0.73mi |
| 900 Eastgate Ave Saint Louis, MO | 2.0 | 1.0 | 900 | $1,095 | $1.22 | 43d | 1 | 0.74mi |
| 6543 Etzel Ave Saint Louis, MO | 3.0 | 1.0 | 967 | $1,600 | $1.65 | 17d | 1 | 0.78mi |
| 6318 Cabanne Ave Apt 1w University City, MO | 2.0 | 1.0 | 950 | $1,250 | $1.32 | 4d | 1 | 0.82mi |
| 6614 Chamberlain Ave Saint Louis, MO | 3.0 | 2.0 | 1000 | $1,820 | $1.82 | 23d | 1 | 0.84mi |
| 6274 Cates Ave Saint Louis, MO | 3.0 | 2.0 | 1400 | $2,295 | $1.64 | 43d | 1 | 0.85mi |
| 6312 Cates Ave Unit 2E University City, MO | 2.0 | 1.0 | 900 | $1,300 | $1.44 | 43d | 1 | 0.86mi |
| 6105 Delmar Blvd Saint Louis, MO | 1.0–3.0 | 1.0–3.0 | 931 | $2,610 | $2.80 | 3d | 1 | 0.88mi |
| 6261 Clemens Ave Saint Louis, MO | 3.0 | 1.0 | 1200 | $1,700 | $1.42 | 43d | 1 | 0.88mi |
| 6636 Etzel Ave Saint Louis, MO | 3.0 | 2.0 | 1019 | $1,350 | $1.32 | 19d | 1 | 0.88mi |
| 6636 Etzel Ave Saint Louis, MO | 3.0 | 1.5 | 1019 | $1,350 | $1.32 | 7d | 1 | 0.88mi |
| 5572 Clemens Ave Unit 1W St. Louis, MO | 3.0 | 1.0 | 900 | $1,025 | $1.14 | 14d | 1 | 0.90mi |
| 6036 Washington Blvd Apt 1W St. Louis, MO | 2.0 | 1.0 | 1200 | $1,350 | $1.12 | 17d | 1 | 0.95mi |
| 6048 Washington Blvd Unit 1W St. Louis, MO | 2.0 | 2.0 | 1012 | $1,475 | $1.46 | 43d | 1 | 0.96mi |
| 5608 Wabada Ave Saint Louis, MO | 2.0 | 1.0 | 910 | $1,300 | $1.43 | 16d | 1 | 1.00mi |
| 716 Westgate Ave Unit 3 University City, MO | 3.0 | 2.0 | 1500 | $2,995 | $2.00 | 43d | 1 | 1.01mi |
| 6409 Enright Ave University City, MO | 3.0 | 1.5 | 1320 | $2,420 | $1.83 | 1d | 2 | 1.01mi |
| 629 Clara Ave Apt 26 St. Louis, MO | 2.0 | 2.0 | 1155 | $1,615 | $1.40 | 43d | 1 | 1.02mi |
| 5535 Delmar Blvd St. Louis, MO | 1.0–2.0 | 1.0–2.0 | 911 | $1,970 | $2.16 | 1d | 14 | 1.03mi |
| 6009 Kingsbury Ave Saint Louis, MO | 3.0 | 1.0 | 1368 | $2,000 | $1.46 | 3d | 1 | 1.03mi |
| 6009 Kingsbury Ave Saint Louis, MO | 2.0 | 1.0 | 1368 | $1,300 | $0.95 | 23d | 1 | 1.03mi |
| 6017 Kingsbury Ave Unit 2f St. Louis, MO | 4.0 | 1.0 | 1500 | $3,250 | $2.17 | 17d | 1 | 1.03mi |
| 6017 Kingsbury Ave Unit 1F St. Louis, MO | 3.0 | 1.0 | 1600 | $2,700 | $1.69 | 17d | 1 | 1.04mi |
| 5560 Delmar Blvd Saint Louis, MO | 1.0–2.0 | 1.0–2.0 | 752 | $1,395 | $1.85 | 16d | 1 | 1.05mi |
| 5345 Wells Ave Unit 2ND St. Louis, MO | 3.0 | 1.0 | 1127 | $1,095 | $0.97 | 23d | 1 | 1.08mi |
| 603 Westgate Ave University City, MO | 2.0 | 2.5 | 1290 | $1,750 | $1.36 | 43d | 1 | 1.08mi |
| 5783 McPherson Ave Unit 2FL St. Louis, MO | 3.0 | 2.0 | 1320 | $2,550 | $1.93 | 7d | 1 | 1.08mi |
| 5783 McPherson Ave Unit 1FL St. Louis, MO | 2.0 | 2.0 | 1250 | $1,950 | $1.56 | 7d | 1 | 1.08mi |
| 5861 Nina Pl Unit 3W St. Louis, MO | 3.0 | 1.0 | 1550 | $1,750 | $1.13 | 17d | 1 | 1.10mi |
| 5861 Nina Pl Apt 2W St. Louis, MO | 3.0 | 1.0 | 1400 | $1,750 | $1.25 | 43d | 1 | 1.10mi |
| 5500 Delmar Blvd Unit 5540-Apt 202 St. Louis, MO | 2.0 | 2.0 | 875 | $1,395 | $1.59 | 7d | 1 | 1.12mi |
| 5920 McPherson Ave Unit 1st Floor St. Louis, MO | 3.0 | 1.0 | 1300 | $2,550 | $1.96 | 43d | 1 | 1.12mi |
| 501 Clara Ave Saint Louis, MO | 1.0–2.0 | 1.0–2.0 | 850 | $1,845 | $2.17 | 14d | 21 | 1.14mi |
| 501 Clara Ave Saint Louis, MO | 1.0–2.0 | 1.0–2.0 | 915 | $1,885 | $2.06 | 1d | 21 | 1.14mi |
| 1420 Union Blvd Unit 2F St. Louis, MO | 2.0 | 1.0 | 1096 | $995 | $0.91 | 43d | 1 | 1.15mi |
HOA detail condo
- Monthly dues
- $0 · $0/yr
- Assessments
- None detected in remarks — confirm with the listing agent.
Listing history 4 events
-
2026-05-31days on market $127,000 Active 100 DOM
-
2026-02-21$127,000 Active 122-char remark
Show marketing remark (122 chars)
Calling all Investors! Looking to begin or expand your portfolio? Look no further! Cash flow with a solid renter in place!
-
2026-02-18historical $127,000 122-char remark
Show marketing remark (122 chars)
Calling all Investors! Looking to begin or expand your portfolio? Look no further! Cash flow with a solid renter in place!
-
2008-12-29soldstatus $120,000
ⓘ Source: listings_history table (triggers on properties + properties_extension) + one-shot
backfill from property_details.listing_events for pre-trigger history.
Climate risk First Street
- Flood 1/10 Low FEMA zone X (unshaded) · 0% chance over 30 yrs
- Wildfire 1/10 Low
- Heat 5/10 Major 7 d/yr ≥107°F today · 20 d/yr by 30 yrs out
- Wind 2/10 Low 100% chance of damaging wind over 30 yrs
- Air quality 4/10 Moderate 4 unhealthy d/yr today · 5 by 30 yrs out
Nearby sold comps map
Loading sold comps map…
Walkable amenities ~0.75 mi
Loading nearby amenities…
Taxation est. · year 1
- Rental income
- $20,418
- − Mortgage interest
- −$7,114
- − Property taxes
- −$1,905
- − Insurance
- −$635
- − Repairs & maintenance
- −$1,633
- − Management
- −$1,633
- − Depreciation
- −$3,695
- Taxable income
- $3,802
- Est. tax owed @ 24.0%
- −$913
- After-tax cash flow
- $4,685/yr
For passive investors: Depreciation is non-cash, so a rental often shows a tax loss while cash-flowing — sheltering income. Rental losses are passive: they offset passive income freely, and up to $25,000/yr can offset ordinary (W-2) income if you actively participate and your MAGI is under $100k (phasing out to $0 by $150k); unused losses carry forward. On sale, claimed depreciation is recaptured at up to 25%, and gains may owe capital-gains tax (a 1031 exchange can defer both). Figures are a year-1 estimate at your 24.0% rate — not tax advice; consult a CPA.
Schools (NCES district)
- District
- St. Louis City
- NCES district ID
- 2929280
- Math proficiency
- 10% ▼ -6.00%
- Reading proficiency
- 18% ▼ -3.00%
- Median HH income
- $35,685
- Composite
- 11.54/100
- National rank
- #9699
- State rank
- #312 of 324 in MO
Livability — St. Louis
No livability data for this city. (Only ~50 U.S. cities are tracked.)
Census & demographics
- Census place
- St. Louis, MO
- County
- Saint Louis City · 254,015 people
- City population
- 283,259
- Metro
- St. Louis, MO-IL
- Population (ZIP)
- 17,985
- Household income
- $45,542
- Rent vs Own
- Severe rent burden
- 1457.0
Population outlook (St. Louis County) Hauer SSP2
- Today (2025)
- 315,737 people
- By 2030
- 313,865 · -0.6%
- By 2040
- 305,439 · -3.3%
- By 2050
- 296,529 · -6.1%
- By 2075
- 271,028 · -14.2%
- By 2100
- 255,359 · -19.1%
Race, ethnicity, and origin ACS 2023
- Neighborhood character
- Majority Black (63%)
- Race & ethnicity
- Black 63% White 24% Asian 6% Two or more races 5% Hispanic / Latino 4%
- Common ancestry
- Lithuanian 1% Scotch-Irish 1% Romanian 1%
- Foreign-born
- 9% · China, South Korea, Canada
- Languages at home
- 88% English-only · Spanish 3% Chinese 2% Korean 2%
Political lean MEDSL · St. Louis
- 2024 margin
- Solid D (+64.7) · D 81.4% · R 16.7% · Other 2.0%
- 2008→2024 swing
- -3.5pp toward R · 2008: 68.2pp · 2024: 64.7pp
- All cycles
- 2024: D+64.7 2020: D+66.2 2016: D+63.7 2012: D+66.6 2008: D+68.2
Not yet ingested
- Civics
- —
Market trends
- HPI YoY
- ▼ -158.94%
- Current HPI
- 115.1863
- Rent YoY
- ▲ 2.39%
- Metro
- St. Louis, MO-IL
- State GDP YoY
- ▲ 1.84%
- F500 in state
- 20
Industry mix (Fortune 500 HQ in MO)
| Industry | F500 HQs | Revenue |
|---|---|---|
| Healthcare | 1 | $163B |
|
||
| Insurance | 1 | $21B |
|
||
| Industrial Technology | 1 | $17B |
|
||
| Retail | 1 | $16B |
|
||
| Industrial Distribution | 1 | $10B |
|
||
| Utilities | 1 | $9B |
|
||
Price history
+5.8% since first listed3 events — show timeline
- 2026-02-21 Listed $127,000 MARIS as Distributed by MLS Grid
- 2026-02-18 Coming Soon $127,000 MARIS as Distributed by MLS Grid
- 2008-12-29 Sold (Public Records) $120,000 Public Records
Cash-flow waterfall
monthlySold comps — $/sqft
last 12 mo · ≤1 miLoading sold comps…