812 E 32nd St · Wolfforth, TX
Flood risk No data
- FEMA flood zone
- —
- Chance of flooding over 30 yrs
- —
- Est. flood insurance / yr
- —
Fire risk No data
- Est. fire insurance / yr
- —
Heat risk No data
- Hot days now (above threshold)
- —
- Hot days in 30 yrs
- —
Wind risk No data
- Chance of severe wind over 30 yrs
- —
Air-quality risk No data
- Unhealthy air days now
- —
- Unhealthy air days in 30 yrs
- —
Risk factors via First Street. Map © Google.
Why this score? — see what drove the D- grade
The composite is a weighted blend of 9 inputs, each scored 0–100. Each bar is that input's sub-score; the figure is the points it added to the 100-point composite (weight × sub-score).
- Appreciation +10.0/10.0
- ARV discount +7.5/15.0
- Cash flow +4.7/30.0
- Schools +4.4/10.0
- Livability +4.0/5.0
- 1% rule +2.7/10.0
- Rent growth +2.5/5.0
- Condition / age +2.5/5.0
- DSCR +0.0/10.0
$221,000
🖨 Deal sheet 📄 Offer letter ✓ Due diligence
Listing remarks
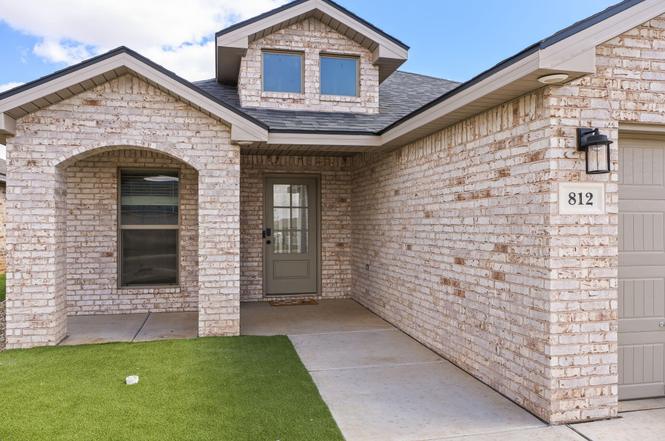
Welcome to this well-cared-for 3 bedroom, 2 bath home located in the highly desirable Frenship School District. Offering an open-concept layout with high ceilings, this home feels bright, spacious, and inviting from the moment you walk in. Luxury vinyl plank flooring runs throughout the entire home, providing both style and durability with easy maintenance in mind. The kitchen, dining, and living areas flow seamlessly together—perfect for everyday living and entertaining. The large primary bedroom offers a comfortable retreat with plenty of space to unwind. Each additional bedroom is well-sized and versatile for family, guests, or a home office. Step outside to enjoy thoughtfully desi
Key facts
- Back patio shaded
- Open-concept layout
- 5,319 sq ft lot
Tags
Property features AI
Finance
- HOA & community: Neighborhood features: park, playground, sidewalks
Exterior
- Parking: Attached garage; 2 garage spaces; Driveway; Garage door opener
- Security: Smoke detectors; Closed-circuit cameras
- Utilities: Public water; Public sewer
- Home design: Single family residence; Residential property
- Construction: Brick construction; Slab foundation; Composition roof; Built area above grade: 1,455
- Exterior features: Private yard; Covered patio and rear porch; Fenced backyard; Paved, public-maintained city street access
Interior
- Kitchen: Dishwasher; Freestanding gas range; Microwave; Kitchen island; Pantry; Granite counters
- Flooring: Vinyl
- Bathrooms: 2 full bathrooms
- Heating & cooling: Central heating (natural gas); Central air (electric); Ceiling fans
- Interior features: Ceiling fans; Granite counters; High ceilings; High-speed internet; Kitchen island; Open floorplan; Pantry; Walk-in closet(s); Blinds
- Laundry & utility: Washer hookup inside; Electric dryer hookup; Gas water heater
Neighborhood map
What this means for you Summary
Snapshot
- This is a 3-bed/2.0-bath single-family listed at $221k.
Deal economics
- At list price, monthly cash flow is $-548 ($-7k/yr) — negative.
- To cash-flow at today's rent, offer at most $152k (31.3% below list).
- To meet the 1% rule (rent ≥ 1% of price), the offer needs to be $169k (23.5% below list).
- Recommended offer: $152k (31.3% below list) — sets the bar for cash-flow.
Location & tenants
- Location reads 80/100 on livability (#43 in TX, #1,872 nationally) — a professional / high-income tenant draw. Strengths: cost of living A+, housing A+, health & safety A+; Watch: amenities F, commute F.
- Frenship ISD (urban): math 47% / reading 54% proficiency, ranked #162 of 826 in TX (top 20%) — acceptable for families but not a draw, mixed tenant base, ~2y average lease.
- Zoned schools: Upland Heights El (math 49% / reading 55%, grade C-, #742 of 4,322 statewide, top 19%, 840 students, 46% FRL); Frenship Middle (math 46% / reading 50%, grade C-, #400 of 1,662 statewide, top 24%, 833 students, 47% FRL); Frenship H S (math 44% / reading 65%, grade C-, #379 of 1,632 statewide, top 26%, 3,247 students, 46% FRL).
- Market conditions: 472 active listings in the ZIP; 19 comparable units currently listed for rent nearby; rentals lingering (median 44d on market — plan ~5-8 weeks vacancy on turnover, expect pricing pressure); 53% of comp listings sitting > 30 days — soft ceiling on asking rent; solid renter incomes; 2,219 units permitted in Lubbock County in 2024 (252 in 5+ unit buildings).
Forward outlook
- In year one you build about $24k of equity ($2k loan paydown + $22k appreciation (10.0% local appreciation)).
- Lubbock County population projected at +39% by 2050 — long-run rental-demand tailwind backs the buy-and-hold thesis.
- By year 2, paydown + projected appreciation supports a ~$38k cash-out refi (75% LTV) — recoverable capital for the next deal without selling this one.
Negotiation context
- Only 3 days on market — expect competitive offers; lowballing is unlikely to land.
Risks & watch-outs
- Watch-outs: property tax is 3.4% of price.
Questions for the listing agent
- What do current leases actually rent for vs. the listed asking? Can we see a recent rent roll and the last 12 months of T-12 income?
- Property tax is high relative to price — has the assessment been appealed recently, and will the sale trigger a re-assessment?
- Is there a deadline driving the sale (1031 exchange, divorce, estate, relocation)? That informs how much negotiation room exists.
- Schools are B-rated — typically a magnet for longer-tenancy family renters. What's the average tenant stay here, and is there a school-zone premium baked into asking?
- The area grade is low — what's the realistic commute time and amenity access for the typical tenant pool here? Any planned neighborhood developments (good or bad) we should know about?
- What's the average days-on-market for RENTAL listings here right now (not sales)? A rising rental-DOM trend means longer vacancies and softer asking-rent achievability than the comps imply.
- What's the recent tenant-quality profile in this submarket — average credit score on applications, eviction rate, late-payment / NSF rate, and stable-employment percentage? A property-management company in the area should have these aggregated.
- How much new for-sale + rental construction is in the pipeline within 1–3 miles? Heavy new supply typically softens prices + rents 12–24 months out; constrained supply supports both.
Investment metrics
- 1% rule
- 0.77% ✗
- Cap rate
- 3.32%
- Cash-on-cash
- -10.63%
- DSCR
- 0.53
- GRM
- 10.9
CMA / ARV
No comps found within radius.
Projected returns pro-forma
10.0% appreciation · 3.0% rent growth · sell at horizon
- IRR
- 16.9%
- Equity multiple
- 2.38×
- Total profit
- $85,696
- Equity at exit
- $199,094
- IRR
- 16.1%
- Equity multiple
- 5.53×
- Total profit
- $280,301
- Equity at exit
- $429,354
Cash invested: $61,880 (down + closing). Projections, not guarantees.
Landlord ↔ Tenant lean methodology
- Overall (STATE)
- 87 Strongly Landlord-Friendly
- State Texas
- 87 Strongly Landlord-Friendly · R+5
- County
- — inherits STATE
- City
- — inherits STATE
ZIP-level market 79382
- Active inventory
- 472
- Price-to-rent
- 10.9×
Monthly cashflow live
- Estimated rent
- $1,691 high interval (Pro) →
- Mortgage (P&I)
- −$1,159
- Tax from tax record
- −$633 /mo · $7,594/yr
- Insurance
- −$92
- HOA
- −$0
- Vacancy / Maint / Mgmt
- −$355
- Net cashflow
- $-548
Break-even live
UW: 25.0% down · 7.5% · 30yr · 1.5% tax · 5.0% vac · 8.0% maint · 8.0% mgmt
Financing live
Cash to close
- Down payment
- $55,250
- Closing costs
- $6,630
- Reserves months
- —
- Total cash needed
- —
Loan-product check · same deal, 3 products live
Conventional
25% down · 7.5% · 30yr
- Down + closing
- —
- Monthly P&I
- —
- Monthly cashflow
- —
- DSCR
- —
- Eligible?
- —
Personal DTI + credit; lowest rate.
DSCR
20% down · 8.5% · 30yr
- Down + closing
- —
- Monthly P&I
- —
- Monthly cashflow
- —
- DSCR
- —
- Eligible?
- —
No personal income docs; deal must DSCR.
Hard money
10% down · 12.0% · 12mo
- Down + closing
- —
- Monthly P&I
- —
- Monthly cashflow
- —
- DSCR
- —
- Eligible?
- —
Short-term bridge; refi at stabilization.
Rent comps 19 comps
| Address | Beds | Baths | Sqft | Rent | $/sqft | DOM | Units | Dist |
|---|---|---|---|---|---|---|---|---|
| 2916 Corpus Ave Wolfforth, TX | 3.0 | 2.0 | 1657 | $1,800 | $1.09 | 44d | 1 | 0.19mi |
| 407 E 21st St Wolfforth, TX | 3.0 | 2.0 | 1360 | $1,399 | $1.03 | 21d | 1 | 0.68mi |
| 2011 Bryan Ave Wolfforth, TX | 3.0 | 2.0 | 1350 | $1,450 | $1.07 | 44d | 1 | 0.70mi |
| 2006 Corpus Ave Unit A Wolfforth, TX | 3.0 | 2.0 | 1223 | $1,425 | $1.17 | 14d | 1 | 0.71mi |
| 2408 Aberdeen Ave Wolfforth, TX | 4.0 | 2.0 | 1703 | $2,100 | $1.23 | 21d | 1 | 0.71mi |
| 2418 Aberdeen Ave Wolfforth, TX | 3.0 | 2.0 | 1450 | $1,799 | $1.24 | 44d | 1 | 0.71mi |
| 2008 Bryan Ave Unit Harvest-2008 A Bryan Wolfforth, TX | 3.0 | 2.0 | 1223 | $1,400 | $1.14 | 44d | 1 | 0.71mi |
| 2001 Corpus Ave Unit 2001 B Corpus Wolfforth, TX | 3.0 | 2.0 | 1350 | $1,500 | $1.11 | 21d | 1 | 0.74mi |
| 2001 Corpus Ave Unit B Wolfforth, TX | 3.0 | 2.0 | 1316 | $1,500 | $1.14 | 14d | 1 | 0.74mi |
| 2001 Bryan Ave Unit B Wolfforth, TX | 3.0 | 2.0 | 1360 | $1,400 | $1.03 | 44d | 1 | 0.76mi |
| 2008 Cottonwood Ave Wolfforth, TX | 3.0 | 2.0 | 1450 | $1,810 | $1.25 | 44d | 1 | 0.76mi |
| 2304 Corpus Ave Wolfforth, TX | 3.0 | 2.0 | 1316 | $1,425 | $1.08 | 44d | 1 | 0.76mi |
| 1817 Corpus Ave Wolfforth, TX | 3.0 | 2.0 | 1405 | $1,600 | $1.14 | 14d | 1 | 0.77mi |
| 1712 Corpus Ave Wolfforth, TX | 2.0 | 2.0 | 1335 | $1,375 | $1.03 | 44d | 1 | 0.89mi |
| 304 E 19th St Wolfforth, TX | 3.0 | 2.0 | 1114 | $1,150 | $1.03 | 13d | 1 | 0.89mi |
| 723 E 17th St Wolfforth, TX | 3.0 | 2.0 | 1670 | $1,800 | $1.08 | 44d | 1 | 0.89mi |
| 1313 Corpus Ave Unit B Wolfforth, TX | 3.0 | 2.0 | 1550 | $1,850 | $1.19 | 14d | 1 | 1.12mi |
| 215 14th St Wolfforth, TX | 4.0 | 3.0 | 1850 | $2,200 | $1.19 | 13d | 1 | 1.19mi |
| 611 E 14th St Wolfforth, TX | 3.0 | 2.0 | 1299 | $1,725 | $1.33 | 44d | 1 | 1.23mi |
Listing history 4 events
-
2026-06-18days on market $221,000 Active 3 DOM
-
2026-06-17days on market $221,000 Active 2 DOM
-
2026-06-15remarks 693-char remark
-
2026-06-15$221,000 Active 1 DOM
ⓘ Source: listings_history table (triggers on properties + properties_extension) + one-shot
backfill from property_details.listing_events for pre-trigger history.
Tax reassessment forecast TX · Resets to sale price
- Current annual tax
- $7,594 · $633/mo
- Projected year-2 tax
- $7,594 · $633/mo
- Expected delta
- $0/yr ($0/mo · -0.0%)
ⓘ Screening estimate from a state-policy table — verify with the county assessor before closing.
Nearby sold comps map
Loading sold comps map…
Walkable amenities ~0.75 mi
Loading nearby amenities…
Taxation est. · year 1
- Rental income
- $20,289
- − Mortgage interest
- −$12,379
- − Property taxes
- −$7,594
- − Insurance
- −$1,105
- − Repairs & maintenance
- −$1,623
- − Management
- −$1,623
- − Depreciation
- −$6,429
- Taxable loss
- −$10,464
- Est. tax savings @ 24.0%
- +$2,511
- After-tax cash flow
- $-4,066/yr
For passive investors: Depreciation is non-cash, so a rental often shows a tax loss while cash-flowing — sheltering income. Rental losses are passive: they offset passive income freely, and up to $25,000/yr can offset ordinary (W-2) income if you actively participate and your MAGI is under $100k (phasing out to $0 by $150k); unused losses carry forward. On sale, claimed depreciation is recaptured at up to 25%, and gains may owe capital-gains tax (a 1031 exchange can defer both). Figures are a year-1 estimate at your 24.0% rate — not tax advice; consult a CPA.
Schools (NCES district)
- District
- Frenship ISD
- NCES district ID
- 4819830
- Math proficiency
- 47% ▼ -8.00%
- Reading proficiency
- 54% ▬ 0.00%
- Median HH income
- $54,376
- Composite
- 43.59/100
- National rank
- #2976
- State rank
- #162 of 826 in TX
Livability — Wolfforth
- Score
- 80/100
- State rank
- #43
- US rank
- #1872
Category grades
Schools grade is shown separately in the Schools card above.
Census & demographics
- Census place
- Wolfforth, TX
- County
- Lubbock County · 293,542 people
- City population
- 10,512
- Metro
- Lubbock, TX
- Population (ZIP)
- 10,512
- Household income
- $84,457
- Rent vs Own
- Severe rent burden
- 135.0
Population outlook (Lubbock County) Hauer SSP2
- Today (2025)
- 345,960 people
- By 2030
- 371,449 · +7.4%
- By 2040
- 424,539 · +22.7%
- By 2050
- 481,150 · +39.1%
- By 2075
- 633,467 · +83.1%
- By 2100
- 746,853 · +115.9%
Race, ethnicity, and origin ACS 2023
- Neighborhood character
- Majority White (64%)
- Race & ethnicity
- White 64% Hispanic / Latino 31% Two or more races 18% Black 1%
- Hispanic origin (detail)
- Mexican 28%
- Common ancestry
- Italian 4% Slovak 2% Lithuanian 2%
- Foreign-born
- 4% · Canada
- Languages at home
- 85% English-only · Spanish 14%
Political lean MEDSL · Lubbock
- 2024 margin
- Solid R (+39.5) · D 29.7% · R 69.2% · Other 1.0%
- 2008→2024 swing
- -2.8pp toward R · 2008: -36.7pp · 2024: -39.5pp
- All cycles
- 2024: R+39.5 2020: R+32.2 2016: R+38.4 2012: R+40.9 2008: R+36.7
Not yet ingested
- Civics
- —
Market trends
- HPI YoY
- ▲ 166.08%
- Current HPI
- 561.4491
- Rent YoY
- —
- Metro
- Lubbock, TX
- State GDP YoY
- ▲ 3.95%
- F500 in state
- 110
Industry mix (Fortune 500 HQ in TX)
| Industry | F500 HQs | Revenue |
|---|---|---|
| Energy | 16 | $1,198B |
|
||
| Technology | 5 | $198B |
|
||
| Engineering / Construction | 4 | $72B |
|
||
| Energy Services | 3 | $60B |
|
||
| Utilities | 3 | $41B |
|
||
| Healthcare | 2 | $330B |
|
||
Price history
1 event — show timeline
- 2026-06-15 Listed $221,000 LARMLS
Property tax history
+699.6%/yrLatest (2025): $7,594 · +699.6% YoY. Source: county tax records.
Cash-flow waterfall
monthlySold comps — $/sqft
last 12 mo · ≤1 miLoading sold comps…