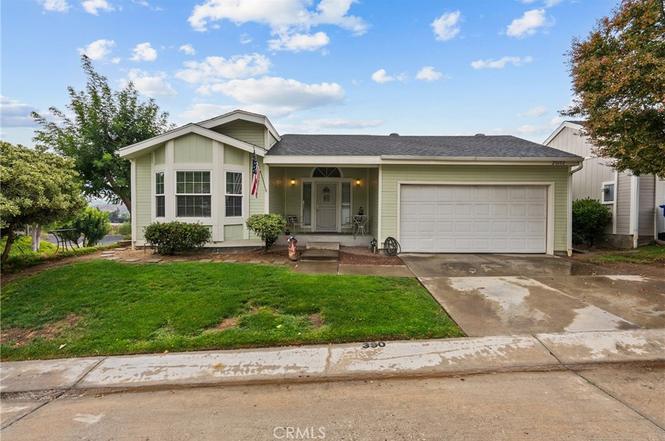
20172 Shadow Island Dr · Santa Clarita, CA
Flood risk 1/10 · Minimal
- FEMA flood zone
- X (unshaded)
- Chance of flooding over 30 yrs
- 0.0%
- Est. flood insurance / yr
- $507 – $1,088
Fire risk 8/10 · Major
- Est. fire insurance / yr
- $659 – $1,223
Heat risk 7/10 · Major
- Hot days now (above 99°F)
- 7 days/yr
- Hot days in 30 yrs
- 19 days/yr
Wind risk 1/10 · Minimal
- Chance of severe wind over 30 yrs
- —
Air-quality risk 6/10 · Moderate
- Unhealthy air days now
- 9 days/yr
- Unhealthy air days in 30 yrs
- 13 days/yr
Risk factors via First Street. Map © Google.
Why this score? — see what drove the C- grade
The composite is a weighted blend of 9 inputs, each scored 0–100. Each bar is that input's sub-score; the figure is the points it added to the 100-point composite (weight × sub-score).
- Cash flow +24.6/30.0
- DSCR +7.9/10.0
- 1% rule +6.4/10.0
- Schools +5.9/10.0
- Livability +3.5/5.0
- Rent growth +2.9/5.0
- Condition / age +2.5/5.0
- ARV discount +0.0/15.0
- Appreciation +0.0/10.0
$275,000
🖨 Deal sheet (PDF) 📄 Offer letter ✓ Due diligence
Listing remarks
WELCOME HOME! Private corner lot with fantastic view. Recently painted exterior and interior. Newer roof. Upgraded plank laminate and carpet flooring throughout/recessed lighting/ceiling fans in both bedrooms and living room. Remodeled Kitchen, large center island with granite, ample cabinet space and newer appliances. Primary bedroom with slider to outside patio. Both bathrooms have been upgraded with granite counters and newer vanities - primary bath with deep soaking tub and separate shower. Living room with cozy fireplace and additional slider to the back yard. Open flowing floorplan. Separate indoor laundry room. Direct access to 2 car garage. Nice size backyard with a view of the va
Key facts
- 4,399 sq ft lot
- 2 garage spots
- Community pool
Property features AI
Finance
- Other: Seller provided lot and living area information
- Financial info: Land lease amount: $1,778
- HOA & community: Land lease community (land lease amount listed)
Exterior
- Parking: Attached garage with 2 spaces; 2 total parking spaces
- Utilities: Public sewer; District / public water
- Home design: Manufactured house; Planned development; Single-story; No accessory dwelling unit
- Construction: Certified 433a foundation
- Exterior features: Corner lot; Association pool; Has a view; Street lighting in the community
Interior
- Bedrooms: 2 main-level bedrooms
- Bathrooms: 2 full bathrooms (main level)
- Heating & cooling: Central cooling
- Interior features: One-level home; Entry at main level; All bedrooms on the ground floor; Living room fireplace
- Laundry & utility: Laundry inside the home
Neighborhood map
What this means for you Summary
Snapshot
- This is a 2-bed/2.0-bath manufactured listed at $275k.
Deal economics
- At list price, monthly cash flow is $569 ($7k/yr) — positive.
- The deal already cash-flows at list — no discount required.
- Meets the 1% rule at list price ($3k rent vs $275k).
- Recommended offer: $242k (12.0% below list) — sets the bar for market timing.
- Cap rate 8.8% vs local median 2.8% in Santa Clarita — top-decile yield for the area; either an underpriced asset or a hidden risk that comps aren't pricing in. Stress-test before assuming the spread holds.
Location & tenants
- Location reads 70/100 on livability (#229 in CA) — a middle-class / working-renter tenant base. Strengths: employment A+, housing A, crime A-; Watch: amenities D+, cost of living F, health & safety F.
- William S. Hart Union High (suburban): math 52% / reading 72% proficiency, ranked #155 of 1,400 in CA (top 11%) — acceptable for families but not a draw, mixed tenant base, ~2y average lease; only 18% free/reduced lunch — higher-income household profile.
- Market conditions: Rents rising (+1.7%/yr); 109 active listings in the ZIP; 21 comparable units currently listed for rent nearby; rentals leasing fast (median 2d on market — plan ~1-2 weeks tenant-placement turnaround); high-income renter base; 19,697 units permitted in Los Angeles County in 2024 (9,426 in 5+ unit buildings).
- This rent runs 33% of the median local income ($115k/yr) — at the standard rent-burdened threshold; future hikes will face affordability resistance.
Forward outlook
- Local home prices are declining (-3.0%/yr); year-one equity from $2k of loan paydown is wiped out by about $8k of value loss. Plan a longer hold.
- Los Angeles County population projected at +9% by 2050 — modest demand growth; plan on rents tracking national, not racing it.
Negotiation context
- It's been on market 276 days — a 12% lower offer ($242k) is reasonable based on typical stale-listing flexibility.
- 2 sale attempts; this cycle's ask has dropped $40k (13%) from the opening price — seller is motivated, your offer sets the floor, not the list.
Risks & watch-outs
- Climate carrying-cost: severe wildfire risk; extreme-heat days projected 7→19/yr by 2055 (HVAC capex compounding) — expect insurance premiums to compound above CPI over the hold.
Questions for the listing agent
- It's been on market 276 days. Have you received any prior offers? Is the seller open to a 12% concession, seller financing, or rate buy-down credit?
- Why hasn't it sold? Are there any deal-killer items the seller is aware of (foundation, flood, title, zoning, code violations)?
- Is there a deadline driving the sale (1031 exchange, divorce, estate, relocation)? That informs how much negotiation room exists.
- Schools are B-rated — typically a magnet for longer-tenancy family renters. What's the average tenant stay here, and is there a school-zone premium baked into asking?
- What's the average days-on-market for RENTAL listings here right now (not sales)? A rising rental-DOM trend means longer vacancies and softer asking-rent achievability than the comps imply.
- What's the recent tenant-quality profile in this submarket — average credit score on applications, eviction rate, late-payment / NSF rate, and stable-employment percentage? A property-management company in the area should have these aggregated.
- How much new for-sale + rental construction is in the pipeline within 1–3 miles? Heavy new supply typically softens prices + rents 12–24 months out; constrained supply supports both.
Investment metrics
- 1% rule
- 1.14% ✓
- Cap rate
- 8.77%
- Cash-on-cash
- 8.86%
- DSCR
- 1.39
- GRM
- 7.3
CMA / ARV
- ARV (on-the-fly)
- $212,000
- Comps found
- 12
Show comp detail 12 sales within ~0.75 mi
| Address | Dist | Beds/Ba | Sqft | Sold | Price | $/sf | Match |
|---|---|---|---|---|---|---|---|
| 20401 Soledad Canyon Rd #247 | 0.38mi | 2/2.0 | 1,248 (-6%) | 8mo | $155,000 | $124 | 66 |
| 20073 Edgewater Dr | 0.12mi | 3/2.0 (+1) | 1,482 (+12%) | 5mo | $322,000 | $217 | 65 |
| 20042 Canyon View Dr #74 | 0.18mi | 3/2.0 (+1) | 1,482 (+12%) | 4mo | $275,000 | $186 | 64 |
| 20401 Soledad Canyon Rd #342 | 0.49mi | 3/2.0 (+1) | 1,344 (+1%) | 8mo | $210,000 | $156 | 64 |
| 20401 Soledad Cyn #355 | 0.49mi | 3/2.0 (+1) | 1,248 (-6%) | 1mo | $224,000 | $179 | 62 |
| 20401 Soledad Cyn | 0.42mi | 3/2.0 (+1) | 1,440 (+9%) | 4mo | $230,000 | $160 | 58 |
| 20401 Soledad Canyon Rd #690 | 0.49mi | 3/2.0 (+1) | 1,344 (+1%) | 16mo | $240,400 | $179 | 57 |
| 20401 Soledad Canyon Rd Spc 543 | 0.49mi | 3/2.0 (+1) | 1,440 (+9%) | 4mo | $230,000 | $160 | 54 |
| 20401 Soledad Canyon Rd #126 | 0.49mi | 3/2.0 (+1) | 1,224 (-8%) | 8mo | $130,000 | $106 | 53 |
| 20401 Soledad Canyon Rd #114 | 0.49mi | 3/2.0 (+1) | 1,176 (-11%) | 4mo | $184,000 | $156 | 51 |
| 20401 Soledad Canyon Rd #451 | 0.49mi | 3/2.0 (+1) | 1,176 (-11%) | 7mo | $157,000 | $134 | 48 |
| 20401 Soledad Canyon Rd #203 | 0.49mi | 3/2.0 (+1) | 1,404 (+6%) | 19mo | $235,000 | $167 | 47 |
Match score weights: distance 35% · size 25% · config 20% · recency 20%. Top-matched comps best support the ARV.
Projected returns pro-forma
-3.0% appreciation · 1.7% rent growth · sell at horizon
- IRR
- -4.3%
- Equity multiple
- 0.84×
- Total profit
- $-12,333
- Equity at exit
- $41,003
- IRR
- 3.8%
- Equity multiple
- 1.26×
- Total profit
- $19,955
- Equity at exit
- $23,777
Cash invested: $77,000 (down + closing). Projections, not guarantees.
Landlord ↔ Tenant lean methodology
- Overall (STATE)
- 18 Strongly Tenant-Friendly
- State California
- 18 Strongly Tenant-Friendly · D+13
- County
- — inherits STATE
- City
- — inherits STATE
ZIP-level market 91351
- Rents YoY
- 1.7%
- Active inventory
- 109
- Price-to-rent
- 7.3×
Monthly cashflow live
- Estimated rent
- $3,125 high interval (Pro) →
- Mortgage (P&I)
- −$1,442
- Tax est. 1.5%
- −$344 /mo · $4,125/yr
- Insurance
- −$115
- HOA
- −$0
- Vacancy / Maint / Mgmt
- −$656
- Net cashflow
- $569
Break-even live
Sensitivity live
| Price | -10% $759 | -5% $664 | +0% $569 | +5% $474 | +10% $379 |
|---|---|---|---|---|---|
| Rent | -10% $322 | -5% $445 | +0% $569 | +5% $692 | +10% $816 |
| Rate | -1.0pp $707 | -0.5pp $639 | base $569 | +0.5pp $497 | +1.0pp $425 |
UW: 25.0% down · 7.5% · 30yr · 1.5% tax · 5.0% vac · 8.0% maint · 8.0% mgmt
Financing live
Cash to close
- Down payment
- $68,750
- Closing costs
- $8,250
- Reserves months
- —
- Total cash needed
- —
Loan-product check · same deal, 3 products live
Conventional
25% down · 7.5% · 30yr
- Down + closing
- —
- Monthly P&I
- —
- Monthly cashflow
- —
- DSCR
- —
- Eligible?
- —
Personal DTI + credit; lowest rate.
DSCR
20% down · 8.5% · 30yr
- Down + closing
- —
- Monthly P&I
- —
- Monthly cashflow
- —
- DSCR
- —
- Eligible?
- —
No personal income docs; deal must DSCR.
Hard money
10% down · 12.0% · 12mo
- Down + closing
- —
- Monthly P&I
- —
- Monthly cashflow
- —
- DSCR
- —
- Eligible?
- —
Short-term bridge; refi at stabilization.
Rent comps 21 comps
| Address | Beds | Baths | Sqft | Rent | $/sqft | DOM | Units | Dist |
|---|---|---|---|---|---|---|---|---|
| 26956 Flo Ln #338 Canyon Country, CA | 2.0 | 2.0 | 1064 | $2,875 | $2.70 | 2d | 1 | 0.59mi |
| 26955 Rainbow Glen Dr Santa Clarita, CA | 3.0 | 2.0 | 1007 | $2,850 | $2.83 | 2d | 1 | 0.63mi |
| 26941 Rainbow Glen Dr #751 Canyon Country, CA | 2.0 | 2.0 | 907 | $2,900 | $3.20 | 2d | 1 | 0.64mi |
| 26921 Flo Ln Canyon Country, CA | 3.0 | 2.0 | 1107 | $2,950 | $2.66 | 2d | 1 | 0.66mi |
| 26901 Rainbow Glen Dr Santa Clarita, CA | 3.0 | 2.0 | 1001 | $2,950 | $2.95 | 2d | 1 | 0.70mi |
| 26842 Claudette St #204 Canyon Country, CA | 2.0 | 2.0 | 964 | $2,650 | $2.75 | 2d | 1 | 0.71mi |
| 20345 Rue Crevier Santa Clarita, CA | 2.0 | 2.0 | 907 | $2,700 | $2.98 | 2d | 1 | 0.72mi |
| 28131 Florence Ln Canyon Country, CA | 3.0 | 2.0 | 1515 | $4,300 | $2.84 | 2d | 1 | 0.77mi |
| 26741 Isabella Pkwy Canyon Country, CA | 1.0–2.0 | 1.0–2.0 | 850 | $2,989 | $3.52 | 2d | 3 | 0.82mi |
| 26844 Albion Way Unit 1 Santa Clarita, CA | 3.0 | 2.5 | 1817 | $3,995 | $2.20 | 13d | 1 | 0.98mi |
| 27301 Whites Canyon Rd Canyon Country, CA | 2.0 | 2.0 | 900 | $1,995 | $2.22 | 18d | 2 | 1.11mi |
| 20000 Plum Canyon Rd Santa Clarita, CA | 1.0–3.0 | 1.0–3.0 | 1051 | $2,925 | $2.78 | 25d | 2 | 1.16mi |
| 20000 Plum Canyon Rd Santa Clarita, CA | 3.0 | 3.0 | 1370 | $3,700 | $2.70 | 2d | 1 | 1.17mi |
| 19028 Drycliff St Unit C Canyon Country, CA | 3.0 | 1.5 | 982 | $3,600 | $3.67 | 3d | 1 | 1.19mi |
| 28427 Santa Rosa Ln Santa Clarita, CA | 2.0 | 2.0 | 1121 | $3,000 | $2.68 | 2d | 1 | 1.22mi |
| 19335 Laroda Ln Santa Clarita, CA | 2.0 | 2.0 | 1400 | $3,000 | $2.14 | 8d | 1 | 1.24mi |
| 28371 Mirabelle Ln Santa Clarita, CA | 3.0 | 2.5 | 1710 | $3,400 | $1.99 | 7d | 1 | 1.24mi |
| 28366 Casselman Ln Santa Clarita, CA | 3.0 | 2.5 | 1710 | $3,650 | $2.13 | 2d | 1 | 1.28mi |
| 19341 Opal Ln Santa Clarita, CA | 3.0 | 3.0 | 1850 | $3,850 | $2.08 | 19d | 1 | 1.33mi |
| 28136 Bakerton Ave Canyon Country, CA | 3.0 | 2.0 | 1400 | $3,800 | $2.71 | 8d | 1 | 1.35mi |
| 27077 Hidaway Ave Canyon Country, CA | 2.0 | 1.0 | 960 | $2,400 | $2.50 | 2d | 1 | 1.46mi |
Listing history 23 events
-
2026-06-21days on market $275,000 Active 276 DOM
-
2026-06-18days on market $275,000 Active 273 DOM
-
2026-06-17days on market $275,000 Active 272 DOM
-
2026-06-16days on market $275,000 Active 271 DOM
-
2026-06-15days on market $275,000 Active 270 DOM
-
2026-06-13days on market $275,000 Active 268 DOM
-
2026-06-13days on market $275,000 Active 267 DOM
-
2026-06-09days on market $275,000 Active 264 DOM
-
2026-06-08days on market $275,000 Active 263 DOM
-
2026-06-07pricedays on market $275,000 Active 262 DOM
-
2026-06-04days on market $280,000 Active 259 DOM
-
2026-06-03days on market $280,000 Active 258 DOM
-
2026-06-02days on market $280,000 Active 257 DOM
-
2026-06-01days on market $280,000 Active 256 DOM
-
2026-05-31days on market $280,000 Active 255 DOM
-
2026-05-01price $280,000
-
2026-03-27price $285,000
-
2026-02-28price $295,000
-
2026-02-14price $300,000
-
2025-12-06status Active
-
2025-12-06price $309,000
-
2025-09-17$315,000 Active
-
2025-09-03historical $315,000
ⓘ Source: listings_history table (triggers on properties + properties_extension) + one-shot
backfill from property_details.listing_events for pre-trigger history.
Climate risk First Street
- Flood 1/10 Low FEMA zone X (unshaded) · 0% chance over 30 yrs
- Wildfire 8/10 Severe
- Heat 7/10 Severe 7 d/yr ≥99°F today · 19 d/yr by 30 yrs out
- Wind 1/10 Low
- Air quality 6/10 Major 9 unhealthy d/yr today · 13 by 30 yrs out
Nearby sold comps map
Loading sold comps map…
Walkable amenities ~0.75 mi
Loading nearby amenities…
Taxation est. · year 1
- Rental income
- $37,506
- − Mortgage interest
- −$15,404
- − Property taxes
- −$4,125
- − Insurance
- −$1,375
- − Repairs & maintenance
- −$3,000
- − Management
- −$3,000
- − Depreciation
- −$8,000
- Taxable income
- $2,600
- Est. tax owed @ 24.0%
- −$624
- After-tax cash flow
- $6,200/yr
For passive investors: Depreciation is non-cash, so a rental often shows a tax loss while cash-flowing — sheltering income. Rental losses are passive: they offset passive income freely, and up to $25,000/yr can offset ordinary (W-2) income if you actively participate and your MAGI is under $100k (phasing out to $0 by $150k); unused losses carry forward. On sale, claimed depreciation is recaptured at up to 25%, and gains may owe capital-gains tax (a 1031 exchange can defer both). Figures are a year-1 estimate at your 24.0% rate — not tax advice; consult a CPA.
Schools (NCES district)
- District
- William S. Hart Union High
- NCES district ID
- 0642510
- Math proficiency
- 52% ▬ 0.00%
- Reading proficiency
- 72% ▲ 1.00%
- Median HH income
- $95,844
- Composite
- 58.6/100
- National rank
- #2030
- State rank
- #155 of 1400 in CA
Livability — Santa Clarita
- Score
- 70/100
- State rank
- #229
- US rank
- #7378
Category grades
Schools grade is shown separately in the Schools card above.
Census & demographics
- Census place
- Santa Clarita, CA
- County
- Los Angeles County · 9,444,647 people
- City population
- 219,066
- Metro
- Los Angeles-Long Beach-Anaheim, CA
- Population (ZIP)
- 33,155
- Household income
- $115,364
- Rent vs Own
- Severe rent burden
- 784.0
Population outlook (Los Angeles County) Hauer SSP2
- Today (2025)
- 10,940,515 people
- By 2030
- 11,256,481 · +2.9%
- By 2040
- 11,729,929 · +7.2%
- By 2050
- 11,948,407 · +9.2%
- By 2075
- 11,818,114 · +8.0%
- By 2100
- 10,842,928 · -0.9%
Race, ethnicity, and origin ACS 2023
- Neighborhood character
- Diverse neighborhood (Simpson 0.64)
- Race & ethnicity
- Hispanic / Latino 49% White 34% Two or more races 21% Asian 6% Black 4% Native American 1%
- Hispanic origin (detail)
- Mexican 36%
- Common ancestry
- Romanian 1% Lithuanian 1% Scotch-Irish 1%
- Foreign-born
- 23% · Canada, Jamaica, South Korea
- Languages at home
- 54% English-only · Spanish 35% Other Indo-European 3% Tagalog/Filipino 2%
Political lean MEDSL · Los Angeles
- 2024 margin
- Solid D (+32.9) · D 64.8% · R 31.9% · Other 3.3%
- 2008→2024 swing
- -7.4pp toward R · 2008: 40.4pp · 2024: 32.9pp
- All cycles
- 2024: D+32.9 2020: D+44.2 2016: D+48.0 2012: D+40.0 2008: D+40.4
Not yet ingested
- Civics
- —
Market trends
- HPI YoY
- ▼ -703.16%
- Current HPI
- 360.9901
- Rent YoY
- ▲ 1.70%
- Metro
- Los Angeles-Long Beach-Anaheim, CA
- State GDP YoY
- ▲ 3.21%
- F500 in state
- 116
Industry mix (Fortune 500 HQ in CA)
| Industry | F500 HQs | Revenue |
|---|---|---|
| Technology | 27 | $1,492B |
|
||
| Financial Services | 3 | $174B |
|
||
| Retail | 3 | $44B |
|
||
| Insurance | 3 | $26B |
|
||
| Media / Entertainment | 2 | $115B |
|
||
| Pharmaceuticals / Biotech | 2 | $62B |
|
||
Price history
-11.1% since first listed8 events — show timeline
- 2026-05-01 Price Changed $280,000 CRMLS
- 2026-03-27 Price Changed $285,000 CRMLS
- 2026-02-28 Price Changed $295,000 CRMLS
- 2026-02-14 Price Changed $300,000 CRMLS
- 2025-12-06 Relisted — CRMLS
- 2025-12-06 Price Changed $309,000 CRMLS
- 2025-09-17 Listed $315,000 CRMLS
- 2025-09-03 Coming Soon $315,000 CRMLS
Cash-flow waterfall
monthlySold comps — $/sqft
last 12 mo · ≤1 miLoading sold comps…