 🏗️ New Construction
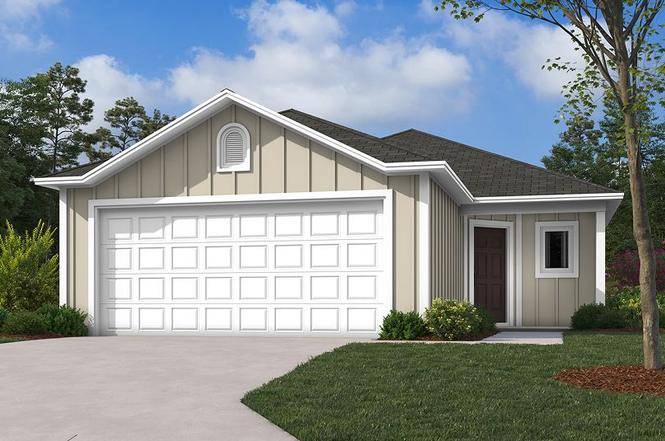
RC Ridgeland Plan · San Antonio, TX
Flood risk 1/10 · Minimal
- FEMA flood zone
- X (unshaded)
- Chance of flooding over 30 yrs
- 0.0%
- Est. flood insurance / yr
- $507 – $1,088
Fire risk 6/10 · Moderate
- Est. fire insurance / yr
- $1,222 – $2,270
Heat risk 8/10 · Major
- Hot days now (above 109°F)
- 7 days/yr
- Hot days in 30 yrs
- 22 days/yr
Wind risk 8/10 · Major
- Chance of severe wind over 30 yrs
- 80.0%
Air-quality risk 1/10 · Minimal
- Unhealthy air days now
- 0 days/yr
- Unhealthy air days in 30 yrs
- 0 days/yr
Risk factors via First Street. Map © Google.
Why this score? — see what drove the D grade
The composite is a weighted blend of 9 inputs, each scored 0–100. Each bar is that input's sub-score; the figure is the points it added to the 100-point composite (weight × sub-score).
- Cash flow +10.3/30.0
- ARV discount +7.5/15.0
- Appreciation +7.0/10.0
- Livability +4.0/5.0
- Schools +3.4/10.0
- 1% rule +3.1/10.0
- DSCR +3.0/10.0
- Rent growth +2.5/5.0
- Condition / age +2.5/5.0
$230,900
🖨 Deal sheet 📄 Offer letter ✓ Due diligence
Key facts
- Intimate dining area
- Single-level home
- Easy patio access
Tags
Property features AI
Finance
- Financial info: List price $230,900
Exterior
- Parking: 2 total parking spaces; 2-car garage
- Home design: Plan: RC Ridgeland; New construction plan
Interior
- Bedrooms: 4 bedrooms
- Bathrooms: 2 full bathrooms
- Interior features: Living area approximately 1,459
Neighborhood map
What this means for you Summary
Snapshot
- This is a 4-bed/2.0-bath single-family listed at $231k.
Deal economics
- At list price, monthly cash flow is $-121 ($-1k/yr) — negative.
- To cash-flow at today's rent, offer at most $206k (10.9% below list).
- To meet the 1% rule (rent ≥ 1% of price), the offer needs to be $180k (22.0% below list).
- Recommended offer: $180k (22.0% below list) — sets the bar for 1% rule.
- Cap rate 5.6% vs local median 3.8% in San Antonio — top-decile yield for the area; either an underpriced asset or a hidden risk that comps aren't pricing in. Stress-test before assuming the spread holds.
Location & tenants
- Location reads 80/100 on livability (#31 in TX, #1,616 nationally) — a professional / high-income tenant draw. Strengths: amenities A+, commute A+, cost of living A+; Watch: schools C-, crime F.
- Somerset ISD (rural): math 41% / reading 39% proficiency, ranked #417 of 826 in TX (top 50%) — families likely to look elsewhere, expect single-tenant / working-renter base with shorter leases; 72% free/reduced lunch — lower-income household profile, screen leases tightly.
- Market conditions: 329 active listings in the ZIP; 1 comparable units currently listed for rent nearby; 8,308 units permitted in Bexar County in 2024 (2,506 in 5+ unit buildings).
Forward outlook
- In year one you build about $10k of equity ($2k loan paydown + $9k appreciation (3.9% local appreciation)).
- Bexar County population projected at +50% by 2050 — long-run rental-demand tailwind backs the buy-and-hold thesis.
- By year 4, paydown + projected appreciation supports a ~$35k cash-out refi (75% LTV) — recoverable capital for the next deal without selling this one.
Negotiation context
- It's been on market 421 days — a 12% lower offer ($203k) is reasonable based on typical stale-listing flexibility.
Risks & watch-outs
- Climate carrying-cost: severe wind risk, 80% chance of damaging wind over 30y; major wildfire risk; extreme-heat days projected 7→22/yr by 2055 (HVAC capex compounding) — expect insurance premiums to compound above CPI over the hold.
Questions for the listing agent
- What do current leases actually rent for vs. the listed asking? Can we see a recent rent roll and the last 12 months of T-12 income?
- It's been on market 421 days. Have you received any prior offers? Is the seller open to a 22% concession, seller financing, or rate buy-down credit?
- Why hasn't it sold? Are there any deal-killer items the seller is aware of (foundation, flood, title, zoning, code violations)?
- Is there a deadline driving the sale (1031 exchange, divorce, estate, relocation)? That informs how much negotiation room exists.
- Crime grade is F in this area — have there been break-ins, vandalism, or insurance claims at this property in the last 3 years? What carrier currently insures it and at what premium?
- The area grade is low — what's the realistic commute time and amenity access for the typical tenant pool here? Any planned neighborhood developments (good or bad) we should know about?
- What's the average days-on-market for RENTAL listings here right now (not sales)? A rising rental-DOM trend means longer vacancies and softer asking-rent achievability than the comps imply.
- What's the recent tenant-quality profile in this submarket — average credit score on applications, eviction rate, late-payment / NSF rate, and stable-employment percentage? A property-management company in the area should have these aggregated.
- How much new for-sale + rental construction is in the pipeline within 1–3 miles? Heavy new supply typically softens prices + rents 12–24 months out; constrained supply supports both.
Investment metrics
- 1% rule
- 0.81% ✗
- Cap rate
- 5.64%
- Cash-on-cash
- -2.32%
- DSCR
- 0.90
- GRM
- 10.3
CMA / ARV
- ARV (on-the-fly)
- $223,227
- Comps found
- 12
Show comp detail 12 sales within ~0.75 mi
| Address | Dist | Beds/Ba | Sqft | Sold | Price | $/sf | Match |
|---|---|---|---|---|---|---|---|
| 19012 Encanto Aly | 0.09mi | 3/2.0 (-1) | 1,402 (-4%) | 1mo | $171,999 | $123 | 84 |
| 19004 Encanto Aly | 0.10mi | 4/2.0 | 1,575 (+8%) | 1mo | $201,999 | $128 | 81 |
| 3715 Garcia Grv | 0.14mi | 3/2.0 (-1) | 1,402 (-4%) | 2mo | $193,999 | $138 | 80 |
| 3723 Garcia Grv | 0.15mi | 3/2.0 (-1) | 1,411 (-3%) | 3mo | $215,999 | $153 | 80 |
| 19004 Arco Aly | 0.22mi | 3/2.0 (-1) | 1,459 (0%) | 13mo | $237,610 | $163 | 74 |
| 3727 Garcia Grv | 0.16mi | 3/2.0 (-1) | 1,600 (+10%) | 2mo | $208,999 | $131 | 70 |
| 4007 Garcia Grv | 0.27mi | 3/2.0 (-1) | 1,459 (0%) | 16mo | $219,900 | $151 | 69 |
| 19008 Arco Aly | 0.22mi | 3/2.0 (-1) | 1,402 (-4%) | 13mo | $204,310 | $146 | 68 |
| 4015 Garcia Grv | 0.28mi | 3/2.0 (-1) | 1,402 (-4%) | 14mo | $219,900 | $157 | 64 |
| 19007 Arco Aly | 0.25mi | 3/2.0 (-1) | 1,248 (-14%) | 11mo | $195,610 | $157 | 50 |
| 3923 Garcia Grv | 0.25mi | 3/2.0 (-1) | 1,248 (-14%) | 13mo | $206,845 | $166 | 49 |
| 4011 Garcia Grv | 0.27mi | 3/2.0 (-1) | 1,248 (-14%) | 15mo | $207,900 | $167 | 46 |
Match score weights: distance 35% · size 25% · config 20% · recency 20%. Top-matched comps best support the ARV.
Projected returns pro-forma
3.94% appreciation · 3.0% rent growth · sell at horizon
- IRR
- 8.1%
- Equity multiple
- 1.49×
- Total profit
- $30,598
- Equity at exit
- $112,464
- IRR
- 10.3%
- Equity multiple
- 2.70×
- Total profit
- $106,276
- Equity at exit
- $183,375
Cash invested: $62,504 (down + closing). Projections, not guarantees.
Landlord ↔ Tenant lean methodology
- Overall (STATE)
- 87 Strongly Landlord-Friendly
- State Texas
- 87 Strongly Landlord-Friendly · R+5
- County
- — inherits STATE
- City
- — inherits STATE
ZIP-level market 78264
- Home prices YoY
- 1.3%
- Active inventory
- 329
- Price-to-rent
- 10.7×
Monthly cashflow live
- Estimated rent
- $1,800 medium interval (Pro) →
- Mortgage (P&I)
- −$1,171
- Tax est. 1.5%
- −$279 /mo · $3,348/yr
- Insurance
- −$93
- HOA
- −$0
- Vacancy / Maint / Mgmt
- −$378
- Net cashflow
- $-121
Break-even live
UW: 25.0% down · 7.5% · 30yr · 1.5% tax · 5.0% vac · 8.0% maint · 8.0% mgmt
Financing live
Cash to close
- Down payment
- $55,807
- Closing costs
- $6,697
- Reserves months
- —
- Total cash needed
- —
Loan-product check · same deal, 3 products live
Conventional
25% down · 7.5% · 30yr
- Down + closing
- —
- Monthly P&I
- —
- Monthly cashflow
- —
- DSCR
- —
- Eligible?
- —
Personal DTI + credit; lowest rate.
DSCR
20% down · 8.5% · 30yr
- Down + closing
- —
- Monthly P&I
- —
- Monthly cashflow
- —
- DSCR
- —
- Eligible?
- —
No personal income docs; deal must DSCR.
Hard money
10% down · 12.0% · 12mo
- Down + closing
- —
- Monthly P&I
- —
- Monthly cashflow
- —
- DSCR
- —
- Eligible?
- —
Short-term bridge; refi at stabilization.
Rent comps 1 comps
| Address | Beds | Baths | Sqft | Rent | $/sqft | DOM | Units | Dist |
|---|---|---|---|---|---|---|---|---|
| 4206 April Breeze Unit 103 Von Ormy, TX | 3.0 | 2.5 | 1832 | $1,800 | $0.98 | 20d | 1 | 0.78mi |
Listing history 15 events
-
2026-06-18days on market $230,900 Active 421 DOM
-
2026-06-17days on market $230,900 Active 420 DOM
-
2026-06-16days on market $230,900 Active 419 DOM
-
2026-06-15days on market $230,900 Active 418 DOM
-
2026-06-15days on market $230,900 Active 417 DOM
-
2026-06-13days on market $230,900 Active 416 DOM
-
2026-06-12days on market $230,900 Active 415 DOM
-
2026-06-09days on market $230,900 Active 412 DOM
-
2026-06-08days on market $230,900 Active 411 DOM
-
2026-06-08days on market $230,900 Active 410 DOM
-
2026-06-07days on market $230,900 Active 409 DOM
-
2026-06-03days on market $230,900 Active 406 DOM
-
2026-06-02days on market $230,900 Active 405 DOM
-
2026-06-01days on market $230,900 Active 404 DOM
-
2026-05-31days on market $230,900 Active 403 DOM
ⓘ Source: listings_history table (triggers on properties + properties_extension) + one-shot
backfill from property_details.listing_events for pre-trigger history.
Climate risk First Street
- Flood 1/10 Low FEMA zone X (unshaded) · 0% chance over 30 yrs
- Wildfire 6/10 Major
- Heat 8/10 Severe 7 d/yr ≥109°F today · 22 d/yr by 30 yrs out
- Wind 8/10 Severe 80% chance of damaging wind over 30 yrs
- Air quality 1/10 Low 0 unhealthy d/yr today · 0 by 30 yrs out
Nearby sold comps map
Loading sold comps map…
Walkable amenities ~0.75 mi
Loading nearby amenities…
Taxation est. · year 1
- Rental income
- $21,600
- − Mortgage interest
- −$12,504
- − Property taxes
- −$3,348
- − Insurance
- −$1,116
- − Repairs & maintenance
- −$1,728
- − Management
- −$1,728
- − Depreciation
- −$6,494
- Taxable loss
- −$5,319
- Est. tax savings @ 24.0%
- +$1,276
- After-tax cash flow
- $-172/yr
For passive investors: Depreciation is non-cash, so a rental often shows a tax loss while cash-flowing — sheltering income. Rental losses are passive: they offset passive income freely, and up to $25,000/yr can offset ordinary (W-2) income if you actively participate and your MAGI is under $100k (phasing out to $0 by $150k); unused losses carry forward. On sale, claimed depreciation is recaptured at up to 25%, and gains may owe capital-gains tax (a 1031 exchange can defer both). Figures are a year-1 estimate at your 24.0% rate — not tax advice; consult a CPA.
Schools (NCES district)
- District
- Somerset ISD
- NCES district ID
- 4840740
- Math proficiency
- 41% ▬ 0.00%
- Reading proficiency
- 39% ▲ 4.00%
- Median HH income
- $44,712
- Composite
- 34.01/100
- National rank
- #5315
- State rank
- #417 of 826 in TX
Livability — San Antonio
- Score
- 80/100
- State rank
- #31
- US rank
- #1616
Category grades
Schools grade is shown separately in the Schools card above.
Census & demographics
- City population
- 1,806,925
- Population (ZIP)
- 11,702
Population outlook (Bexar County) Hauer SSP2
- Today (2025)
- 2,336,851 people
- By 2030
- 2,560,728 · +9.6%
- By 2040
- 3,020,569 · +29.3%
- By 2050
- 3,493,522 · +49.5%
- By 2075
- 4,668,459 · +99.8%
- By 2100
- 5,533,242 · +136.8%
Race, ethnicity, and origin ACS 2023
- Neighborhood character
- Predominantly Hispanic (80%)
- Race & ethnicity
- Hispanic / Latino 80% Two or more races 35% White 17% Black 2% Native American 1%
- Hispanic origin (detail)
- Mexican 73%
- Common ancestry
- Lithuanian 1% Serbian 1% Greek 1%
- Foreign-born
- 14% · Canada
- Languages at home
- 48% English-only · Spanish 51% Tagalog/Filipino 0%
Political lean MEDSL · Bexar
- 2024 margin
- Lean D (+9.8) · D 54.3% · R 44.6% · Other 1.1%
- 2008→2024 swing
- +4.2pp toward D · 2008: 5.6pp · 2024: 9.8pp
- All cycles
- 2024: D+9.8 2020: D+18.2 2016: D+13.5 2012: D+4.6 2008: D+5.6
Not yet ingested
- Civics
- —
Market trends
- HPI YoY
- ▲ 3.94%
- Current HPI
- 298.8446
- Rent YoY
- —
- Metro
- —
- State GDP YoY
- ▲ 3.95%
- F500 in state
- 110
Industry mix (Fortune 500 HQ in TX)
| Industry | F500 HQs | Revenue |
|---|---|---|
| Energy | 16 | $1,198B |
|
||
| Technology | 5 | $198B |
|
||
| Engineering / Construction | 4 | $72B |
|
||
| Energy Services | 3 | $60B |
|
||
| Utilities | 3 | $41B |
|
||
| Healthcare | 2 | $330B |
|
||
Cash-flow waterfall
monthlySold comps — $/sqft
last 12 mo · ≤1 miLoading sold comps…