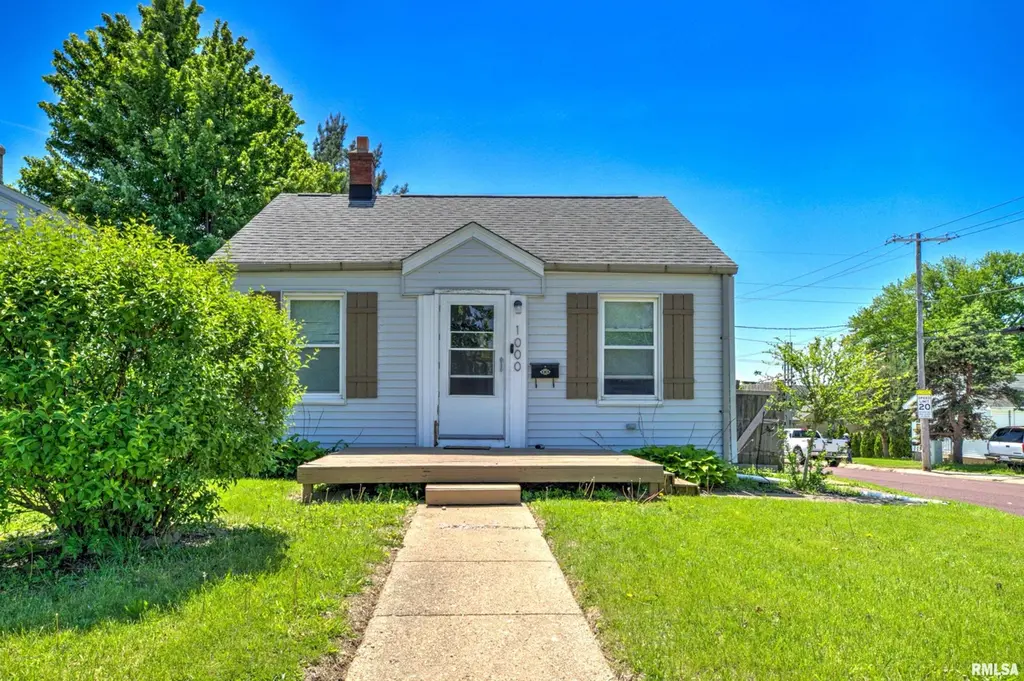
1000 E Sciota Ave · Peoria Heights, IL
Flood risk 1/10 · Minimal
- FEMA flood zone
- X
- Chance of flooding over 30 yrs
- 0.0%
- Est. flood insurance / yr
- $473 – $860
Fire risk 1/10 · Minimal
- Est. fire insurance / yr
- $804 – $1,492
Heat risk 3/10 · Minor
- Hot days now (above 104°F)
- 7 days/yr
- Hot days in 30 yrs
- 18 days/yr
Wind risk 2/10 · Minimal
- Chance of severe wind over 30 yrs
- 1.0%
Air-quality risk 3/10 · Minor
- Unhealthy air days now
- 1 days/yr
- Unhealthy air days in 30 yrs
- 3 days/yr
Risk factors via First Street. Map © Google.
Why this score? — see what drove the C- grade
The composite is a weighted blend of 9 inputs, each scored 0–100. Each bar is that input's sub-score; the figure is the points it added to the 100-point composite (weight × sub-score).
- Cash flow +27.2/30.0
- DSCR +9.5/10.0
- 1% rule +8.2/10.0
- Livability +3.1/5.0
- Rent growth +2.5/5.0
- Condition / age +2.5/5.0
- Schools +1.0/10.0
- ARV discount +0.0/15.0
- Appreciation +0.0/10.0
$95,000
🖨 Deal sheet (PDF) 📄 Offer letter ✓ Due diligence
Listing remarks MLS
Cute, cozy and lovingly cared for home that the current owners have owned for 33 years* So many quality updates throughout* Roof 8-9 years old, deck redone 2015, Hot water heater 2020, central air 2020, furnace 8-9 years old, and so much more* Natural hardwood floors in the living room and two bedrooms* Bamboo kitchen flooring done in 2017 and newer flooring in the informal dining area * Newer updated bathroom* Cute workshop area in the basement* Nice sunroom that overlooks the good sized deck for enjoying beautiful Summer nights and encompassed by a good sized fenced backyard* Be a part of all the wonderful things that Peoria Heights has to offer* Walking distance to schools, restaurants, shops and entertainment*
Key facts
- New flooring
- Renovated kitchen
- New cabinets
Tags
Property features AI
Exterior
- Parking: On-street parking
- Utilities: Public water; Public sewer
- Home design: Single family residence; Built in 1938; Partial basement
- Construction: Shingle roof
- Exterior features: Corner, level lot; Fenced yard; Shed(s); Paved road access
Interior
- Kitchen: Refrigerator
- Bedrooms: 2 bedrooms (main level and upper level)
- Flooring: Hardwood (bedrooms, living room); Laminate (dining room); Tile (kitchen); Carpet (sunroom)
- Bathrooms: 1 full bathroom
- Heating & cooling: Central air; Forced air heating; Gas water heater
- Interior features: Cable available; Ceiling fan(s)
Neighborhood map
What this means for you Summary
Snapshot
- This is a 2-bed/1.0-bath single-family listed at $95k.
Deal economics
- At list price, monthly cash flow is $273 ($3k/yr) — positive.
- The deal already cash-flows at list — no discount required.
- Meets the 1% rule at list price ($1k rent vs $95k).
- Recommended offer: $94k (1.5% below list) — sets the bar for market timing.
Location & tenants
- Location reads 62/100 on livability (#886 in IL) — a middle-class / working-renter tenant base. Strengths: cost of living A+, housing A-, health & safety B+; Watch: crime F, amenities F, commute F.
- Peoria Heights CUSD 325 (suburban): math 8% / reading 15% proficiency, ranked #560 of 620 in IL (top 90%) — low school quality limits family demand, transient renter base, plan for 1-2y turnover.
- Zoned schools: Peoria Heights Grade School (math 7% / reading 14%, grade F, #1,473 of 2,056 statewide, top 72%, 546 students, 0% FRL); Peoria Heights High School (math 15% / reading 24%, grade F, #379 of 693 statewide, top 57%, 208 students, 0% FRL) — zoned schools average 0% FRL vs 50% district-wide (50 pts lower); this property's tenant base skews higher-income than the district average.
- Market conditions: 32 active listings in the ZIP; 6 comparable units currently listed for rent nearby; rentals at typical pace (median 15d on market — plan ~3-4 weeks tenant-placement turnaround); 73 units permitted in Peoria County in 2024 (0 in 5+ unit buildings).
Forward outlook
- Local home prices are declining (-3.0%/yr); year-one equity from $657 of loan paydown is wiped out by about $3k of value loss. Plan a longer hold.
- Peoria County population projected at -11% by 2050 — secular population decline; favor cash flow + early exit over multi-decade hold.
- At projected returns (-3.0% appreciation + 3.0% rent growth), your $27k cash investment doubles in ~10 years — after that, you're playing with house money.
Negotiation context
- It's been on market 25 days — a 2% lower offer ($94k) is reasonable based on typical stale-listing flexibility.
- 2 sale attempts since 4y ago; this cycle's ask is 31% above the opening price — seller raised mid-cycle; expect resistance to lowballs.
- Current owner paid $63k; list at $95k implies a 51% gain — meaningful room to come down on a strong offer.
Risks & watch-outs
- Watch-outs: built in 1938 — expect roof / HVAC / electrical / plumbing capex.
Questions for the listing agent
- Built in 1938 — when were the roof, HVAC, electrical panel, plumbing, and water heater last replaced?
- Is there a deadline driving the sale (1031 exchange, divorce, estate, relocation)? That informs how much negotiation room exists.
- Schools are F-rated, which usually means shorter tenancies and higher turnover. Who's the typical renter profile here, and what's been the actual vacancy rate?
- Crime grade is F in this area — have there been break-ins, vandalism, or insurance claims at this property in the last 3 years? What carrier currently insures it and at what premium?
- What's the average days-on-market for RENTAL listings here right now (not sales)? A rising rental-DOM trend means longer vacancies and softer asking-rent achievability than the comps imply.
- What's the recent tenant-quality profile in this submarket — average credit score on applications, eviction rate, late-payment / NSF rate, and stable-employment percentage? A property-management company in the area should have these aggregated.
- How much new for-sale + rental construction is in the pipeline within 1–3 miles? Heavy new supply typically softens prices + rents 12–24 months out; constrained supply supports both.
Investment metrics
- 1% rule
- 1.32% ✓
- Cap rate
- 9.74%
- Cash-on-cash
- 12.30%
- DSCR
- 1.55
- GRM
- 6.3
CMA / ARV
- ARV (median comp)
- $77,106
- List price
- $95,000
- Delta
- 23.21%
- Verdict
- OVERPRICED
- Comps
- 20 within 1.0 mi
Show comp detail 12 sales within ~0.75 mi
| Address | Dist | Beds/Ba | Sqft | Sold | Price | $/sf | Match |
|---|---|---|---|---|---|---|---|
| 911 E Moneta Ave | 0.10mi | 2/1.0 | 720 (+11%) | 0mo | $95,000 | $132 | 76 |
| 1408 E Moneta Ave | 0.41mi | 2/1.0 | 624 (-4%) | 5mo | $115,000 | $184 | 70 |
| 4100 N Illinois Dr | 0.23mi | 2/1.0 | 736 (+14%) | 5mo | $77,000 | $105 | 63 |
| 5002 Glen Elm Dr | 0.65mi | 2/1.0 | 676 (+4%) | 1mo | $133,000 | $197 | 62 |
| 3824 N Dayton Ave | 0.60mi | 2/1.0 | 672 (+4%) | 6mo | $65,000 | $97 | 61 |
| 3824 N Ashton Ave | 0.51mi | 2/1.0 | 676 (+4%) | 10mo | $90,000 | $133 | 61 |
| 5008 N Best St | 0.67mi | 2/1.0 | 676 (+4%) | 2mo | $124,900 | $185 | 60 |
| 213 E Lake Ave | 0.65mi | 2/1.0 | 676 (+4%) | 4mo | $63,000 | $93 | 59 |
| 5014 N Best St | 0.69mi | 2/1.0 | 676 (+4%) | 6mo | $87,500 | $129 | 56 |
| 3915 N Dayton Ave | 0.53mi | 2/1.0 | 581 (-10%) | 8mo | $60,000 | $103 | 51 |
| 515 E Marietta Ave | 0.43mi | 2/2.0 | 736 (+14%) | 2mo | $104,900 | $143 | 51 |
| 1411 E Crestwood Dr | 0.45mi | 1/1.0 (-1) | 558 (-14%) | 6mo | $34,000 | $61 | 46 |
Match score weights: distance 35% · size 25% · config 20% · recency 20%. Top-matched comps best support the ARV.
Projected returns pro-forma
-3.0% appreciation · 3.0% rent growth · sell at horizon
- IRR
- 2.0%
- Equity multiple
- 1.08×
- Total profit
- $2,023
- Equity at exit
- $14,165
- IRR
- 11.6%
- Equity multiple
- 1.92×
- Total profit
- $24,341
- Equity at exit
- $8,214
Cash invested: $26,600 (down + closing). Projections, not guarantees.
Landlord ↔ Tenant lean methodology
- Overall (STATE)
- 43 Moderately Tenant-Leaning
- State Illinois
- 43 Moderately Tenant-Leaning · D+7
- County
- — inherits STATE
- City
- — inherits STATE
ZIP-level market 61616
- Home prices YoY
- -31.0%
- Active inventory
- 32
- Price-to-rent
- 6.3×
Monthly cashflow live
- Estimated rent
- $1,250 high interval (Pro) →
- Mortgage (P&I)
- −$498
- Tax from tax record
- −$177 /mo · $2,126/yr
- Insurance
- −$40
- HOA
- −$0
- Vacancy / Maint / Mgmt
- −$263
- Net cashflow
- $273
Break-even live
Sensitivity live
| Price | -10% $326 | -5% $299 | +0% $273 | +5% $246 | +10% $219 |
|---|---|---|---|---|---|
| Rent | -10% $174 | -5% $223 | +0% $273 | +5% $322 | +10% $371 |
| Rate | -1.0pp $320 | -0.5pp $297 | base $273 | +0.5pp $248 | +1.0pp $223 |
UW: 25.0% down · 7.5% · 30yr · 1.5% tax · 5.0% vac · 8.0% maint · 8.0% mgmt
Financing live
Cash to close
- Down payment
- $23,750
- Closing costs
- $2,850
- Reserves months
- —
- Total cash needed
- —
Loan-product check · same deal, 3 products live
Conventional
25% down · 7.5% · 30yr
- Down + closing
- —
- Monthly P&I
- —
- Monthly cashflow
- —
- DSCR
- —
- Eligible?
- —
Personal DTI + credit; lowest rate.
DSCR
20% down · 8.5% · 30yr
- Down + closing
- —
- Monthly P&I
- —
- Monthly cashflow
- —
- DSCR
- —
- Eligible?
- —
No personal income docs; deal must DSCR.
Hard money
10% down · 12.0% · 12mo
- Down + closing
- —
- Monthly P&I
- —
- Monthly cashflow
- —
- DSCR
- —
- Eligible?
- —
Short-term bridge; refi at stabilization.
Rent comps 6 comps
| Address | Beds | Baths | Sqft | Rent | $/sqft | DOM | Units | Dist |
|---|---|---|---|---|---|---|---|---|
| 811 E Lake Ave Peoria Heights, IL | 2.0 | 1.0 | 576 | $875 | $1.52 | 15d | 1 | 0.11mi |
| 4914 N Best St Peoria Heights, IL | 2.0 | 1.0 | 720 | $1,200 | $1.67 | 45d | 1 | 0.60mi |
| 249 E Oak Cliff Ct Unit 4 Peoria, IL | 2.0 | 1.0 | 600 | $800 | $1.33 | 15d | 1 | 0.62mi |
| 4809 Knoxville Ave Unit 4819 4B, 5A, & 5B Peoria, IL | 3.0 | 2.0 | 700 | $1,800 | $2.57 | 15d | 1 | 0.88mi |
| 4809 Knoxville Ave Apt 2C Peoria, IL | 1.0 | 1.0 | 700 | $850 | $1.21 | 23d | 1 | 0.88mi |
| W Crestwood Dr Peoria, IL | 1.0–2.0 | 1.0 | 800 | $975 | $1.22 | 15d | 4 | 1.39mi |
Listing history 7 events
-
2026-06-01status $95,000 Pending 25 DOM
-
2026-05-31days on market $95,000 Active 25 DOM
-
2026-05-30days on market $95,000 Active 24 DOM
-
2026-05-04$105,000 Active 581-char remark
-
2022-06-24soldstatus $63,000 Closed 723-char remark
Show marketing remark (723 chars)
Cute, cozy and lovingly cared for home that the current owners have owned for 33 years* So many quality updates throughout* Roof 8-9 years old, deck redone 2015, Hot water heater 2020, central air 2020, furnace 8-9 years old, and so much more* Natural hardwood floors in the living room and two bedrooms* Bamboo kitchen flooring done in 2017 and newer flooring in the informal dining area * Newer updated bathroom* Cute workshop area in the basement* Nice sunroom that overlooks the good sized deck for enjoying beautiful Summer nights and encompassed by a good sized fenced backyard* Be a part of all the wonderful things that Peoria Heights has to offer* Walking distance to schools, restaurants, shops and entertainment*
-
2022-05-20status Pending 723-char remark
Show marketing remark (723 chars)
Cute, cozy and lovingly cared for home that the current owners have owned for 33 years* So many quality updates throughout* Roof 8-9 years old, deck redone 2015, Hot water heater 2020, central air 2020, furnace 8-9 years old, and so much more* Natural hardwood floors in the living room and two bedrooms* Bamboo kitchen flooring done in 2017 and newer flooring in the informal dining area * Newer updated bathroom* Cute workshop area in the basement* Nice sunroom that overlooks the good sized deck for enjoying beautiful Summer nights and encompassed by a good sized fenced backyard* Be a part of all the wonderful things that Peoria Heights has to offer* Walking distance to schools, restaurants, shops and entertainment*
-
2022-05-12$72,500 Active 723-char remark
Show marketing remark (723 chars)
Cute, cozy and lovingly cared for home that the current owners have owned for 33 years* So many quality updates throughout* Roof 8-9 years old, deck redone 2015, Hot water heater 2020, central air 2020, furnace 8-9 years old, and so much more* Natural hardwood floors in the living room and two bedrooms* Bamboo kitchen flooring done in 2017 and newer flooring in the informal dining area * Newer updated bathroom* Cute workshop area in the basement* Nice sunroom that overlooks the good sized deck for enjoying beautiful Summer nights and encompassed by a good sized fenced backyard* Be a part of all the wonderful things that Peoria Heights has to offer* Walking distance to schools, restaurants, shops and entertainment*
ⓘ Source: listings_history table (triggers on properties + properties_extension) + one-shot
backfill from property_details.listing_events for pre-trigger history.
Tax reassessment forecast IL · Partial reset (capped growth)
- Current annual tax
- $2,126 · $177/mo
- Projected year-2 tax
- $2,141 · $178/mo
- Expected delta
- +$15/yr (+$1/mo · 0.7%)
ⓘ Screening estimate from a state-policy table — verify with the county assessor before closing.
Climate risk First Street
- Flood 1/10 Low FEMA zone X · 0% chance over 30 yrs
- Wildfire 1/10 Low
- Heat 3/10 Moderate 7 d/yr ≥104°F today · 18 d/yr by 30 yrs out
- Wind 2/10 Low 100% chance of damaging wind over 30 yrs
- Air quality 3/10 Moderate 1 unhealthy d/yr today · 3 by 30 yrs out
Nearby sold comps map
Loading sold comps map…
Walkable amenities ~0.75 mi
Loading nearby amenities…
Taxation est. · year 1
- Rental income
- $15,000
- − Mortgage interest
- −$5,321
- − Property taxes
- −$2,126
- − Insurance
- −$475
- − Repairs & maintenance
- −$1,200
- − Management
- −$1,200
- − Depreciation
- −$2,764
- Taxable income
- $1,914
- Est. tax owed @ 24.0%
- −$459
- After-tax cash flow
- $2,812/yr
For passive investors: Depreciation is non-cash, so a rental often shows a tax loss while cash-flowing — sheltering income. Rental losses are passive: they offset passive income freely, and up to $25,000/yr can offset ordinary (W-2) income if you actively participate and your MAGI is under $100k (phasing out to $0 by $150k); unused losses carry forward. On sale, claimed depreciation is recaptured at up to 25%, and gains may owe capital-gains tax (a 1031 exchange can defer both). Figures are a year-1 estimate at your 24.0% rate — not tax advice; consult a CPA.
Schools (NCES district)
- District
- Peoria Heights CUSD 325
- NCES district ID
- 1731270
- Math proficiency
- 8% ▼ -3.00%
- Reading proficiency
- 15% ▼ -6.00%
- Median HH income
- $44,878
- Composite
- 10.35/100
- National rank
- #9788
- State rank
- #560 of 620 in IL
Livability — Peoria Heights
- Score
- 62/100
- State rank
- #886
- US rank
- #17272
Category grades
Schools grade is shown separately in the Schools card above.
Census & demographics
- Census place
- Peoria Heights, IL
- County
- Peoria County · 120,495 people
- City population
- 5,825
- Metro
- Peoria, IL
- Population (ZIP)
- 5,825
- Household income
- $60,099
- Rent vs Own
- Severe rent burden
- 82.0
Population outlook (Peoria County) Hauer SSP2
- Today (2025)
- 183,007 people
- By 2030
- 179,643 · -1.8%
- By 2040
- 171,782 · -6.1%
- By 2050
- 163,508 · -10.7%
- By 2075
- 140,178 · -23.4%
- By 2100
- 114,493 · -37.4%
Race, ethnicity, and origin ACS 2023
- Neighborhood character
- Predominantly White (87%)
- Race & ethnicity
- White 87% Black 4% Two or more races 4% Hispanic / Latino 3% Asian 3%
- Common ancestry
- Iranian 5% Italian 2% Slovak 2%
- Foreign-born
- 5% · Canada, South Korea
- Languages at home
- 93% English-only · Chinese 2% Spanish 2% Other Indo-European 2%
Political lean MEDSL · Peoria
- 2024 margin
- Toss-up / Even · D 51.5% · R 46.9% · Other 1.6%
- 2008→2024 swing
- -9.2pp toward R · 2008: 13.9pp · 2024: 4.7pp
- All cycles
- 2024: D+4.7 2020: D+6.3 2016: D+2.8 2012: D+4.4 2008: D+13.9
Not yet ingested
- Civics
- —
Market trends
- HPI YoY
- ▼ -78.59%
- Current HPI
- 175.1102
- Rent YoY
- —
- Metro
- Peoria, IL
- State GDP YoY
- ▲ 1.59%
- F500 in state
- 60
Industry mix (Fortune 500 HQ in IL)
| Industry | F500 HQs | Revenue |
|---|---|---|
| Insurance | 4 | $201B |
|
||
| Consumer Goods | 4 | $87B |
|
||
| Industrial Machinery | 3 | $64B |
|
||
| Healthcare | 2 | $55B |
|
||
| Retail / Pharmacy | 1 | $148B |
|
||
| Agriculture / Food | 1 | $86B |
|
||
Price history
-13.1% since first listed7 events — show timeline
- 2026-05-31 Pending — RMLSA as Distributed by MLS Grid
- 2026-05-31 Listing Removed — RMLSA as Distributed by MLS Grid
- 2026-05-19 Price Changed — RMLSA as Distributed by MLS Grid
- 2026-05-04 Listed — RMLSA as Distributed by MLS Grid
- 2022-06-24 Sold (MLS) $63,000 RMLSA as Distributed by MLS Grid
- 2022-05-20 Pending — RMLSA as Distributed by MLS Grid
- 2022-05-12 Listed $72,500 RMLSA as Distributed by MLS Grid
Property tax history
+5.2%/yrLatest (2025): $2,126 · +4.6% YoY. Source: county tax records.
Cash-flow waterfall
monthlySold comps — $/sqft
last 12 mo · ≤1 miLoading sold comps…