 Fourplex
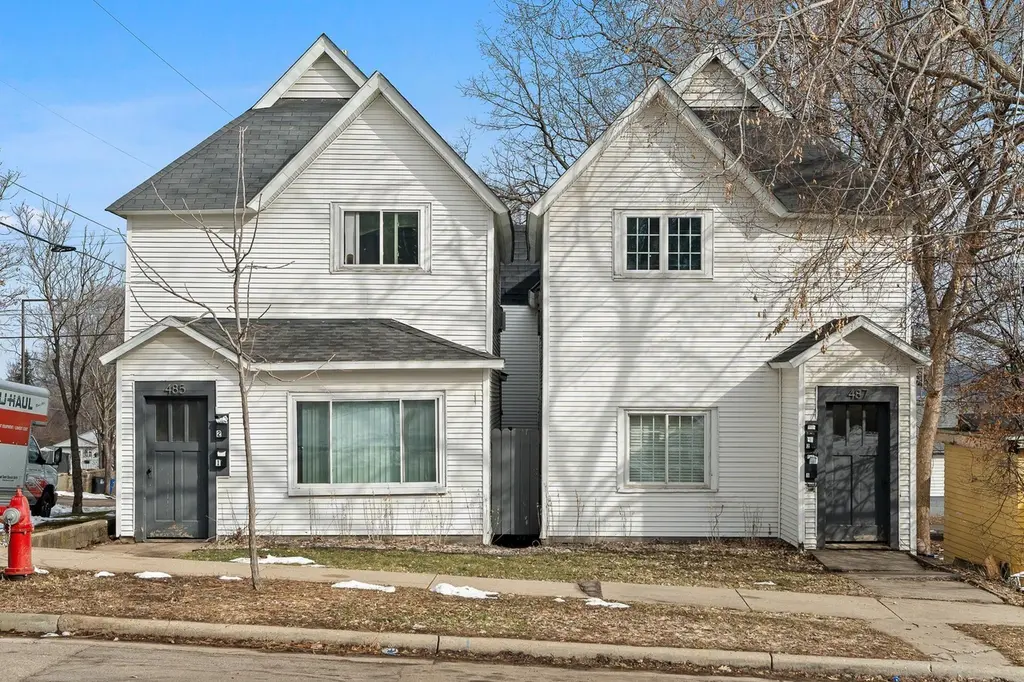
485 Belvidere St E · St. Paul, MN
Flood risk 1/10 · Minimal
- FEMA flood zone
- X (unshaded)
- Chance of flooding over 30 yrs
- 0.0%
- Est. flood insurance / yr
- $507 – $1,088
Fire risk 1/10 · Minimal
- Est. fire insurance / yr
- $888 – $1,650
Heat risk 2/10 · Minimal
- Hot days now (above 100°F)
- 7 days/yr
- Hot days in 30 yrs
- 14 days/yr
Wind risk 2/10 · Minimal
- Chance of severe wind over 30 yrs
- —
Air-quality risk 2/10 · Minimal
- Unhealthy air days now
- 1 days/yr
- Unhealthy air days in 30 yrs
- 1 days/yr
Risk factors via First Street. Map © Google.
Why this score? — see what drove the C+ grade
The composite is a weighted blend of 9 inputs, each scored 0–100. Each bar is that input's sub-score; the figure is the points it added to the 100-point composite (weight × sub-score).
- Cash flow +29.6/30.0
- DSCR +10.0/10.0
- 1% rule +7.3/10.0
- Rent growth +5.0/5.0
- ARV discount +3.3/15.0
- Livability +2.5/5.0
- Condition / age +2.5/5.0
- Schools +2.4/10.0
- Appreciation +0.0/10.0
$425,000
🖨 Deal sheet 📄 Offer letter ✓ Due diligence
Multi-family units
County records classify this as Multi-Family (5+ Unit). Listing-text estimate: 4 units. estimate disagrees with records
5+ unit building — per-unit beds/baths from public records are typically unavailable; the breakdown below (if shown) is an estimate from the listing text.
Listing remarks MLS
4-plex on St. Paul's West Side. Potential owner-occupant opportunity with one unit becoming vacant at the end of June. Located in a tucked-away residential block with easy access to downtown, West Side Flats, and District del Sol. Near parks, restaurants, and transit. Two 2BR/1BA and two 1BR/1BA units, 2,950 SF total. All four tenants on signed leases (mid-2026 through mid-2027) with rents raised during the most recent lease-up cycle. Current rents still sit below market ceiling, leaving room on renewals. Tenants pay gas and electric; landlord covers water/sewer and trash. Enrolled in St. Paul's 4d Affordable Housing Incentive Program, featuring up to 80% reduction in property tax class rates. The covenant transfers with the property, with estimated annual savings of $4,600+ over standard rates. Two units turned over in mid-2025 and were re-leased at meaningfully higher rents. The recent turnover cycle is complete; all four units are performing well with no deferred maintenance carried over. Priced under $500k with a low tax basis, strong occupancy, and cash flow in place. This is a rare combination to find in St. Paul's current market.
Key facts
- Close to parks
- Strong renter demand
- Fully leased 4-plex
Tags
Neighborhood map
What this means for you Summary
Snapshot
- This is a 4 × 2.0-bed/1.0-bath units multifamily listed at $425k.
Deal economics
- At list price, monthly cash flow is $2k ($18k/yr) — positive. Per door: $385/mo.
- The deal already cash-flows at list — no discount required.
- Meets the 1% rule at list price ($5k rent vs $425k).
- Recommended offer: $400k (6.0% below list) — sets the bar for market timing.
Location & tenants
- Location reads: area grade C — affects rentability + tenant quality, not the cash-flow math above.
- St. Paul Public School District (urban): math 21% / reading 33% proficiency, ranked #270 of 301 in MN (top 90%) — low school quality limits family demand, transient renter base, plan for 1-2y turnover; 64% free/reduced lunch — lower-income household profile, screen leases tightly.
- Market conditions: Rents rising fast (+10.8%/yr); 64 active listings in the ZIP; 1,202 units permitted in Ramsey County in 2024 (880 in 5+ unit buildings).
- At $5,232/mo this rent would consume 84% of the median local household income ($75k/yr) (locally 639% of renters already pay >50% of income on rent) — very limited rent-growth headroom before tenants either downsize or default.
Forward outlook
- Local home prices are declining (-3.0%/yr); year-one equity from $3k of loan paydown is wiped out by about $13k of value loss. Plan a longer hold.
- Ramsey County population projected at +27% by 2050 — long-run rental-demand tailwind backs the buy-and-hold thesis.
- At projected returns (-3.0% appreciation + 8.0% rent growth), your $119k cash investment doubles in ~6 years — after that, you're playing with house money.
Negotiation context
- It's been on market 84 days — a 6% lower offer ($400k) is reasonable based on typical stale-listing flexibility.
- 8 sale attempts since 10y ago; this cycle's ask has dropped $50k (11%) from the opening price — seller is motivated, your offer sets the floor, not the list.
Risks & watch-outs
- Watch-outs: built in 1893 — expect roof / HVAC / electrical / plumbing capex.
Questions for the listing agent
- It's been on market 84 days. Have you received any prior offers? Is the seller open to a 6% concession, seller financing, or rate buy-down credit?
- Can we see the unit-by-unit rent roll, current vacancy, and any below-market leases? What's the average tenancy length?
- What capital expenditures (roof, boiler, parking lot, exteriors) have been made in the last 5 years, and what's planned in the next 2?
- Built in 1893 — when were the roof, HVAC, electrical panel, plumbing, and water heater last replaced?
- Why hasn't it sold? Are there any deal-killer items the seller is aware of (foundation, flood, title, zoning, code violations)?
- Is there a deadline driving the sale (1031 exchange, divorce, estate, relocation)? That informs how much negotiation room exists.
- What's the average days-on-market for RENTAL listings here right now (not sales)? A rising rental-DOM trend means longer vacancies and softer asking-rent achievability than the comps imply.
- What's the recent tenant-quality profile in this submarket — average credit score on applications, eviction rate, late-payment / NSF rate, and stable-employment percentage? A property-management company in the area should have these aggregated.
- How much new apartment / multifamily construction is in the pipeline within 1–3 miles? Heavy new supply (>2% of stock underway) typically softens rents 12–24 months out; light construction supports rent growth.
Investment metrics
- 1% rule
- 1.23% ✓
- Cap rate
- 10.64%
- Cash-on-cash
- 15.53%
- DSCR
- 1.69
- GRM
- 6.8
CMA / ARV
- ARV (median comp)
- $388,382
- List price
- $425,000
- Delta
- 9.43%
- Verdict
- FAIR
- Comps
- 1 within 2.0 mi
Projected returns pro-forma
-3.0% appreciation · 8.0% rent growth · sell at horizon
- IRR
- 11.4%
- Equity multiple
- 1.48×
- Total profit
- $56,740
- Equity at exit
- $63,369
- IRR
- 23.9%
- Equity multiple
- 3.53×
- Total profit
- $301,024
- Equity at exit
- $36,746
Cash invested: $119,000 (down + closing). Projections, not guarantees.
Landlord ↔ Tenant lean methodology
- Overall (STATE)
- 46 Balanced
- State Minnesota
- 46 Balanced · D+2
- County
- — inherits STATE
- City
- — inherits STATE
ZIP-level market 55107
- Home prices YoY
- -16.2%
- Rents YoY
- 10.8%
- Active inventory
- 64
- Price-to-rent
- 27.1×
Monthly cashflow live
- Estimated rent
- $5,232 high interval (Pro) →
- Mortgage (P&I)
- −$2,229
- Tax from tax record
- −$187 /mo · $2,248/yr
- Insurance
- −$177
- HOA
- −$0
- Vacancy / Maint / Mgmt
- −$1,099
- Net cashflow
- $1,540
Break-even live
4-unit breakdown (identical units grouped — click to expand)
| Units | Beds | Baths | Est. rent |
|---|---|---|---|
| 4× units | 2.0 | 1 | $5,232 |
| #1 | 2.0 | 1 | $1,308 |
| #2 | 2.0 | 1 | $1,308 |
| #3 | 2.0 | 1 | $1,308 |
| #4 | 2.0 | 1 | $1,308 |
| Total (4 units) | $5,232 | ||
UW: 25.0% down · 7.5% · 30yr · 1.5% tax · 5.0% vac · 8.0% maint · 8.0% mgmt
Financing live
Cash to close
- Down payment
- $106,250
- Closing costs
- $12,750
- Reserves months
- —
- Total cash needed
- —
Loan-product check · same deal, 3 products live
Conventional
25% down · 7.5% · 30yr
- Down + closing
- —
- Monthly P&I
- —
- Monthly cashflow
- —
- DSCR
- —
- Eligible?
- —
Personal DTI + credit; lowest rate.
DSCR
20% down · 8.5% · 30yr
- Down + closing
- —
- Monthly P&I
- —
- Monthly cashflow
- —
- DSCR
- —
- Eligible?
- —
No personal income docs; deal must DSCR.
Hard money
10% down · 12.0% · 12mo
- Down + closing
- —
- Monthly P&I
- —
- Monthly cashflow
- —
- DSCR
- —
- Eligible?
- —
Short-term bridge; refi at stabilization.
Listing history 40 events
-
2026-06-18days on market $425,000 Active 84 DOM
-
2026-06-17days on market $425,000 Active 83 DOM
-
2026-06-16days on market $425,000 Active 82 DOM
-
2026-06-15price $425,000 Active 81 DOM
-
2026-06-15days on market $449,750 Active 81 DOM
-
2026-06-13days on market $449,750 Active 79 DOM
-
2026-06-09days on market $449,750 Active 75 DOM
-
2026-06-08days on market $449,750 Active 74 DOM
-
2026-06-07days on market $449,750 Active 73 DOM
-
2026-06-04days on market $449,750 Active 70 DOM
-
2026-06-03days on market $449,750 Active 69 DOM
-
2026-06-02days on market $449,750 Active 68 DOM
-
2026-06-01days on market $449,750 Active 67 DOM
-
2026-05-31days on market $449,750 Active 66 DOM
-
2026-05-01price $449,750 1158-char remark
Show marketing remark (1158 chars)
4-plex on St. Paul's West Side. Potential owner-occupant opportunity with one unit becoming vacant at the end of June. Located in a tucked-away residential block with easy access to downtown, West Side Flats, and District del Sol. Near parks, restaurants, and transit. Two 2BR/1BA and two 1BR/1BA units, 2,950 SF total. All four tenants on signed leases (mid-2026 through mid-2027) with rents raised during the most recent lease-up cycle. Current rents still sit below market ceiling, leaving room on renewals. Tenants pay gas and electric; landlord covers water/sewer and trash. Enrolled in St. Paul's 4d Affordable Housing Incentive Program, featuring up to 80% reduction in property tax class rates. The covenant transfers with the property, with estimated annual savings of $4,600+ over standard rates. Two units turned over in mid-2025 and were re-leased at meaningfully higher rents. The recent turnover cycle is complete; all four units are performing well with no deferred maintenance carried over. Priced under $500k with a low tax basis, strong occupancy, and cash flow in place. This is a rare combination to find in St. Paul's current market.
-
2026-03-26$475,000 Active 1158-char remark
Show marketing remark (1158 chars)
4-plex on St. Paul's West Side. Potential owner-occupant opportunity with one unit becoming vacant at the end of June. Located in a tucked-away residential block with easy access to downtown, West Side Flats, and District del Sol. Near parks, restaurants, and transit. Two 2BR/1BA and two 1BR/1BA units, 2,950 SF total. All four tenants on signed leases (mid-2026 through mid-2027) with rents raised during the most recent lease-up cycle. Current rents still sit below market ceiling, leaving room on renewals. Tenants pay gas and electric; landlord covers water/sewer and trash. Enrolled in St. Paul's 4d Affordable Housing Incentive Program, featuring up to 80% reduction in property tax class rates. The covenant transfers with the property, with estimated annual savings of $4,600+ over standard rates. Two units turned over in mid-2025 and were re-leased at meaningfully higher rents. The recent turnover cycle is complete; all four units are performing well with no deferred maintenance carried over. Priced under $500k with a low tax basis, strong occupancy, and cash flow in place. This is a rare combination to find in St. Paul's current market.
-
2025-09-16historical
-
2025-06-18price $499,000
-
2025-06-02price $515,000
-
2025-05-26price $525,000
-
2025-05-15$539,000 Active
-
2023-07-25soldstatus $425,000 Sold
-
2023-07-25soldstatus $425,000
-
2023-07-18status Pending
-
2023-07-18status Active
-
2023-06-08historical Contingent - Subject to Financing
-
2023-05-15status Active
-
2023-05-01historical Contingent - Inspection
-
2023-04-27$435,000 Active
-
2023-01-01historical
-
2022-11-07price $437,000
-
2022-10-21$450,000 Active
-
2019-12-18soldstatus $315,000
-
2016-09-08historical
-
2016-08-29soldstatus $170,274
-
2016-08-18$269,900 Active
-
2016-08-15soldstatus $170,275 Sold
-
2016-07-15status Pending
-
2016-07-14historical Contingent - Inspection
-
2016-07-12$175,000 Active
ⓘ Source: listings_history table (triggers on properties + properties_extension) + one-shot
backfill from property_details.listing_events for pre-trigger history.
Tax reassessment forecast MN · Partial reset (capped growth)
- Current annual tax
- $2,248 · $187/mo
- Projected year-2 tax
- $3,504 · $292/mo
- Expected delta
- +$1,256/yr (+$105/mo · 55.9%)
ⓘ Screening estimate from a state-policy table — verify with the county assessor before closing.
Climate risk First Street
- Flood 1/10 Low FEMA zone X (unshaded) · 0% chance over 30 yrs
- Wildfire 1/10 Low
- Heat 2/10 Low 7 d/yr ≥100°F today · 14 d/yr by 30 yrs out
- Wind 2/10 Low
- Air quality 2/10 Low 1 unhealthy d/yr today · 1 by 30 yrs out
Nearby sold comps map
Loading sold comps map…
Walkable amenities ~0.75 mi
Loading nearby amenities…
Taxation est. · year 1
- Rental income
- $62,784
- − Mortgage interest
- −$23,807
- − Property taxes
- −$2,248
- − Insurance
- −$2,125
- − Repairs & maintenance
- −$5,023
- − Management
- −$5,023
- − Depreciation
- −$12,364
- Taxable income
- $12,195
- Est. tax owed @ 24.0%
- −$2,927
- After-tax cash flow
- $15,555/yr
For passive investors: Depreciation is non-cash, so a rental often shows a tax loss while cash-flowing — sheltering income. Rental losses are passive: they offset passive income freely, and up to $25,000/yr can offset ordinary (W-2) income if you actively participate and your MAGI is under $100k (phasing out to $0 by $150k); unused losses carry forward. On sale, claimed depreciation is recaptured at up to 25%, and gains may owe capital-gains tax (a 1031 exchange can defer both). Figures are a year-1 estimate at your 24.0% rate — not tax advice; consult a CPA.
Schools (NCES district)
- District
- St. Paul Public School District
- NCES district ID
- 2733840
- Math proficiency
- 21% ▼ -11.00%
- Reading proficiency
- 33% ▼ -7.00%
- Median HH income
- $48,316
- Composite
- 23.51/100
- National rank
- #7868
- State rank
- #270 of 301 in MN
Livability — St. Paul
No livability data for this city. (Only ~50 U.S. cities are tracked.)
Census & demographics
- Census place
- St. Paul, MN
- County
- Ramsey County · 542,837 people
- City population
- 280,599
- Metro
- Minneapolis-St. Paul-Bloomington, MN-WI
- Population (ZIP)
- 15,377
- Household income
- $74,531
- Rent vs Own
- Severe rent burden
- 639.0
Population outlook (Ramsey County) Hauer SSP2
- Today (2025)
- 603,431 people
- By 2030
- 636,459 · +5.5%
- By 2040
- 700,596 · +16.1%
- By 2050
- 765,819 · +26.9%
- By 2075
- 929,297 · +54.0%
- By 2100
- 1,053,924 · +74.7%
Race, ethnicity, and origin ACS 2023
- Neighborhood character
- Highly diverse neighborhood (Simpson 0.71)
- Race & ethnicity
- White 47% Hispanic / Latino 23% Two or more races 16% Black 13% Asian 9% Native American 2%
- Hispanic origin (detail)
- Mexican 19%
- Common ancestry
- Portuguese 7% Lithuanian 3% Romanian 2%
- Foreign-born
- 18% · Canada, Philippines, Vietnam
- Languages at home
- 72% English-only · Spanish 15% Other Asian/Pacific 4% Tagalog/Filipino 2%
Political lean MEDSL · Ramsey
- 2024 margin
- Solid D (+43.3) · D 70.5% · R 27.2% · Other 2.3%
- 2008→2024 swing
- +9.4pp toward D · 2008: 33.9pp · 2024: 43.3pp
- All cycles
- 2024: D+43.3 2020: D+45.4 2016: D+39.4 2012: D+35.3 2008: D+33.9
Not yet ingested
- Civics
- —
Market trends
- HPI YoY
- ▼ -57.70%
- Current HPI
- 298.8714
- Rent YoY
- ▲ 10.76%
- Metro
- Minneapolis-St. Paul-Bloomington, MN-WI
- State GDP YoY
- ▲ 2.41%
- F500 in state
- 34
Industry mix (Fortune 500 HQ in MN)
| Industry | F500 HQs | Revenue |
|---|---|---|
| Healthcare | 2 | $407B |
|
||
| Retail | 2 | $150B |
|
||
| Consumer Goods | 2 | $32B |
|
||
| Industrial Machinery | 2 | $6B |
|
||
| Agriculture | 1 | $40B |
|
||
| Healthcare / Medical Devices | 1 | $32B |
|
||
Price history
+157.0% since first listed26 events — show timeline
- 2026-05-01 Price Changed $449,750 NORTHSTARMLS as Distributed by MLS Grid
- 2026-03-26 Listed $475,000 NORTHSTARMLS as Distributed by MLS Grid
- 2025-09-16 Listing Removed — NORTHSTARMLS as Distributed by MLS Grid
- 2025-06-18 Price Changed $499,000 NORTHSTARMLS as Distributed by MLS Grid
- 2025-06-02 Price Changed $515,000 NORTHSTARMLS as Distributed by MLS Grid
- 2025-05-26 Price Changed $525,000 NORTHSTARMLS as Distributed by MLS Grid
- 2025-05-15 Listed $539,000 NORTHSTARMLS as Distributed by MLS Grid
- 2023-07-25 Sold (Public Records) $425,000 Public Records
- 2023-07-25 Sold (MLS) $425,000 NORTHSTARMLS as Distributed by MLS Grid
- 2023-07-18 Pending — NORTHSTARMLS as Distributed by MLS Grid
- 2023-07-18 Relisted — NORTHSTARMLS as Distributed by MLS Grid
- 2023-06-08 Contingent — NORTHSTARMLS as Distributed by MLS Grid
- 2023-05-15 Relisted — NORTHSTARMLS as Distributed by MLS Grid
- 2023-05-01 Contingent — NORTHSTARMLS as Distributed by MLS Grid
- 2023-04-27 Listed $435,000 NORTHSTARMLS as Distributed by MLS Grid
- 2023-01-01 Listing Removed — NORTHSTARMLS as Distributed by MLS Grid
- 2022-11-07 Price Changed $437,000 NORTHSTARMLS as Distributed by MLS Grid
- 2022-10-21 Listed $450,000 NORTHSTARMLS as Distributed by MLS Grid
- 2019-12-18 Sold (Public Records) $315,000 Public Records
- 2016-09-08 Listing Removed — NORTHSTARMLS as Distributed by MLS Grid
- 2016-08-29 Sold (Public Records) $170,274 Public Records
- 2016-08-18 Listed $269,900 NORTHSTARMLS as Distributed by MLS Grid
- 2016-08-15 Sold (MLS) $170,275 NORTHSTARMLS as Distributed by MLS Grid
- 2016-07-15 Pending — NORTHSTARMLS as Distributed by MLS Grid
- 2016-07-14 Contingent — NORTHSTARMLS as Distributed by MLS Grid
- 2016-07-12 Listed $175,000 NORTHSTARMLS as Distributed by MLS Grid
Property tax history
-6.2%/yrLatest (2025): $2,248 · -66.3% YoY. Source: county tax records.
Cash-flow waterfall
monthlySold comps — $/sqft
last 12 mo · ≤1 miLoading sold comps…