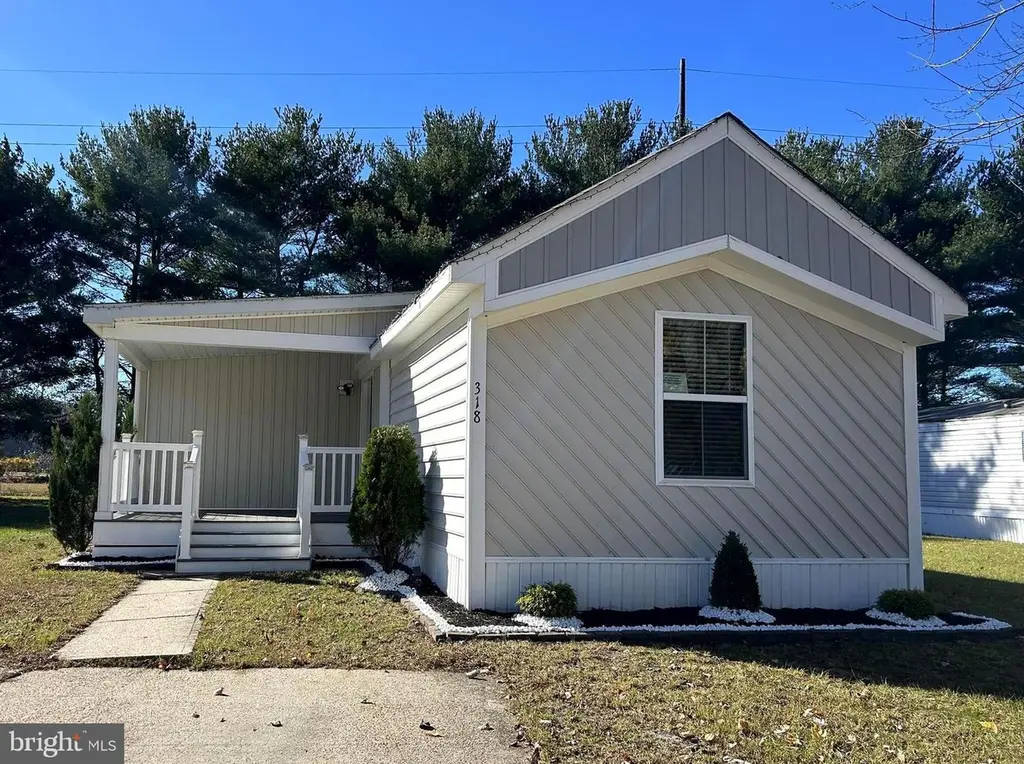
318 Holiday St · Fruitland, MD
Flood risk 3/10 · Minor
- FEMA flood zone
- X (unshaded)
- Chance of flooding over 30 yrs
- 0.2%
- Est. flood insurance / yr
- $507 – $1,088
Fire risk 3/10 · Minor
- Est. fire insurance / yr
- $755 – $1,403
Heat risk 8/10 · Major
- Hot days now (above 105°F)
- 7 days/yr
- Hot days in 30 yrs
- 16 days/yr
Wind risk 7/10 · Major
- Chance of severe wind over 30 yrs
- 78.0%
Air-quality risk 2/10 · Minimal
- Unhealthy air days now
- 2 days/yr
- Unhealthy air days in 30 yrs
- 2 days/yr
Risk factors via First Street. Map © Google.
Why this score? — see what drove the C+ grade
The composite is a weighted blend of 9 inputs, each scored 0–100. Each bar is that input's sub-score; the figure is the points it added to the 100-point composite (weight × sub-score).
- Cash flow +30.0/30.0
- 1% rule +10.0/10.0
- DSCR +10.0/10.0
- Livability +3.5/5.0
- Rent growth +2.5/5.0
- Condition / age +2.5/5.0
- Schools +1.9/10.0
- ARV discount +0.0/15.0
- Appreciation +0.0/10.0
$114,900
🖨 Deal sheet (PDF) 📄 Offer letter ✓ Due diligence
Listing remarks MLS
Renovated 3-Bedroom, 2-Bath Manufactured Home This fully renovated manufactured home features 3 bedrooms, 2 bathrooms, and brand-new flooring throughout. The kitchen has been updated with new appliances, cabinets, and finishes. Both bathrooms have been refreshed with modern updates. The property includes a storage shed in the backyard and a driveway that fits two cars. Move-in ready with all major improvements already completed.
Key facts
- 2 parking spots
- Built 1988
- Listed 214 days
Neighborhood map
What this means for you Summary
Snapshot
- This is a 3-bed/2.0-bath single-family listed at $115k.
Deal economics
- At list price, monthly cash flow is $569 ($7k/yr) — positive.
- The deal already cash-flows at list — no discount required.
- Meets the 1% rule at list price ($2k rent vs $115k).
- Recommended offer: $101k (12.0% below list) — sets the bar for market timing.
- Cap rate 12.2% vs local median 3.6% in Fruitland — top-decile yield for the area; either an underpriced asset or a hidden risk that comps aren't pricing in. Stress-test before assuming the spread holds.
Location & tenants
- Location reads 70/100 on livability (#179 in MD) — a middle-class / working-renter tenant base. Strengths: cost of living A, housing A, health & safety A; Watch: schools D, amenities F, commute F.
- Wicomico County Public Schools (urban): math 16% / reading 26% proficiency, ranked #19 of 24 in MD (top 79%) — low school quality limits family demand, transient renter base, plan for 1-2y turnover.
- Market conditions: 43 active listings in the ZIP; 5 comparable units currently listed for rent nearby; rentals lingering (median 45d on market — plan ~5-8 weeks vacancy on turnover, expect pricing pressure); 60% of comp listings sitting > 30 days — soft ceiling on asking rent; 278 units permitted in Wicomico County in 2024 (44 in 5+ unit buildings).
- This rent runs 32% of the median local income ($65k/yr) — at the standard rent-burdened threshold; future hikes will face affordability resistance.
Forward outlook
- Local home prices are declining (-3.0%/yr); year-one equity from $794 of loan paydown is wiped out by about $3k of value loss. Plan a longer hold.
- Wicomico County population projected at +14% by 2050 — modest demand growth; plan on rents tracking national, not racing it.
- At projected returns (-3.0% appreciation + 3.0% rent growth), your $32k cash investment doubles in ~6 years — after that, you're playing with house money.
Negotiation context
- It's been on market 215 days — a 12% lower offer ($101k) is reasonable based on typical stale-listing flexibility.
- 2 sale attempts since 24y ago; this cycle's ask has dropped $24k (17%) from the opening price — seller is motivated, your offer sets the floor, not the list.
Risks & watch-outs
- Climate carrying-cost: major wind risk, 78% chance of damaging wind over 30y; extreme-heat days projected 7→16/yr by 2055 (HVAC capex compounding) — expect insurance premiums to compound above CPI over the hold.
Questions for the listing agent
- It's been on market 215 days. Have you received any prior offers? Is the seller open to a 12% concession, seller financing, or rate buy-down credit?
- Why hasn't it sold? Are there any deal-killer items the seller is aware of (foundation, flood, title, zoning, code violations)?
- Is there a deadline driving the sale (1031 exchange, divorce, estate, relocation)? That informs how much negotiation room exists.
- Schools are D-rated, which usually means shorter tenancies and higher turnover. Who's the typical renter profile here, and what's been the actual vacancy rate?
- What's the average days-on-market for RENTAL listings here right now (not sales)? A rising rental-DOM trend means longer vacancies and softer asking-rent achievability than the comps imply.
- What's the recent tenant-quality profile in this submarket — average credit score on applications, eviction rate, late-payment / NSF rate, and stable-employment percentage? A property-management company in the area should have these aggregated.
- How much new for-sale + rental construction is in the pipeline within 1–3 miles? Heavy new supply typically softens prices + rents 12–24 months out; constrained supply supports both.
Investment metrics
- 1% rule
- 1.50% ✓
- Cap rate
- 12.23%
- Cash-on-cash
- 21.21%
- DSCR
- 1.94
- GRM
- 5.6
CMA / ARV
- ARV (median comp)
- $89,797
- List price
- $114,900
- Delta
- 27.96%
- Verdict
- OVERPRICED
- Comps
- 20 within 1.0 mi
Show comp detail 12 sales within ~0.75 mi
| Address | Dist | Beds/Ba | Sqft | Sold | Price | $/sf | Match |
|---|---|---|---|---|---|---|---|
| 315 S Camden Ave | 0.45mi | 3/2.0 | 1,248 (+3%) | 1mo | $327,000 | $262 | 73 |
| 612 S Division St | 0.29mi | 3/2.0 | 1,344 (+11%) | 6mo | $255,000 | $190 | 63 |
| 410 S Camden Ave | 0.42mi | 3/2.0 | 1,312 (+8%) | 8mo | $261,900 | $200 | 60 |
| 613 S Camden Ave | 0.35mi | 3/2.0 | 1,056 (-13%) | 4mo | $239,900 | $227 | 59 |
| 120 Ridgefield Ln | 0.39mi | 3/1.0 | 1,120 (-8%) | 8mo | $201,500 | $180 | 58 |
| 28200 SW Allen Cut Off Rd SW | 0.55mi | 3/1.0 | 1,272 (+5%) | 12mo | $261,400 | $206 | 52 |
| 201 Herbal Ct | 0.73mi | 3/2.0 | 1,248 (+3%) | 12mo | $260,000 | $208 | 51 |
| 111 Moore Ave | 0.64mi | 3/1.0 | 1,200 (-1%) | 16mo | $237,900 | $198 | 51 |
| 104 S Camden Ave | 0.75mi | 3/1.0 | 1,180 (-3%) | 9mo | $210,990 | $179 | 49 |
| 209 W Main St | 0.69mi | 3/1.5 | 1,092 (-10%) | 6mo | $220,000 | $201 | 44 |
| 207 Walden Dr | 0.65mi | 3/2.0 | 1,100 (-9%) | 16mo | $210,000 | $191 | 42 |
| 117 Moore Ave | 0.61mi | 3/2.0 | 1,344 (+11%) | 17mo | $250,000 | $186 | 39 |
Match score weights: distance 35% · size 25% · config 20% · recency 20%. Top-matched comps best support the ARV.
Projected returns pro-forma
-3.0% appreciation · 3.0% rent growth · sell at horizon
- IRR
- 13.7%
- Equity multiple
- 1.55×
- Total profit
- $17,629
- Equity at exit
- $17,132
- IRR
- 22.5%
- Equity multiple
- 2.93×
- Total profit
- $62,097
- Equity at exit
- $9,934
Cash invested: $32,172 (down + closing). Projections, not guarantees.
Landlord ↔ Tenant lean methodology
- Overall (STATE)
- 27 Tenant-Leaning
- State Maryland
- 27 Tenant-Leaning · D+14
- County
- — inherits STATE
- City
- — inherits STATE
ZIP-level market 21826
- Home prices YoY
- -7.6%
- Active inventory
- 43
- Price-to-rent
- 5.6×
Monthly cashflow live
- Estimated rent
- $1,725 high interval (Pro) →
- Mortgage (P&I)
- −$603
- Tax est. 1.5%
- −$144 /mo · $1,724/yr
- Insurance
- −$48
- HOA
- −$0
- Vacancy / Maint / Mgmt
- −$362
- Net cashflow
- $569
Break-even live
Sensitivity live
| Price | -10% $648 | -5% $608 | +0% $569 | +5% $529 | +10% $489 |
|---|---|---|---|---|---|
| Rent | -10% $432 | -5% $501 | +0% $569 | +5% $637 | +10% $705 |
| Rate | -1.0pp $627 | -0.5pp $598 | base $569 | +0.5pp $539 | +1.0pp $509 |
UW: 25.0% down · 7.5% · 30yr · 1.5% tax · 5.0% vac · 8.0% maint · 8.0% mgmt
Financing live
Cash to close
- Down payment
- $28,725
- Closing costs
- $3,447
- Reserves months
- —
- Total cash needed
- —
Loan-product check · same deal, 3 products live
Conventional
25% down · 7.5% · 30yr
- Down + closing
- —
- Monthly P&I
- —
- Monthly cashflow
- —
- DSCR
- —
- Eligible?
- —
Personal DTI + credit; lowest rate.
DSCR
20% down · 8.5% · 30yr
- Down + closing
- —
- Monthly P&I
- —
- Monthly cashflow
- —
- DSCR
- —
- Eligible?
- —
No personal income docs; deal must DSCR.
Hard money
10% down · 12.0% · 12mo
- Down + closing
- —
- Monthly P&I
- —
- Monthly cashflow
- —
- DSCR
- —
- Eligible?
- —
Short-term bridge; refi at stabilization.
Rent comps 5 comps
| Address | Beds | Baths | Sqft | Rent | $/sqft | DOM | Units | Dist |
|---|---|---|---|---|---|---|---|---|
| 103 W Main St Fruitland, MD | 2.0 | 1.0 | 1200 | $1,100 | $0.92 | 22d | 1 | 0.56mi |
| 413A Ogle Ave Fruitland, MD | 3.0 | 1.0 | 864 | $1,700 | $1.97 | 22d | 1 | 0.56mi |
| 732 Wye Oak Dr Fruitland, MD | 3.0 | 2.5 | 1396 | $2,300 | $1.65 | 44d | 1 | 0.94mi |
| 508 Hayward Ave Fruitland, MD | 2.0 | 1.0 | 992 | $1,450 | $1.46 | 44d | 1 | 1.01mi |
| 801 W Main St Fruitland, MD | 4.0 | 1.0 | 1232 | $1,700 | $1.38 | 44d | 1 | 1.24mi |
Listing history 22 events
-
2026-06-21days on market $114,900 Active 215 DOM
-
2026-06-18days on market $114,900 Active 212 DOM
-
2026-06-17days on market $114,900 Active 211 DOM
-
2026-06-16days on market $114,900 Active 210 DOM
-
2026-06-15days on market $114,900 Active 209 DOM
-
2026-06-14days on market $114,900 Active 207 DOM
-
2026-06-13days on market $114,900 Active 206 DOM
-
2026-06-10days on market $114,900 Active 204 DOM
-
2026-06-09days on market $114,900 Active 203 DOM
-
2026-06-08days on market $114,900 Active 202 DOM
-
2026-06-07days on market $114,900 Active 201 DOM
-
2026-06-03days on market $114,900 Active 197 DOM
-
2026-06-02days on market $114,900 Active 196 DOM
-
2026-06-01days on market $114,900 Active 195 DOM
-
2026-05-31days on market $114,900 Active 194 DOM
-
2026-05-30days on market $114,900 Active 193 DOM
-
2026-03-21price $114,900 432-char remark
Show marketing remark (432 chars)
Renovated 3-Bedroom, 2-Bath Manufactured Home This fully renovated manufactured home features 3 bedrooms, 2 bathrooms, and brand-new flooring throughout. The kitchen has been updated with new appliances, cabinets, and finishes. Both bathrooms have been refreshed with modern updates. The property includes a storage shed in the backyard and a driveway that fits two cars. Move-in ready with all major improvements already completed.
-
2026-02-24price $119,900 432-char remark
Show marketing remark (432 chars)
Renovated 3-Bedroom, 2-Bath Manufactured Home This fully renovated manufactured home features 3 bedrooms, 2 bathrooms, and brand-new flooring throughout. The kitchen has been updated with new appliances, cabinets, and finishes. Both bathrooms have been refreshed with modern updates. The property includes a storage shed in the backyard and a driveway that fits two cars. Move-in ready with all major improvements already completed.
-
2025-11-19$139,000 Active 432-char remark
Show marketing remark (432 chars)
Renovated 3-Bedroom, 2-Bath Manufactured Home This fully renovated manufactured home features 3 bedrooms, 2 bathrooms, and brand-new flooring throughout. The kitchen has been updated with new appliances, cabinets, and finishes. Both bathrooms have been refreshed with modern updates. The property includes a storage shed in the backyard and a driveway that fits two cars. Move-in ready with all major improvements already completed.
-
2025-11-17historical $139,000 432-char remark
Show marketing remark (432 chars)
Renovated 3-Bedroom, 2-Bath Manufactured Home This fully renovated manufactured home features 3 bedrooms, 2 bathrooms, and brand-new flooring throughout. The kitchen has been updated with new appliances, cabinets, and finishes. Both bathrooms have been refreshed with modern updates. The property includes a storage shed in the backyard and a driveway that fits two cars. Move-in ready with all major improvements already completed.
-
2002-08-15historical
-
2002-02-15$17,000
ⓘ Source: listings_history table (triggers on properties + properties_extension) + one-shot
backfill from property_details.listing_events for pre-trigger history.
Climate risk First Street
- Flood 3/10 Moderate FEMA zone X (unshaded) · 20% chance over 30 yrs
- Wildfire 3/10 Moderate
- Heat 8/10 Severe 7 d/yr ≥105°F today · 16 d/yr by 30 yrs out
- Wind 7/10 Severe 78% chance of damaging wind over 30 yrs
- Air quality 2/10 Low 2 unhealthy d/yr today · 2 by 30 yrs out
Nearby sold comps map
Loading sold comps map…
Walkable amenities ~0.75 mi
Loading nearby amenities…
Taxation est. · year 1
- Rental income
- $20,700
- − Mortgage interest
- −$6,436
- − Property taxes
- −$1,724
- − Insurance
- −$574
- − Repairs & maintenance
- −$1,656
- − Management
- −$1,656
- − Depreciation
- −$3,343
- Taxable income
- $5,311
- Est. tax owed @ 24.0%
- −$1,275
- After-tax cash flow
- $5,550/yr
For passive investors: Depreciation is non-cash, so a rental often shows a tax loss while cash-flowing — sheltering income. Rental losses are passive: they offset passive income freely, and up to $25,000/yr can offset ordinary (W-2) income if you actively participate and your MAGI is under $100k (phasing out to $0 by $150k); unused losses carry forward. On sale, claimed depreciation is recaptured at up to 25%, and gains may owe capital-gains tax (a 1031 exchange can defer both). Figures are a year-1 estimate at your 24.0% rate — not tax advice; consult a CPA.
Schools (NCES district)
- District
- Wicomico County Public Schools
- NCES district ID
- 2400690
- Math proficiency
- 16% ▼ -18.00%
- Reading proficiency
- 26% ▼ -13.00%
- Median HH income
- $51,745
- Composite
- 18.87/100
- National rank
- #8860
- State rank
- #19 of 24 in MD
Livability — Fruitland
- Score
- 70/100
- State rank
- #179
- US rank
- #7980
Category grades
Schools grade is shown separately in the Schools card above.
Census & demographics
- Census place
- Fruitland, MD
- County
- Wicomico County · 75,969 people
- City population
- 5,451
- Metro
- Salisbury, MD-DE
- Population (ZIP)
- 5,451
- Household income
- $64,946
- Rent vs Own
- Severe rent burden
- 294.0
Population outlook (Wicomico County) Hauer SSP2
- Today (2025)
- 108,548 people
- By 2030
- 111,783 · +3.0%
- By 2040
- 118,139 · +8.8%
- By 2050
- 123,641 · +13.9%
- By 2075
- 139,784 · +28.8%
- By 2100
- 145,334 · +33.9%
Race, ethnicity, and origin ACS 2023
- Neighborhood character
- Diverse neighborhood (Simpson 0.65)
- Race & ethnicity
- White 51% Black 27% Hispanic / Latino 14% Two or more races 11% Asian 3%
- Hispanic origin (detail)
- Puerto Rican 2% Dominican 3%
- Common ancestry
- Hispanic 2% Romanian 2% Lithuanian 2%
- Foreign-born
- 10% · Canada, China, South Korea
- Languages at home
- 77% English-only · Spanish 14% Other Asian/Pacific 4% Korean 1%
Political lean MEDSL · Wicomico
- 2024 margin
- Lean R (+5.5) · D 46.1% · R 51.5% · Other 2.4%
- 2008→2024 swing
- +0.3pp no change · 2008: -5.8pp · 2024: -5.5pp
- All cycles
- 2024: R+5.5 2020: R+1.9 2016: R+11.6 2012: R+6.9 2008: R+5.8
Not yet ingested
- Civics
- —
Market trends
- HPI YoY
- ▼ -19.52%
- Current HPI
- 236.5727
- Rent YoY
- —
- Metro
- Salisbury, MD-DE
- State GDP YoY
- ▲ 2.97%
- F500 in state
- 12
Industry mix (Fortune 500 HQ in MD)
| Industry | F500 HQs | Revenue |
|---|---|---|
| Aerospace / Defense | 1 | $71B |
|
||
| Utilities | 1 | $25B |
|
||
| Hotels | 1 | $24B |
|
||
| Consumer Goods | 1 | $7B |
|
||
| Real Estate | 1 | $6B |
|
||
| Chemicals | 1 | $2B |
|
||
Price history
+575.9% since first listed6 events — show timeline
- 2026-03-21 Price Changed $114,900 BRIGHT MLS
- 2026-02-24 Price Changed $119,900 BRIGHT MLS
- 2025-11-19 Listed $139,000 BRIGHT MLS
- 2025-11-17 Coming Soon $139,000 BRIGHT MLS
- 2002-08-15 Listing Removed — BRIGHT MLS
- 2002-02-15 Listed $17,000 BRIGHT MLS
Cash-flow waterfall
monthlySold comps — $/sqft
last 12 mo · ≤1 miLoading sold comps…