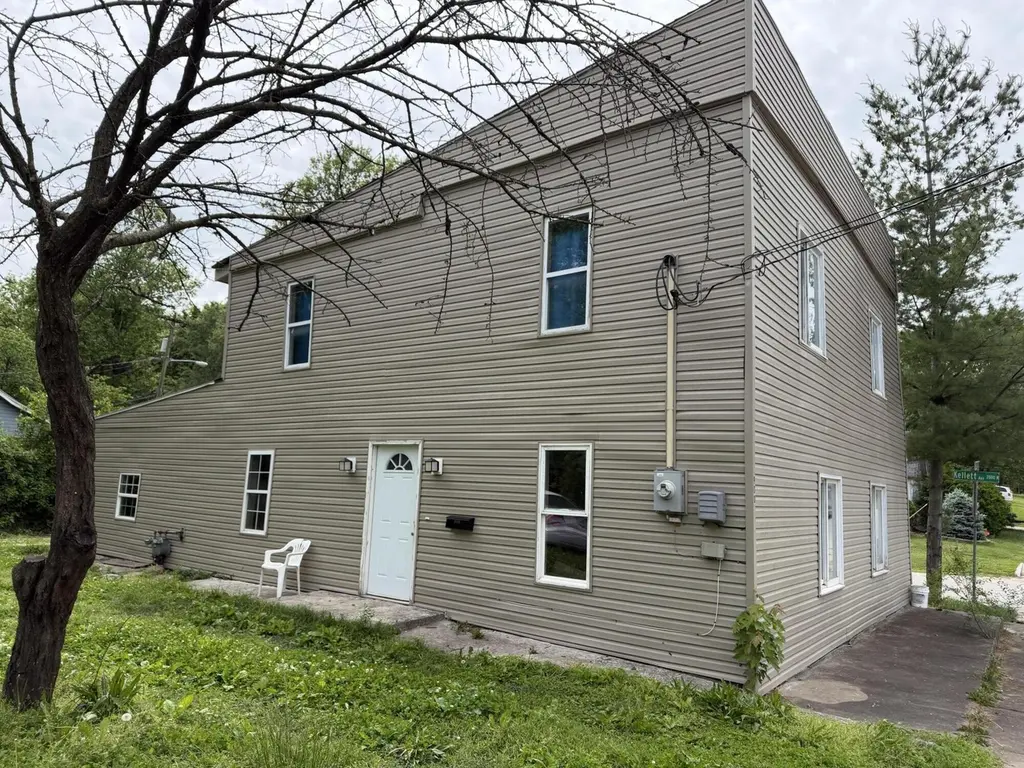
900 E Dale St · Springfield, MO
Flood risk 4/10 · Minor
- FEMA flood zone
- X (unshaded)
- Chance of flooding over 30 yrs
- 0.22%
- Est. flood insurance / yr
- $507 – $1,088
Fire risk 1/10 · Minimal
- Est. fire insurance / yr
- $1,054 – $1,958
Heat risk 5/10 · Moderate
- Hot days now (above 105°F)
- 7 days/yr
- Hot days in 30 yrs
- 17 days/yr
Wind risk 2/10 · Minimal
- Chance of severe wind over 30 yrs
- —
Air-quality risk 2/10 · Minimal
- Unhealthy air days now
- 1 days/yr
- Unhealthy air days in 30 yrs
- 2 days/yr
Risk factors via First Street. Map © Google.
Why this score? — see what drove the C grade
The composite is a weighted blend of 9 inputs, each scored 0–100. Each bar is that input's sub-score; the figure is the points it added to the 100-point composite (weight × sub-score).
- Cash flow +18.8/30.0
- ARV discount +15.0/15.0
- DSCR +5.9/10.0
- 1% rule +3.9/10.0
- Livability +3.8/5.0
- Rent growth +3.6/5.0
- Schools +3.2/10.0
- Condition / age +2.5/5.0
- Appreciation +0.0/10.0
$192,000
🖨 Deal sheet 📄 Offer letter ✓ Due diligence
Listing remarks MLS
Welcome to 900 E. Dale. This is a great project for a Handyman! Seller has already started the remodel and has done a lot of updates but is unable to finish and selling ''as-is'' In 2010/2011 Seller installed New Central A/C System, New Furnace, New Water Heater, Dual Pane Windows and New Doors. Some updates on electrical and plumbing, drywall, new fixtures, remodeled bathrooms and floors. Roof only 8 years old. Needs some TLC and it's an awesome opportunity with a little bit of work to make it your own! Call today for a private showing!
Key facts
- Office
- Large living area
- Formal dining room
Tags
Property features AI
Finance
- Financial info: Annual tax reported: $800.61
Exterior
- Utilities: Public water; Public sewer
- Home design: Single-family residence; Residential property
- Construction: Two-story; Approx. 2,400 above-grade finished area
- Exterior features: 0.14-acre lot; Public water; Public sewer
Interior
- Bedrooms: 4 bedrooms
- Bathrooms: 4 full bathrooms
- Heating & cooling: Central heating (natural gas); Central air conditioning
- Interior features: Two levels
Neighborhood map
What this means for you Summary
Snapshot
- This is a 5-bed/4.0-bath other listed at $192k.
Deal economics
- At list price, monthly cash flow is $192 ($2k/yr) — positive.
- The deal already cash-flows at list — no discount required.
- To meet the 1% rule (rent ≥ 1% of price), the offer needs to be $170k (11.3% below list).
- Recommended offer: $170k (11.3% below list) — sets the bar for 1% rule.
- Cap rate 7.5% vs local median 4.6% in Springfield — top-decile yield for the area; either an underpriced asset or a hidden risk that comps aren't pricing in. Stress-test before assuming the spread holds.
Location & tenants
- Location reads 75/100 on livability (#57 in MO, #4,121 nationally) — a middle-class / working-renter tenant base. Strengths: commute A+, cost of living A+, housing A+; Watch: crime F, employment F.
- Springfield R-XII (urban): math 32% / reading 46% proficiency, ranked #174 of 324 in MO (top 54%) — families likely to look elsewhere, expect single-tenant / working-renter base with shorter leases.
- Zoned schools: Robberson Elem. (math 27% / reading 32%, grade F, #813 of 1,115 statewide, top 75%, 166 students, 89% FRL); Hillcrest High (math 9% / reading 35%, grade F, #462 of 521 statewide, top 90%, 1,017 students, 64% FRL) — zoned schools average 76% FRL vs 46% district-wide (30 pts higher); higher-poverty schools than district average — tighter screening recommended.
- Zoned-school proficiency averages 26% at this address vs 39% district-wide (-13 pts) — the specific schools serving this property underperform the Springfield R-XII average; the district grade overstates school quality for this exact location.
- Market conditions: Rents rising fast (+4.2%/yr); 394 active listings in the ZIP; 3 comparable units currently listed for rent nearby; rentals at typical pace (median 24d on market — plan ~3-4 weeks tenant-placement turnaround); 1,302 units permitted in Greene County in 2024 (250 in 5+ unit buildings).
- This rent runs 40% of the median local income ($51k/yr) — at the standard rent-burdened threshold; future hikes will face affordability resistance.
Forward outlook
- Local home prices are declining (-3.0%/yr); year-one equity from $1k of loan paydown is wiped out by about $6k of value loss. Plan a longer hold.
- Greene County population projected at +25% by 2050 — long-run rental-demand tailwind backs the buy-and-hold thesis.
Negotiation context
- It's been on market 35 days — a 3% lower offer ($186k) is reasonable based on typical stale-listing flexibility.
- 5 sale attempts since 10y ago with the ask held roughly flat each time — persistent listings suggest the price (not the market) is what's stuck; bring a comps-based counter.
Risks & watch-outs
- Watch-outs: built in 1927 — expect roof / HVAC / electrical / plumbing capex.
- Climate carrying-cost: extreme-heat days projected 7→17/yr by 2055 (HVAC capex compounding) — expect insurance premiums to compound above CPI over the hold.
Questions for the listing agent
- It's been on market 35 days. Have you received any prior offers? Is the seller open to a 11% concession, seller financing, or rate buy-down credit?
- Built in 1927 — when were the roof, HVAC, electrical panel, plumbing, and water heater last replaced?
- Is there a deadline driving the sale (1031 exchange, divorce, estate, relocation)? That informs how much negotiation room exists.
- Crime grade is F in this area — have there been break-ins, vandalism, or insurance claims at this property in the last 3 years? What carrier currently insures it and at what premium?
- What's the average days-on-market for RENTAL listings here right now (not sales)? A rising rental-DOM trend means longer vacancies and softer asking-rent achievability than the comps imply.
- What's the recent tenant-quality profile in this submarket — average credit score on applications, eviction rate, late-payment / NSF rate, and stable-employment percentage? A property-management company in the area should have these aggregated.
- How much new for-sale + rental construction is in the pipeline within 1–3 miles? Heavy new supply typically softens prices + rents 12–24 months out; constrained supply supports both.
Investment metrics
- 1% rule
- 0.89% ✗
- Cap rate
- 7.49%
- Cash-on-cash
- 4.28%
- DSCR
- 1.19
- GRM
- 9.4
CMA / ARV
- ARV (median comp)
- $245,433
- List price
- $192,000
- Delta
- -21.77%
- Verdict
- UNDERPRICED
- Comps
- 20 within 1.0 mi
Projected returns pro-forma
-3.0% appreciation · 4.24% rent growth · sell at horizon
- IRR
- -8.4%
- Equity multiple
- 0.69×
- Total profit
- $-16,817
- Equity at exit
- $28,628
- IRR
- 2.4%
- Equity multiple
- 1.18×
- Total profit
- $9,824
- Equity at exit
- $16,601
Cash invested: $53,760 (down + closing). Projections, not guarantees.
Landlord ↔ Tenant lean methodology
- Overall (STATE)
- 81 Strongly Landlord-Friendly
- State Missouri
- 81 Strongly Landlord-Friendly · R+10
- County
- — inherits STATE
- City
- — inherits STATE
ZIP-level market 65803
- Home prices YoY
- -29.8%
- Rents YoY
- 4.2%
- Active inventory
- 394
- Price-to-rent
- 9.4×
Monthly cashflow live
- Estimated rent
- $1,703 medium interval (Pro) →
- Mortgage (P&I)
- −$1,007
- Tax from tax record
- −$67 /mo · $801/yr
- Insurance
- −$80
- HOA
- −$0
- Vacancy / Maint / Mgmt
- −$358
- Net cashflow
- $192
Break-even live
UW: 25.0% down · 7.5% · 30yr · 1.5% tax · 5.0% vac · 8.0% maint · 8.0% mgmt
Financing live
Cash to close
- Down payment
- $48,000
- Closing costs
- $5,760
- Reserves months
- —
- Total cash needed
- —
Loan-product check · same deal, 3 products live
Conventional
25% down · 7.5% · 30yr
- Down + closing
- —
- Monthly P&I
- —
- Monthly cashflow
- —
- DSCR
- —
- Eligible?
- —
Personal DTI + credit; lowest rate.
DSCR
20% down · 8.5% · 30yr
- Down + closing
- —
- Monthly P&I
- —
- Monthly cashflow
- —
- DSCR
- —
- Eligible?
- —
No personal income docs; deal must DSCR.
Hard money
10% down · 12.0% · 12mo
- Down + closing
- —
- Monthly P&I
- —
- Monthly cashflow
- —
- DSCR
- —
- Eligible?
- —
Short-term bridge; refi at stabilization.
Rent comps 3 comps
| Address | Beds | Baths | Sqft | Rent | $/sqft | DOM | Units | Dist |
|---|---|---|---|---|---|---|---|---|
| 1439 N Texas Ave Springfield, MO | 4.0 | 2.0 | 1608 | $1,195 | $0.74 | 44d | 1 | 0.70mi |
| 916 N Pickwick Ave Springfield, MO | 4.0 | 3.0 | 1827 | $1,700 | $0.93 | 14d | 1 | 1.36mi |
| 501 W Central St Springfield, MO | 4.0 | 2.0 | 2000 | $2,200 | $1.10 | 23d | 1 | 1.41mi |
Listing history 28 events
-
2026-06-18days on market $192,000 Active 35 DOM
-
2026-06-17days on market $192,000 Active 34 DOM
-
2026-06-16days on market $192,000 Active 33 DOM
-
2026-06-15days on market $192,000 Active 32 DOM
-
2026-06-14days on market $192,000 Active 30 DOM
-
2026-06-10days on market $192,000 Active 27 DOM
-
2026-06-09days on market $192,000 Active 26 DOM
-
2026-06-08days on market $192,000 Active 25 DOM
-
2026-06-07days on market $192,000 Active 24 DOM
-
2026-06-03days on market $192,000 Active 20 DOM
-
2026-06-02days on market $192,000 Active 19 DOM
-
2026-06-01days on market $192,000 Active 18 DOM
-
2026-05-31days on market $192,000 Active 17 DOM
-
2026-05-30days on market $192,000 Active 16 DOM
-
2026-05-14$192,000 Active 599-char remark
-
2025-04-14historical $1,795
-
2025-03-14$1,795
-
2023-12-01historical $1,795
-
2023-10-25$1,795
-
2023-10-20historical $1,795
-
2023-10-14price $1,795
-
2023-09-04$1,995
-
2021-03-16soldstatus
-
2016-08-15soldstatus
-
2016-08-11soldstatus 543-char remark
Show marketing remark (543 chars)
Welcome to 900 E. Dale. This is a great project for a Handyman! Seller has already started the remodel and has done a lot of updates but is unable to finish and selling ''as-is'' In 2010/2011 Seller installed New Central A/C System, New Furnace, New Water Heater, Dual Pane Windows and New Doors. Some updates on electrical and plumbing, drywall, new fixtures, remodeled bathrooms and floors. Roof only 8 years old. Needs some TLC and it's an awesome opportunity with a little bit of work to make it your own! Call today for a private showing!
-
2016-04-12$44,900 543-char remark
Show marketing remark (543 chars)
Welcome to 900 E. Dale. This is a great project for a Handyman! Seller has already started the remodel and has done a lot of updates but is unable to finish and selling ''as-is'' In 2010/2011 Seller installed New Central A/C System, New Furnace, New Water Heater, Dual Pane Windows and New Doors. Some updates on electrical and plumbing, drywall, new fixtures, remodeled bathrooms and floors. Roof only 8 years old. Needs some TLC and it's an awesome opportunity with a little bit of work to make it your own! Call today for a private showing!
-
2009-01-06soldstatus
-
2005-12-09soldstatus
ⓘ Source: listings_history table (triggers on properties + properties_extension) + one-shot
backfill from property_details.listing_events for pre-trigger history.
Tax reassessment forecast MO · Resets to sale price
- Current annual tax
- $801 · $67/mo
- Projected year-2 tax
- $1,862 · $155/mo
- Expected delta
- +$1,062/yr (+$88/mo · 132.6%)
ⓘ Screening estimate from a state-policy table — verify with the county assessor before closing.
Climate risk First Street
- Flood 4/10 Moderate FEMA zone X (unshaded) · 22% chance over 30 yrs
- Wildfire 1/10 Low
- Heat 5/10 Major 7 d/yr ≥105°F today · 17 d/yr by 30 yrs out
- Wind 2/10 Low
- Air quality 2/10 Low 1 unhealthy d/yr today · 2 by 30 yrs out
Nearby sold comps map
Loading sold comps map…
Walkable amenities ~0.75 mi
Loading nearby amenities…
Taxation est. · year 1
- Rental income
- $20,439
- − Mortgage interest
- −$10,755
- − Property taxes
- −$801
- − Insurance
- −$960
- − Repairs & maintenance
- −$1,635
- − Management
- −$1,635
- − Depreciation
- −$5,585
- Taxable loss
- −$933
- Est. tax savings @ 24.0%
- +$224
- After-tax cash flow
- $2,527/yr
For passive investors: Depreciation is non-cash, so a rental often shows a tax loss while cash-flowing — sheltering income. Rental losses are passive: they offset passive income freely, and up to $25,000/yr can offset ordinary (W-2) income if you actively participate and your MAGI is under $100k (phasing out to $0 by $150k); unused losses carry forward. On sale, claimed depreciation is recaptured at up to 25%, and gains may owe capital-gains tax (a 1031 exchange can defer both). Figures are a year-1 estimate at your 24.0% rate — not tax advice; consult a CPA.
Schools (NCES district)
- District
- Springfield R-XII
- NCES district ID
- 2928860
- Math proficiency
- 32% ▼ -2.00%
- Reading proficiency
- 46% ▼ -3.00%
- Median HH income
- $37,886
- Composite
- 32.45/100
- National rank
- #5717
- State rank
- #174 of 324 in MO
Livability — Springfield
- Score
- 75/100
- State rank
- #57
- US rank
- #4121
Category grades
Schools grade is shown separately in the Schools card above.
Census & demographics
- Census place
- Springfield, MO
- County
- Greene County · 244,327 people
- City population
- 223,044
- Metro
- Springfield, MO
- Population (ZIP)
- 42,882
- Household income
- $50,572
- Rent vs Own
- Severe rent burden
- 1305.0
Population outlook (Greene County) Hauer SSP2
- Today (2025)
- 319,054 people
- By 2030
- 335,135 · +5.0%
- By 2040
- 366,186 · +14.8%
- By 2050
- 397,431 · +24.6%
- By 2075
- 477,035 · +49.5%
- By 2100
- 520,828 · +63.2%
Race, ethnicity, and origin ACS 2023
- Neighborhood character
- Predominantly White (82%)
- Race & ethnicity
- White 82% Two or more races 9% Hispanic / Latino 6% Black 4%
- Hispanic origin (detail)
- Mexican 2% Puerto Rican 2%
- Common ancestry
- Lithuanian 2% Italian 2% Iranian 2%
- Foreign-born
- 3% · Canada
- Languages at home
- 95% English-only · Spanish 3%
Political lean MEDSL · Greene
- 2024 margin
- Strong R (+20.8) · D 38.9% · R 59.7% · Other 1.4%
- 2008→2024 swing
- -5.0pp toward R · 2008: -15.8pp · 2024: -20.8pp
- All cycles
- 2024: R+20.8 2020: R+20.1 2016: R+27.4 2012: R+24.4 2008: R+15.8
Not yet ingested
- Civics
- —
Market trends
- HPI YoY
- ▼ -87.08%
- Current HPI
- 205.0439
- Rent YoY
- ▲ 4.24%
- Metro
- Springfield, MO
- State GDP YoY
- ▲ 1.84%
- F500 in state
- 20
Industry mix (Fortune 500 HQ in MO)
| Industry | F500 HQs | Revenue |
|---|---|---|
| Healthcare | 1 | $163B |
|
||
| Insurance | 1 | $21B |
|
||
| Industrial Technology | 1 | $17B |
|
||
| Retail | 1 | $16B |
|
||
| Industrial Distribution | 1 | $10B |
|
||
| Utilities | 1 | $9B |
|
||
Price history
+327.6% since first listed14 events — show timeline
- 2026-05-14 Listed $192,000 SOMO
- 2025-04-14 Rental Removed $1,795 APPFOLIO
- 2025-03-14 Listed for Rent $1,795 APPFOLIO
- 2023-12-01 Rental Removed $1,795 APPFOLIO
- 2023-10-25 Listed for Rent $1,795 APPFOLIO
- 2023-10-20 Rental Removed $1,795 APPFOLIO
- 2023-10-14 Price Changed $1,795 APPFOLIO
- 2023-09-04 Listed for Rent $1,995 APPFOLIO
- 2021-03-16 Sold (Public Records) — Public Records
- 2016-08-15 Sold (Public Records) — Public Records
- 2016-08-11 Sold (MLS) — SOMO
- 2016-04-12 Listed $44,900 SOMO
- 2009-01-06 Sold (Public Records) — Public Records
- 2005-12-09 Sold (Public Records) — Public Records
Property tax history
+11.7%/yrLatest (2025): $801 · +17.0% YoY. Source: county tax records.
Cash-flow waterfall
monthlySold comps — $/sqft
last 12 mo · ≤1 miLoading sold comps…