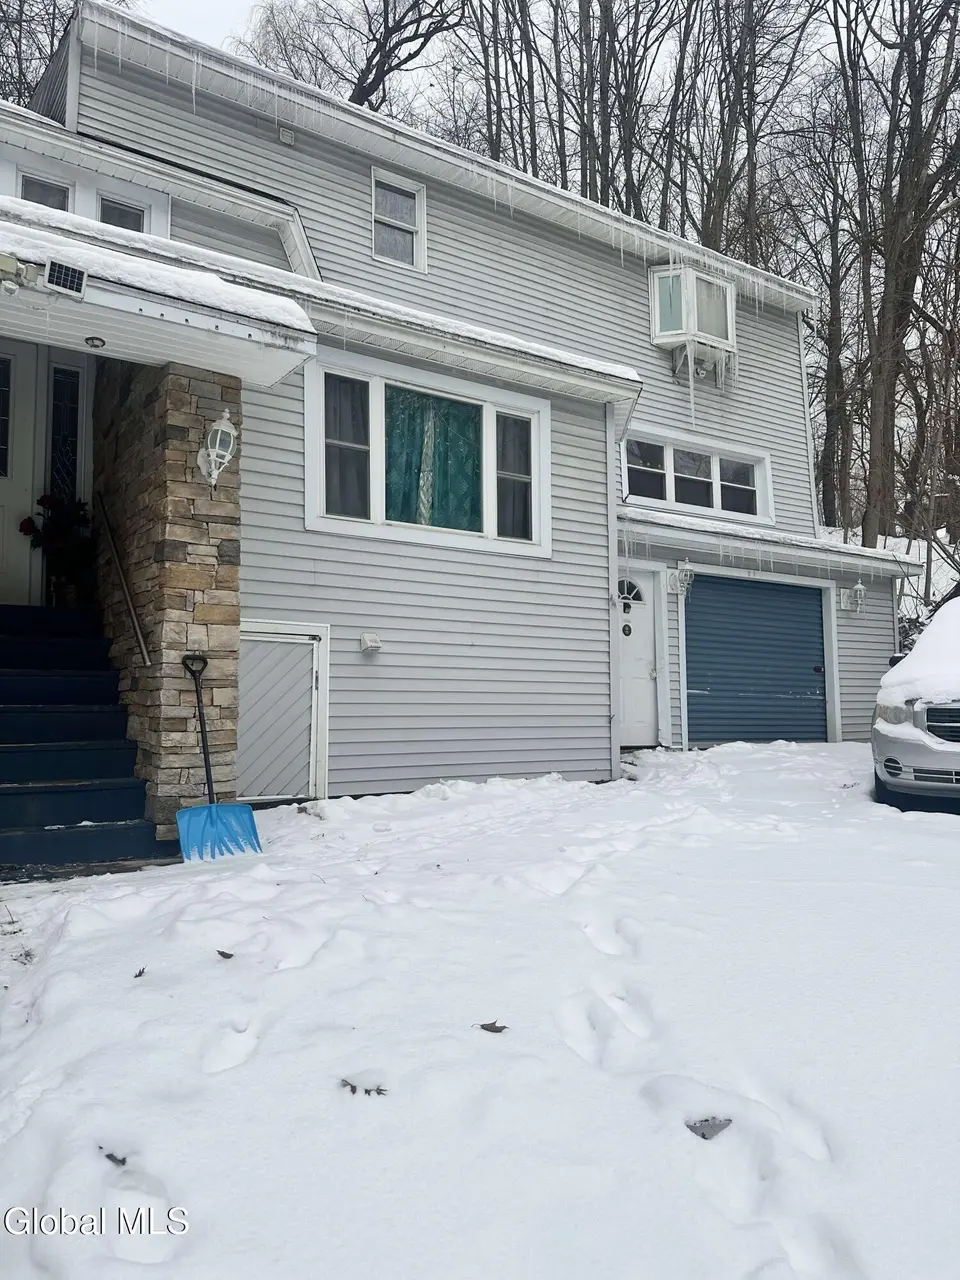
40 Northampton Rd · Amsterdam, NY
Flood risk 9/10 · Severe
- FEMA flood zone
- X (unshaded)
- Chance of flooding over 30 yrs
- 0.99%
- Est. flood insurance / yr
- $473 – $860
Fire risk 3/10 · Minor
- Est. fire insurance / yr
- $691 – $1,283
Heat risk 3/10 · Minor
- Hot days now (above 95°F)
- 7 days/yr
- Hot days in 30 yrs
- 16 days/yr
Wind risk 3/10 · Minor
- Chance of severe wind over 30 yrs
- 4.0%
Air-quality risk 1/10 · Minimal
- Unhealthy air days now
- 0 days/yr
- Unhealthy air days in 30 yrs
- 0 days/yr
Risk factors via First Street. Map © Google.
Why this score? — see what drove the C- grade
The composite is a weighted blend of 9 inputs, each scored 0–100. Each bar is that input's sub-score; the figure is the points it added to the 100-point composite (weight × sub-score).
- ARV discount +15.0/15.0
- Cash flow +10.0/30.0
- Appreciation +10.0/10.0
- Livability +3.8/5.0
- Schools +3.2/10.0
- DSCR +2.8/10.0
- 1% rule +2.7/10.0
- Rent growth +2.5/5.0
- Condition / age +2.5/5.0
$183,000
🖨 Deal sheet 📄 Offer letter ✓ Due diligence
Listing remarks MLS
Welcome to 40 N Hampton Rd—a great opportunity at an excellent price point. This home offers solid value and won't last long at this price. Whether you're a first-time buyer or an investor, this is one you'll want to see quickly. Schedule your showing today—this one won't wait!
Key facts
- 7,405 sq ft lot
- Garage
- Built 1930
Neighborhood map
What this means for you Summary
Snapshot
- This is a 3-bed/3.0-bath single-family listed at $183k.
Deal economics
- At list price, monthly cash flow is $-166 ($-2k/yr) — negative.
- To cash-flow at today's rent, offer at most $154k (16.0% below list).
- To meet the 1% rule (rent ≥ 1% of price), the offer needs to be $141k (23.0% below list).
- Recommended offer: $141k (23.0% below list) — sets the bar for 1% rule.
Location & tenants
- Location reads 75/100 on livability (#247 in NY, #3,884 nationally) — a middle-class / working-renter tenant base. Strengths: cost of living A+, housing A+, health & safety A+; Watch: schools D-, crime F, employment F.
- Amsterdam City School District (town): math 35% / reading 41% proficiency, ranked #546 of 590 in NY (top 92%) — families likely to look elsewhere, expect single-tenant / working-renter base with shorter leases.
- Market conditions: 164 active listings in the ZIP; 8 comparable units currently listed for rent nearby; rentals at typical pace (median 24d on market — plan ~3-4 weeks tenant-placement turnaround); 210 units permitted in Montgomery County in 2024 (168 in 5+ unit buildings).
Forward outlook
- In year one you build about $20k of equity ($1k loan paydown + $18k appreciation (10.0% local appreciation)).
- Montgomery County population projected at -11% by 2050 — secular population decline; favor cash flow + early exit over multi-decade hold.
- By year 2, paydown + projected appreciation supports a ~$31k cash-out refi (75% LTV) — recoverable capital for the next deal without selling this one.
Negotiation context
- It's been on market 139 days — a 12% lower offer ($161k) is reasonable based on typical stale-listing flexibility.
- 3 sale attempts since 16y ago with the ask held roughly flat each time — persistent listings suggest the price (not the market) is what's stuck; bring a comps-based counter.
- Current owner paid $145k; 26% above their basis — modest negotiation headroom, anchor on the comps not their cost.
Risks & watch-outs
- Watch-outs: flood insurance adds $56/mo; built in 1930 — expect roof / HVAC / electrical / plumbing capex.
- Climate carrying-cost: severe flood risk — expect insurance premiums to compound above CPI over the hold.
Questions for the listing agent
- What do current leases actually rent for vs. the listed asking? Can we see a recent rent roll and the last 12 months of T-12 income?
- It's been on market 139 days. Have you received any prior offers? Is the seller open to a 23% concession, seller financing, or rate buy-down credit?
- Built in 1930 — when were the roof, HVAC, electrical panel, plumbing, and water heater last replaced?
- What's the actual annual flood-insurance premium (NFIP or private), and is the property in a SFHA with mandatory coverage?
- Why hasn't it sold? Are there any deal-killer items the seller is aware of (foundation, flood, title, zoning, code violations)?
- Is there a deadline driving the sale (1031 exchange, divorce, estate, relocation)? That informs how much negotiation room exists.
- Schools are D-rated, which usually means shorter tenancies and higher turnover. Who's the typical renter profile here, and what's been the actual vacancy rate?
- Crime grade is F in this area — have there been break-ins, vandalism, or insurance claims at this property in the last 3 years? What carrier currently insures it and at what premium?
- What's the average days-on-market for RENTAL listings here right now (not sales)? A rising rental-DOM trend means longer vacancies and softer asking-rent achievability than the comps imply.
- What's the recent tenant-quality profile in this submarket — average credit score on applications, eviction rate, late-payment / NSF rate, and stable-employment percentage? A property-management company in the area should have these aggregated.
- How much new for-sale + rental construction is in the pipeline within 1–3 miles? Heavy new supply typically softens prices + rents 12–24 months out; constrained supply supports both.
Investment metrics
- 1% rule
- 0.77% ✗
- Cap rate
- 5.57%
- Cash-on-cash
- -2.59%
- DSCR
- 0.88
- GRM
- 10.8
CMA / ARV
- ARV (median comp)
- $291,780
- List price
- $183,000
- Delta
- -37.28%
- Verdict
- UNDERPRICED
- Comps
- 20 within 1.0 mi
Show comp detail 12 sales within ~0.75 mi
| Address | Dist | Beds/Ba | Sqft | Sold | Price | $/sf | Match |
|---|---|---|---|---|---|---|---|
| 14 Coolidge Rd | 0.30mi | 3/1.5 | 1,663 (-1%) | 4mo | $300,000 | $180 | 75 |
| 7 Grant Ave | 0.49mi | 3/1.5 | 1,680 (0%) | 1mo | $210,000 | $125 | 70 |
| 44 Fairmont Ave | 0.47mi | 3/1.5 | 1,610 (-4%) | 2mo | $280,000 | $174 | 64 |
| 47 Mcclellan Ave | 0.31mi | 4/1.5 (+1) | 1,813 (+8%) | 1mo | $235,000 | $130 | 60 |
| 30 Lindbergh Ave | 0.49mi | 3/1.5 | 1,750 (+4%) | 8mo | $370,000 | $211 | 57 |
| 17 Trinity Pl | 0.55mi | 3/1.5 | 1,634 (-3%) | 12mo | $210,000 | $129 | 54 |
| 45 Coolidge Rd | 0.54mi | 3/2.0 | 1,536 (-9%) | 6mo | $289,000 | $188 | 52 |
| 35 Mcclellan Ave | 0.35mi | 3/1.0 | 1,500 (-11%) | 8mo | $180,000 | $120 | 51 |
| 27 Van Dyke Ave | 0.41mi | 3/1.5 | 1,842 (+10%) | 11mo | $375,000 | $204 | 50 |
| 16 Caroline St | 0.55mi | 3/1.5 | 1,538 (-8%) | 9mo | $100,000 | $65 | 47 |
| 10 Thomas St | 0.60mi | 4/2.0 (+1) | 1,772 (+6%) | 8mo | $110,000 | $62 | 47 |
| 27 Trinity Pl | 0.50mi | 3/1.0 | 1,480 (-12%) | 6mo | $170,000 | $115 | 44 |
Match score weights: distance 35% · size 25% · config 20% · recency 20%. Top-matched comps best support the ARV.
Projected returns pro-forma
10.0% appreciation · 3.0% rent growth · sell at horizon
- IRR
- 21.5%
- Equity multiple
- 2.74×
- Total profit
- $89,129
- Equity at exit
- $164,861
- IRR
- 19.4%
- Equity multiple
- 6.29×
- Total profit
- $270,841
- Equity at exit
- $355,529
Cash invested: $51,240 (down + closing). Projections, not guarantees.
Landlord ↔ Tenant lean methodology
- Overall (STATE)
- 15 Strongly Tenant-Friendly
- State New York
- 15 Strongly Tenant-Friendly · D+10
- County
- — inherits STATE
- City
- — inherits STATE
ZIP-level market 12010
- Home prices YoY
- 4.0%
- Active inventory
- 164
- Price-to-rent
- 10.8×
Monthly cashflow live
- Estimated rent
- $1,409 high interval (Pro) →
- Mortgage (P&I)
- −$960
- Tax from tax record
- −$188 /mo · $2,253/yr
- Insurance
- −$76
- Flood insurance flood zone
- −$56 /mo · $666/yr
- HOA
- −$0
- Vacancy / Maint / Mgmt
- −$296
- Net cashflow
- $-166
Break-even live
UW: 25.0% down · 7.5% · 30yr · 1.5% tax · 5.0% vac · 8.0% maint · 8.0% mgmt
Financing live
Cash to close
- Down payment
- $45,750
- Closing costs
- $5,490
- Reserves months
- —
- Total cash needed
- —
Loan-product check · same deal, 3 products live
Conventional
25% down · 7.5% · 30yr
- Down + closing
- —
- Monthly P&I
- —
- Monthly cashflow
- —
- DSCR
- —
- Eligible?
- —
Personal DTI + credit; lowest rate.
DSCR
20% down · 8.5% · 30yr
- Down + closing
- —
- Monthly P&I
- —
- Monthly cashflow
- —
- DSCR
- —
- Eligible?
- —
No personal income docs; deal must DSCR.
Hard money
10% down · 12.0% · 12mo
- Down + closing
- —
- Monthly P&I
- —
- Monthly cashflow
- —
- DSCR
- —
- Eligible?
- —
Short-term bridge; refi at stabilization.
Rent comps 8 comps
| Address | Beds | Baths | Sqft | Rent | $/sqft | DOM | Units | Dist |
|---|---|---|---|---|---|---|---|---|
| 62 Glen Ave Amsterdam, NY | 3.0 | 1.0 | 1115 | $1,550 | $1.39 | 23d | 1 | 0.33mi |
| 265 W Main St Unit 1 Amsterdam, NY | 3.0 | 1.0 | 1200 | $1,450 | $1.21 | 14d | 1 | 0.46mi |
| 18 Garden St Amsterdam, NY | 3.0 | 1.0 | 1180 | $1,300 | $1.10 | 19d | 1 | 0.52mi |
| 214 Market St Amsterdam, NY | 3.0 | 1.5 | 1500 | $1,300 | $0.87 | 23d | 1 | 0.53mi |
| 214 Market St Amsterdam, NY | 3.0 | 1.5 | 1500 | $1,450 | $0.97 | 43d | 1 | 0.53mi |
| 70 Wall St Amsterdam, NY | 3.0 | 1.0 | 1098 | $1,300 | $1.18 | 19d | 1 | 0.59mi |
| 49 Elizabeth St Amsterdam, NY | 3.0 | 1.0 | 1300 | $1,450 | $1.12 | 21d | 1 | 0.70mi |
| 17 Grand St Amsterdam, NY | 4.0 | 1.0 | 1098 | $1,400 | $1.28 | 23d | 1 | 0.87mi |
Listing history 25 events
-
2026-06-18days on market $183,000 Active 139 DOM
-
2026-06-17days on market $183,000 Active 138 DOM
-
2026-06-16days on market $183,000 Active 137 DOM
-
2026-06-15days on market $183,000 Active 136 DOM
-
2026-06-14days on market $183,000 Active 134 DOM
-
2026-06-13days on market $183,000 Active 133 DOM
-
2026-06-10days on market $183,000 Active 131 DOM
-
2026-06-09days on market $183,000 Active 130 DOM
-
2026-06-08days on market $183,000 Active 129 DOM
-
2026-06-07days on market $183,000 Active 128 DOM
-
2026-06-03days on market $183,000 Active 124 DOM
-
2026-06-02days on market $183,000 Active 123 DOM
-
2026-06-01days on market $183,000 Active 122 DOM
-
2026-05-31days on market $183,000 Active 121 DOM
-
2026-05-31days on market $183,000 Active 120 DOM
-
2026-01-30$183,000 Active 290-char remark
Show marketing remark (290 chars)
Welcome to 40 N Hampton Rd—a great opportunity at an excellent price point. This home offers solid value and won't last long at this price. Whether you're a first-time buyer or an investor, this is one you'll want to see quickly. Schedule your showing today—this one won't wait!
-
2016-06-17soldstatus $145,000
-
2014-11-03soldstatus $135,680
-
2014-10-31soldstatus $135,680 527-char remark
Show marketing remark (527 chars)
Must see to believe! Total remodel of everything. 3 bedroom, 3 bath, large living room, kitchen with eating area. Master bedroom and living room with Bamboo flooring. All other rooms have hardwood. Master has bath & walk-in closet. All new SS appliances. 2 other rooms can be a dining room, den, office or whatever you choose. Large deck in a secluded back yard. Washer/dryer negotiable. Cent air. Solar panel inoperable. Close to schools and shopping. Taxes without exemptions. 39.15-4-68.2 included. Excellent Condition
-
2014-07-31historical 527-char remark
Show marketing remark (527 chars)
Must see to believe! Total remodel of everything. 3 bedroom, 3 bath, large living room, kitchen with eating area. Master bedroom and living room with Bamboo flooring. All other rooms have hardwood. Master has bath & walk-in closet. All new SS appliances. 2 other rooms can be a dining room, den, office or whatever you choose. Large deck in a secluded back yard. Washer/dryer negotiable. Cent air. Solar panel inoperable. Close to schools and shopping. Taxes without exemptions. 39.15-4-68.2 included. Excellent Condition
-
2014-06-01$137,900 527-char remark
Show marketing remark (527 chars)
Must see to believe! Total remodel of everything. 3 bedroom, 3 bath, large living room, kitchen with eating area. Master bedroom and living room with Bamboo flooring. All other rooms have hardwood. Master has bath & walk-in closet. All new SS appliances. 2 other rooms can be a dining room, den, office or whatever you choose. Large deck in a secluded back yard. Washer/dryer negotiable. Cent air. Solar panel inoperable. Close to schools and shopping. Taxes without exemptions. 39.15-4-68.2 included. Excellent Condition
-
2011-03-29soldstatus $21,000
-
2011-03-23soldstatus $21,000
-
2011-02-20historical
-
2010-08-19$32,500
ⓘ Source: listings_history table (triggers on properties + properties_extension) + one-shot
backfill from property_details.listing_events for pre-trigger history.
Tax reassessment forecast NY · Partial reset (capped growth)
- Current annual tax
- $2,253 · $188/mo
- Projected year-2 tax
- $2,673 · $223/mo
- Expected delta
- +$420/yr (+$35/mo · 18.6%)
ⓘ Screening estimate from a state-policy table — verify with the county assessor before closing.
Climate risk First Street
- Flood 9/10 Extreme FEMA zone X (unshaded) · 99% chance over 30 yrs
- Wildfire 3/10 Moderate
- Heat 3/10 Moderate 7 d/yr ≥95°F today · 16 d/yr by 30 yrs out
- Wind 3/10 Moderate 4% chance of damaging wind over 30 yrs
- Air quality 1/10 Low 0 unhealthy d/yr today · 0 by 30 yrs out
Nearby sold comps map
Loading sold comps map…
Walkable amenities ~0.75 mi
Loading nearby amenities…
Taxation est. · year 1
- Rental income
- $16,911
- − Mortgage interest
- −$10,251
- − Property taxes
- −$2,253
- − Insurance
- −$1,582
- − Repairs & maintenance
- −$1,353
- − Management
- −$1,353
- − Depreciation
- −$5,324
- Taxable loss
- −$5,204
- Est. tax savings @ 24.0%
- +$1,249
- After-tax cash flow
- $-742/yr
For passive investors: Depreciation is non-cash, so a rental often shows a tax loss while cash-flowing — sheltering income. Rental losses are passive: they offset passive income freely, and up to $25,000/yr can offset ordinary (W-2) income if you actively participate and your MAGI is under $100k (phasing out to $0 by $150k); unused losses carry forward. On sale, claimed depreciation is recaptured at up to 25%, and gains may owe capital-gains tax (a 1031 exchange can defer both). Figures are a year-1 estimate at your 24.0% rate — not tax advice; consult a CPA.
Schools (NCES district)
- District
- Amsterdam City School District
- NCES district ID
- 3602970
- Math proficiency
- 35% ▲ 5.00%
- Reading proficiency
- 41% ▲ 10.00%
- Median HH income
- $41,735
- Composite
- 32.03/100
- National rank
- #5824
- State rank
- #546 of 590 in NY
Livability — Amsterdam
- Score
- 75/100
- State rank
- #247
- US rank
- #3884
Category grades
Schools grade is shown separately in the Schools card above.
Census & demographics
- Census place
- Amsterdam, NY
- City population
- 27,339
- Population (ZIP)
- 27,339
Population outlook (Montgomery County) Hauer SSP2
- Today (2025)
- 48,683 people
- By 2030
- 47,785 · -1.8%
- By 2040
- 45,492 · -6.6%
- By 2050
- 43,161 · -11.3%
- By 2075
- 38,134 · -21.7%
- By 2100
- 32,337 · -33.6%
Race, ethnicity, and origin ACS 2023
- Neighborhood character
- Predominantly White (68%)
- Race & ethnicity
- White 68% Hispanic / Latino 23% Two or more races 9% Black 4% Asian 1%
- Hispanic origin (detail)
- Mexican 2% Puerto Rican 18%
- Common ancestry
- Romanian 12% Lithuanian 2% Iranian 2%
- Foreign-born
- 5% · Canada
- Languages at home
- 86% English-only · Spanish 11% Russian/Polish/Slavic 1% Other Indo-European 1%
Political lean MEDSL · Montgomery
- 2024 margin
- Strong R (+28.7) · D 35.6% · R 64.4%
- 2008→2024 swing
- -20.6pp toward R · 2008: -8.1pp · 2024: -28.7pp
- All cycles
- 2024: R+28.7 2020: R+22.6 2016: R+26.5 2012: R+4.4 2008: R+8.1
Not yet ingested
- Civics
- —
Market trends
- HPI YoY
- ▲ 12.12%
- Current HPI
- 312.4966
- Rent YoY
- —
- Metro
- —
- State GDP YoY
- ▲ 2.60%
- F500 in state
- 92
Industry mix (Fortune 500 HQ in NY)
| Industry | F500 HQs | Revenue |
|---|---|---|
| Financial Services | 10 | $950B |
|
||
| Consumer Goods | 9 | $162B |
|
||
| Insurance | 4 | $225B |
|
||
| Telecommunications | 2 | $144B |
|
||
| Pharmaceuticals | 2 | $112B |
|
||
| Media / Entertainment | 2 | $69B |
|
||
Price history
+463.1% since first listed10 events — show timeline
- 2026-01-30 Listed $183,000 Global MLS
- 2016-06-17 Sold (Public Records) $145,000 Public Records
- 2014-11-03 Sold (Public Records) $135,680 Public Records
- 2014-10-31 Sold (MLS) $135,680 Global MLS
- 2014-07-31 Listing Removed — Global MLS
- 2014-06-01 Listed $137,900 Global MLS
- 2011-03-29 Sold (Public Records) $21,000 Public Records
- 2011-03-23 Sold (MLS) $21,000 Global MLS
- 2011-02-20 Listing Removed — Global MLS
- 2010-08-19 Listed $32,500 Global MLS
Property tax history
+4.3%/yrLatest (2025): $2,253 · -5.4% YoY. Source: county tax records.
Cash-flow waterfall
monthlySold comps — $/sqft
last 12 mo · ≤1 miLoading sold comps…