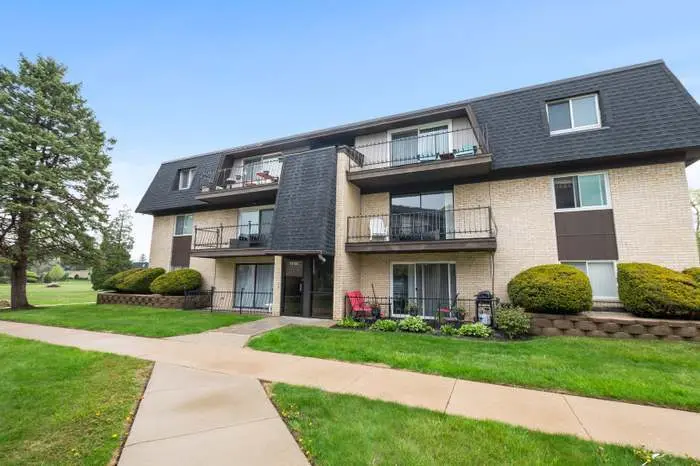
11123 S 84th Ave Unit 2B · Palos Hills, IL
Flood risk 5/10 · Moderate
- FEMA flood zone
- X (unshaded)
- Chance of flooding over 30 yrs
- 0.24%
- Est. flood insurance / yr
- $507 – $1,088
Fire risk 1/10 · Minimal
- Est. fire insurance / yr
- $804 – $1,492
Heat risk 3/10 · Minor
- Hot days now (above 101°F)
- 7 days/yr
- Hot days in 30 yrs
- 15 days/yr
Wind risk 2/10 · Minimal
- Chance of severe wind over 30 yrs
- —
Air-quality risk 3/10 · Minor
- Unhealthy air days now
- 4 days/yr
- Unhealthy air days in 30 yrs
- 4 days/yr
Risk factors via First Street. Map © Google.
Why this score? — see what drove the D grade
The composite is a weighted blend of 9 inputs, each scored 0–100. Each bar is that input's sub-score; the figure is the points it added to the 100-point composite (weight × sub-score).
- Cash flow +13.1/30.0
- ARV discount +7.5/15.0
- 1% rule +5.5/10.0
- Livability +4.0/5.0
- DSCR +3.9/10.0
- Schools +3.4/10.0
- Rent growth +2.5/5.0
- Condition / age +2.5/5.0
- Appreciation +0.0/10.0
$184,900
🖨 Deal sheet 📄 Offer letter ✓ Due diligence
Listing remarks MLS
Welcome to this freshly painted 2-bedroom, 1-bath condo located on the second floor in a well-maintained Palos Hills subdivision with a pool. Enjoy central air, a private balcony, and a spacious kitchen with ample cabinet space and a cozy breakfast nook. Private storage and shared laundry are conveniently located in the building. Surrounded by forest preserves and just minutes from shopping, dining, and local amenities-this home offers comfort and convenience in a peaceful setting
Key facts
- Cozy breakfast nook
- Private balcony
- Spacious kitchen
Tags
Property features AI
Finance
- Other: Part of a building with 6 units; Parcel number available
- Financial info: Homeowner tax exemption
- HOA & community: Monthly association fee of $325 covering heat, water, and gas; Pets not allowed
Exterior
- Parking: One parking space (total)
- Utilities: Lake Michigan water; Public sewer
- Home design: Attached single (condo); Condo ownership; Entry level: 2; Estimated living area; Facing/other orientation not specified
- Construction: Brick construction; Built 41-50 years ago; Built before 1978
- Exterior features: Common lot; School bus service
Interior
- Kitchen: Kitchen (main level, 14 x 11)
- Bedrooms: Master bedroom (main level, 14 x 11); Bedroom (main level, 11 x 10); Two additional bedrooms listed
- Bathrooms: One full bathroom
- Heating & cooling: Natural gas heating; Central air conditioning
- Interior features: Four total rooms; Dining room; Family room; Living room (main level, 17 x 14)
- Laundry & utility: Laundry room
Neighborhood map
What this means for you Summary
Snapshot
- This is a 2-bed/1.0-bath condo listed at $185k.
Deal economics
- At list price, monthly cash flow is $-5 ($-61/yr) — negative.
- To cash-flow at today's rent, offer at most $184k (0.5% below list).
- Meets the 1% rule at list price ($2k rent vs $185k).
- Recommended offer: $184k (0.5% below list) — sets the bar for cash-flow.
- Cap rate 6.3% vs local median 4.1% in Palos Hills — top-decile yield for the area; either an underpriced asset or a hidden risk that comps aren't pricing in. Stress-test before assuming the spread holds.
Location & tenants
- Location reads 79/100 on livability (#121 in IL, #2,109 nationally) — a middle-class / working-renter tenant base. Strengths: crime A+, commute A+, housing A+; Watch: amenities F, health & safety F.
- Cons Hsd 230 (suburban): math 35% / reading 39% proficiency, ranked #146 of 620 in IL (top 24%) — families likely to look elsewhere, expect single-tenant / working-renter base with shorter leases.
- Market conditions: 53 active listings in the ZIP; 5 comparable units currently listed for rent nearby; rentals at typical pace (median 24d on market — plan ~3-4 weeks tenant-placement turnaround); solid renter incomes; 6,272 units permitted in Cook County in 2024 (4,658 in 5+ unit buildings).
Forward outlook
- Local home prices are declining (-3.0%/yr); year-one equity from $1k of loan paydown is wiped out by about $6k of value loss. Plan a longer hold.
Negotiation context
- Only 3 days on market — expect competitive offers; lowballing is unlikely to land.
- 2 sale attempts since 17y ago; this cycle's ask is 12% above the opening price — seller raised mid-cycle; expect resistance to lowballs.
Risks & watch-outs
- Climate carrying-cost: moderate flood risk — expect insurance premiums to compound above CPI over the hold.
Questions for the listing agent
- What do current leases actually rent for vs. the listed asking? Can we see a recent rent roll and the last 12 months of T-12 income?
- Built in 1977 — when were the roof, HVAC, electrical panel, plumbing, and water heater last replaced?
- What does the HOA fee cover, when was the last increase, and are there any pending special assessments or reserve-fund shortfalls?
- Any open or pending special assessments — roof, HVAC, plumbing, elevator, façade? What's the per-unit balance and payoff schedule, and is the seller paying it off at close or rolling it to the buyer?
- Is there a deadline driving the sale (1031 exchange, divorce, estate, relocation)? That informs how much negotiation room exists.
- Schools are B-rated — typically a magnet for longer-tenancy family renters. What's the average tenant stay here, and is there a school-zone premium baked into asking?
- The area grade is low — what's the realistic commute time and amenity access for the typical tenant pool here? Any planned neighborhood developments (good or bad) we should know about?
- What's the average days-on-market for RENTAL listings here right now (not sales)? A rising rental-DOM trend means longer vacancies and softer asking-rent achievability than the comps imply.
- What's the recent tenant-quality profile in this submarket — average credit score on applications, eviction rate, late-payment / NSF rate, and stable-employment percentage? A property-management company in the area should have these aggregated.
- How much new apartment / multifamily construction is in the pipeline within 1–3 miles? Heavy new supply (>2% of stock underway) typically softens rents 12–24 months out; light construction supports rent growth.
Investment metrics
- 1% rule
- 1.05% ✓
- Cap rate
- 6.26%
- Cash-on-cash
- -0.12%
- DSCR
- 0.99
- GRM
- 7.9
CMA / ARV
No comps found within radius.
Projected returns pro-forma
-3.0% appreciation · 3.0% rent growth · sell at horizon
- IRR
- -16.4%
- Equity multiple
- 0.42×
- Total profit
- $-30,095
- Equity at exit
- $27,569
- IRR
- -7.9%
- Equity multiple
- 0.50×
- Total profit
- $-25,851
- Equity at exit
- $15,987
Cash invested: $51,772 (down + closing). Projections, not guarantees.
Landlord ↔ Tenant lean methodology
- Overall (STATE)
- 43 Moderately Tenant-Leaning
- State Illinois
- 43 Moderately Tenant-Leaning · D+7
- County
- — inherits STATE
- City
- — inherits STATE
ZIP-level market 60465
- Active inventory
- 53
- Price-to-rent
- 7.9×
Monthly cashflow live
- Estimated rent
- $1,942 high interval (Pro) →
- Mortgage (P&I)
- −$970
- Tax from tax record
- −$168 /mo · $2,013/yr
- Insurance
- −$77
- HOA
- −$325
- Vacancy / Maint / Mgmt
- −$408
- Net cashflow
- $-5
Break-even live
UW: 25.0% down · 7.5% · 30yr · 1.5% tax · 5.0% vac · 8.0% maint · 8.0% mgmt
Financing live
Cash to close
- Down payment
- $46,225
- Closing costs
- $5,547
- Reserves months
- —
- Total cash needed
- —
Loan-product check · same deal, 3 products live
Conventional
25% down · 7.5% · 30yr
- Down + closing
- —
- Monthly P&I
- —
- Monthly cashflow
- —
- DSCR
- —
- Eligible?
- —
Personal DTI + credit; lowest rate.
DSCR
20% down · 8.5% · 30yr
- Down + closing
- —
- Monthly P&I
- —
- Monthly cashflow
- —
- DSCR
- —
- Eligible?
- —
No personal income docs; deal must DSCR.
Hard money
10% down · 12.0% · 12mo
- Down + closing
- —
- Monthly P&I
- —
- Monthly cashflow
- —
- DSCR
- —
- Eligible?
- —
Short-term bridge; refi at stabilization.
Rent comps 5 comps
| Address | Beds | Baths | Sqft | Rent | $/sqft | DOM | Units | Dist |
|---|---|---|---|---|---|---|---|---|
| 11180 Moraine Dr Palos Hills, IL | 2.0 | 1.0 | 800 | $1,700 | $2.12 | 24d | 1 | 0.42mi |
| 11225 S Kean Ave Unit 1A Palos Hills, IL | 3.0 | 2.0 | 1400 | $2,850 | $2.04 | 24d | 1 | 1.12mi |
| 10604 S Oak Tree Dr Worth, IL | 2.0 | 1.0 | 800 | $1,450 | $1.81 | 24d | 1 | 1.40mi |
| 7121 W 110th St Unit 2W Worth, IL | 2.0 | 1.0 | 900 | $1,550 | $1.72 | 14d | 1 | 1.46mi |
| 11920 S 74th Ave Palos Heights, IL | 3.0 | 1.0 | 950 | $3,100 | $3.26 | 1d | 1 | 1.47mi |
HOA detail condo
- Monthly dues
- $325 · $3,900/yr
- Likely covers
- pool
- Assessments
- None detected in remarks — confirm with the listing agent.
Listing history 2 events
-
2026-06-18remarks 688-char remark
-
2026-06-18$184,900 Active 3 DOM
ⓘ Source: listings_history table (triggers on properties + properties_extension) + one-shot
backfill from property_details.listing_events for pre-trigger history.
Tax reassessment forecast IL · Partial reset (capped growth)
- Current annual tax
- $2,013 · $168/mo
- Projected year-2 tax
- $3,105 · $259/mo
- Expected delta
- +$1,092/yr (+$91/mo · 54.3%)
ⓘ Screening estimate from a state-policy table — verify with the county assessor before closing.
Climate risk First Street
- Flood 5/10 Major FEMA zone X (unshaded) · 24% chance over 30 yrs
- Wildfire 1/10 Low
- Heat 3/10 Moderate 7 d/yr ≥101°F today · 15 d/yr by 30 yrs out
- Wind 2/10 Low
- Air quality 3/10 Moderate 4 unhealthy d/yr today · 4 by 30 yrs out
Nearby sold comps map
Loading sold comps map…
Walkable amenities ~0.75 mi
Loading nearby amenities…
Taxation est. · year 1
- Rental income
- $23,306
- − Mortgage interest
- −$10,357
- − Property taxes
- −$2,013
- − Insurance
- −$924
- − Repairs & maintenance
- −$1,864
- − Management
- −$1,864
- − HOA
- −$3,900
- − Depreciation
- −$5,379
- Taxable loss
- −$2,996
- Est. tax savings @ 24.0%
- +$719
- After-tax cash flow
- $658/yr
For passive investors: Depreciation is non-cash, so a rental often shows a tax loss while cash-flowing — sheltering income. Rental losses are passive: they offset passive income freely, and up to $25,000/yr can offset ordinary (W-2) income if you actively participate and your MAGI is under $100k (phasing out to $0 by $150k); unused losses carry forward. On sale, claimed depreciation is recaptured at up to 25%, and gains may owe capital-gains tax (a 1031 exchange can defer both). Figures are a year-1 estimate at your 24.0% rate — not tax advice; consult a CPA.
Schools (NCES district)
- District
- Cons Hsd 230
- NCES district ID
- 1708400
- Math proficiency
- 35% ▼ -8.00%
- Reading proficiency
- 39% ▼ -6.00%
- Median HH income
- $73,953
- Composite
- 34.29/100
- National rank
- #5244
- State rank
- #146 of 620 in IL
Livability — Palos Hills
- Score
- 79/100
- State rank
- #121
- US rank
- #2109
Category grades
Schools grade is shown separately in the Schools card above.
Census & demographics
- Census place
- Palos Hills, IL
- County
- Cook County · 4,486,803 people
- City population
- 18,081
- Metro
- Chicago-Naperville-Elgin, IL-IN-WI
- Population (ZIP)
- 18,081
- Household income
- $83,533
- Rent vs Own
- Severe rent burden
- 472.0
Population outlook (Cook County) Hauer SSP2
- Today (2025)
- 5,347,519 people
- By 2030
- 5,357,703 · +0.2%
- By 2040
- 5,324,924 · -0.4%
- By 2050
- 5,230,762 · -2.2%
- By 2075
- 4,785,735 · -10.5%
- By 2100
- 4,188,836 · -21.7%
Race, ethnicity, and origin ACS 2023
- Neighborhood character
- Predominantly White (81%)
- Race & ethnicity
- White 81% Hispanic / Latino 11% Black 5% Two or more races 5% Asian 2%
- Hispanic origin (detail)
- Mexican 7% Puerto Rican 1%
- Common ancestry
- Romanian 31% Armenian 2% Iranian 2%
- Foreign-born
- 27% · Canada
- Languages at home
- 58% English-only · Russian/Polish/Slavic 22% Other Indo-European 7% Arabic 7%
Political lean MEDSL · Cook
- 2024 margin
- Solid D (+42.0) · D 70.4% · R 28.4% · Other 1.2%
- 2008→2024 swing
- -11.4pp toward R · 2008: 53.4pp · 2024: 42.0pp
- All cycles
- 2024: D+42.0 2020: D+50.3 2016: D+53.0 2012: D+49.4 2008: D+53.4
Not yet ingested
- Civics
- —
Market trends
- HPI YoY
- ▼ -133.08%
- Current HPI
- 179.8906
- Rent YoY
- —
- Metro
- Chicago-Naperville-Elgin, IL-IN-WI
- State GDP YoY
- ▲ 1.59%
- F500 in state
- 60
Industry mix (Fortune 500 HQ in IL)
| Industry | F500 HQs | Revenue |
|---|---|---|
| Insurance | 4 | $201B |
|
||
| Consumer Goods | 4 | $87B |
|
||
| Industrial Machinery | 3 | $64B |
|
||
| Healthcare | 2 | $55B |
|
||
| Retail / Pharmacy | 1 | $148B |
|
||
| Agriculture / Food | 1 | $86B |
|
||
Price history
+166.1% since first listed15 events — show timeline
- 2025-06-27 Sold (Public Records) $165,000 Public Records
- 2025-06-16 Sold (MLS) $165,000 MRED as Distributed by MLS Grid
- 2025-05-07 Contingent — MRED as Distributed by MLS Grid
- 2025-05-02 Listed $165,000 MRED as Distributed by MLS Grid
- 2009-12-22 Sold (MLS) $78,500 MRED as Distributed by MLS Grid
- 2009-10-28 Pending — MRED as Distributed by MLS Grid
- 2009-10-14 Listing Removed — MRED as Distributed by MLS Grid
- 2009-10-02 Price Changed $74,900 MRED as Distributed by MLS Grid
- 2009-07-01 Price Changed $89,900 MRED as Distributed by MLS Grid
- 2009-05-29 Listed $99,900 MRED as Distributed by MLS Grid
- 2005-05-09 Sold (Public Records) $130,000 Public Records
- 2003-05-13 Sold (Public Records) $107,000 Public Records
- 2000-02-16 Sold (Public Records) $77,000 Public Records
- 1992-08-20 Sold (Public Records) $72,000 Public Records
- 1989-11-20 Sold (Public Records) $62,000 Public Records
Property tax history
+0.7%/yrLatest (2023): $2,013 · +60.8% YoY. Source: county tax records.
Cash-flow waterfall
monthlySold comps — $/sqft
last 12 mo · ≤1 miLoading sold comps…