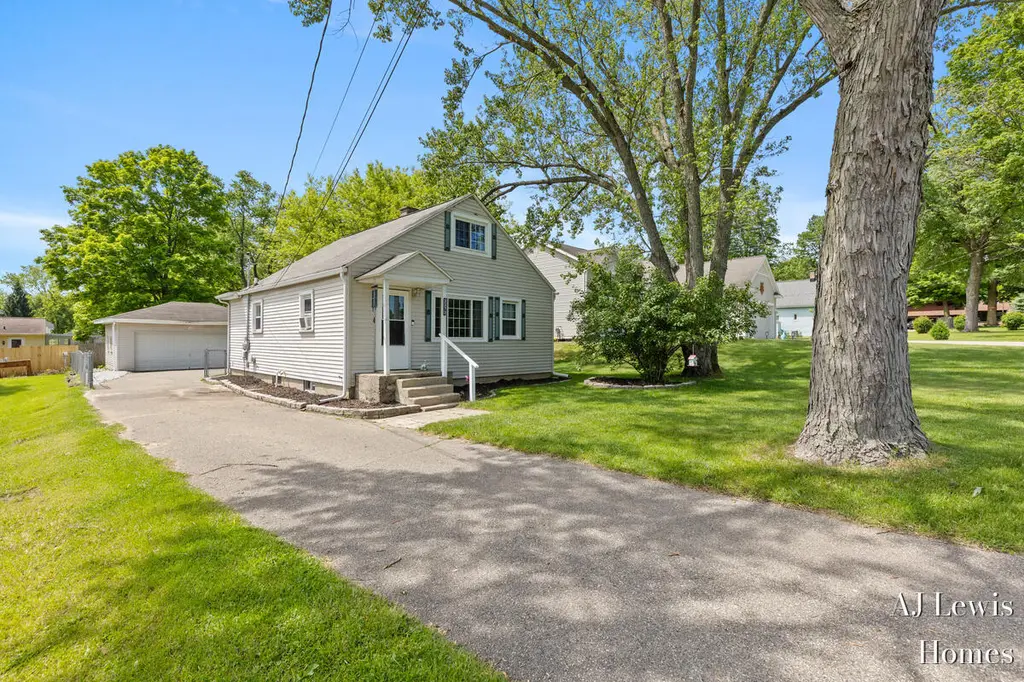
3370 Milo St NW · Walker, MI
Flood risk 1/10 · Minimal
- FEMA flood zone
- X (unshaded)
- Chance of flooding over 30 yrs
- 0.0%
- Est. flood insurance / yr
- $473 – $860
Fire risk 1/10 · Minimal
- Est. fire insurance / yr
- $784 – $1,456
Heat risk 2/10 · Minimal
- Hot days now (above 96°F)
- 7 days/yr
- Hot days in 30 yrs
- 16 days/yr
Wind risk 2/10 · Minimal
- Chance of severe wind over 30 yrs
- —
Air-quality risk 2/10 · Minimal
- Unhealthy air days now
- 2 days/yr
- Unhealthy air days in 30 yrs
- 2 days/yr
Risk factors via First Street. Map © Google.
Why this score? — see what drove the C grade
The composite is a weighted blend of 9 inputs, each scored 0–100. Each bar is that input's sub-score; the figure is the points it added to the 100-point composite (weight × sub-score).
- Cash flow +18.9/30.0
- ARV discount +12.2/15.0
- DSCR +6.0/10.0
- Rent growth +4.5/5.0
- 1% rule +4.3/10.0
- Livability +3.7/5.0
- Schools +3.4/10.0
- Condition / age +2.5/5.0
- Appreciation +0.0/10.0
$229,900
🖨 Deal sheet 📄 Offer letter ✓ Due diligence
Listing remarks MLS
Discover an affordable opportunity in the desirable Kenowa Hills School district. The main floor features a comfortable living room, two bedrooms, and a full bath, while the remodeled kitchen flows into a dining area with a door that opens to the back deck--perfect for easy indoor-outdoor meals. Upstairs, a third bedroom offers privacy for a guest room, office, or creative space. The basement already includes a fireplace and simply awaits flooring to become an inviting family room or rec area. Outside, a two-stall garage provides ample storage, and the fully fenced yard is ready for pets, play, and summer gatherings. Set in a convenient west-side location near local favorites such as Sobie's Meats, Walker Roadhouse, Alfano's, ice-cream spots, and the trails of Blandford Nature Center, this home delivers everyday ease with sought-after schools. Act quickly as the Seller instructs listing broker to hold all offers until Tuesday June 2nd 2026 10 am. TLFA estimated
Key facts
- Remodeled kitchen
- Back deck
- Two-stall garage
Tags
Property features AI
Exterior
- Parking: Detached 2-car garage
- Utilities: Public water; Natural gas available and connected; Electricity available; High-speed internet
- Home design: Single family residence; Traditional style; Residential property
- Construction: Built in 1956; Vinyl siding; Shingle roof
- Exterior features: Paved road access; Lot about 0.13 acres
Interior
- Kitchen: Dishwasher; Microwave; Range; Refrigerator; Eat-in kitchen with pantry
- Bedrooms: Primary bedroom; Bedroom 2; Bedroom 3
- Bathrooms: 1 full bathroom
- Heating & cooling: Forced air heating
- Interior features: Eat-in kitchen; Pantry; Fireplace; Full basement; 7 total rooms
- Laundry & utility: Washer; Dryer; Laundry room
Neighborhood map
What this means for you Summary
Snapshot
- This is a 3-bed/1.0-bath single-family listed at $230k.
Deal economics
- At list price, monthly cash flow is $236 ($3k/yr) — positive.
- The deal already cash-flows at list — no discount required.
- To meet the 1% rule (rent ≥ 1% of price), the offer needs to be $214k (7.1% below list).
- Recommended offer: $214k (7.1% below list) — sets the bar for 1% rule.
- Cap rate 7.5% vs local median 4.1% in Walker — top-decile yield for the area; either an underpriced asset or a hidden risk that comps aren't pricing in. Stress-test before assuming the spread holds.
Location & tenants
- Location reads 74/100 on livability (#188 in MI, #4,765 nationally) — a middle-class / working-renter tenant base. Strengths: cost of living A+, housing A+, employment B+; Watch: amenities F, health & safety F.
- Kenowa Hills Public Schools (suburban): math 33% / reading 46% proficiency, ranked #205 of 540 in MI (top 38%) — families likely to look elsewhere, expect single-tenant / working-renter base with shorter leases.
- Market conditions: Rents rising fast (+7.9%/yr); 111 active listings in the ZIP; 1 comparable units currently listed for rent nearby; solid renter incomes; 2,253 units permitted in Kent County in 2024 (969 in 5+ unit buildings).
- This rent runs 31% of the median local income ($82k/yr) — at the standard rent-burdened threshold; future hikes will face affordability resistance.
Forward outlook
- Local home prices are declining (-3.0%/yr); year-one equity from $2k of loan paydown is wiped out by about $7k of value loss. Plan a longer hold.
- Kent County population projected at +22% by 2050 — long-run rental-demand tailwind backs the buy-and-hold thesis.
- At projected returns (-3.0% appreciation + 7.9% rent growth), your $64k cash investment doubles in ~10 years — after that, you're playing with house money.
Negotiation context
- Only 5 days on market — expect competitive offers; lowballing is unlikely to land.
- 14 sale attempts since 33y ago with the ask held roughly flat each time — persistent listings suggest the price (not the market) is what's stuck; bring a comps-based counter.
- Current owner paid $146k; list at $230k implies a 57% gain — meaningful room to come down on a strong offer.
Risks & watch-outs
- Watch-outs: built in 1956 — expect roof / HVAC / electrical / plumbing capex.
Questions for the listing agent
- Built in 1956 — when were the roof, HVAC, electrical panel, plumbing, and water heater last replaced?
- Is there a deadline driving the sale (1031 exchange, divorce, estate, relocation)? That informs how much negotiation room exists.
- What's the average days-on-market for RENTAL listings here right now (not sales)? A rising rental-DOM trend means longer vacancies and softer asking-rent achievability than the comps imply.
- What's the recent tenant-quality profile in this submarket — average credit score on applications, eviction rate, late-payment / NSF rate, and stable-employment percentage? A property-management company in the area should have these aggregated.
- How much new for-sale + rental construction is in the pipeline within 1–3 miles? Heavy new supply typically softens prices + rents 12–24 months out; constrained supply supports both.
Investment metrics
- 1% rule
- 0.93% ✗
- Cap rate
- 7.53%
- Cash-on-cash
- 4.40%
- DSCR
- 1.20
- GRM
- 9.0
CMA / ARV
- ARV (on-the-fly)
- $256,824
- Comps found
- 4
Show comp detail 4 sales within ~0.75 mi
| Address | Dist | Beds/Ba | Sqft | Sold | Price | $/sf | Match |
|---|---|---|---|---|---|---|---|
| 1585 Marlin Ave NW | 0.01mi | 3/1.0 | 1,014 (+3%) | 13mo | $265,000 | $261 | 83 |
| 1421 Benning Ave NW | 0.30mi | 3/1.0 | 1,051 (+7%) | 8mo | $253,000 | $241 | 68 |
| 1124 Kusterer Dr NW | 0.54mi | 2/1.0 (-1) | 907 (-8%) | 10mo | $198,000 | $218 | 48 |
| 3232 Rypens Dr NW | 0.31mi | 2/1.0 (-1) | 840 (-15%) | 17mo | $237,000 | $282 | 42 |
Match score weights: distance 35% · size 25% · config 20% · recency 20%. Top-matched comps best support the ARV.
Projected returns pro-forma
-3.0% appreciation · 7.87% rent growth · sell at horizon
- IRR
- -4.5%
- Equity multiple
- 0.82×
- Total profit
- $-11,283
- Equity at exit
- $34,279
- IRR
- 9.8%
- Equity multiple
- 1.92×
- Total profit
- $59,158
- Equity at exit
- $19,878
Cash invested: $64,372 (down + closing). Projections, not guarantees.
Landlord ↔ Tenant lean methodology
- Overall (STATE)
- 62 Landlord-Friendly
- State Michigan
- 62 Landlord-Friendly · EVEN
- County
- — inherits STATE
- City
- — inherits STATE
ZIP-level market 49534
- Home prices YoY
- -28.4%
- Rents YoY
- 7.9%
- Active inventory
- 111
- Price-to-rent
- 9.0×
Monthly cashflow live
- Estimated rent
- $2,135 medium interval (Pro) →
- Mortgage (P&I)
- −$1,206
- Tax from tax record
- −$149 /mo · $1,790/yr
- Insurance
- −$96
- HOA
- −$0
- Vacancy / Maint / Mgmt
- −$448
- Net cashflow
- $236
Break-even live
UW: 25.0% down · 7.5% · 30yr · 1.5% tax · 5.0% vac · 8.0% maint · 8.0% mgmt
Financing live
Cash to close
- Down payment
- $57,475
- Closing costs
- $6,897
- Reserves months
- —
- Total cash needed
- —
Loan-product check · same deal, 3 products live
Conventional
25% down · 7.5% · 30yr
- Down + closing
- —
- Monthly P&I
- —
- Monthly cashflow
- —
- DSCR
- —
- Eligible?
- —
Personal DTI + credit; lowest rate.
DSCR
20% down · 8.5% · 30yr
- Down + closing
- —
- Monthly P&I
- —
- Monthly cashflow
- —
- DSCR
- —
- Eligible?
- —
No personal income docs; deal must DSCR.
Hard money
10% down · 12.0% · 12mo
- Down + closing
- —
- Monthly P&I
- —
- Monthly cashflow
- —
- DSCR
- —
- Eligible?
- —
Short-term bridge; refi at stabilization.
Rent comps 1 comps
| Address | Beds | Baths | Sqft | Rent | $/sqft | DOM | Units | Dist |
|---|---|---|---|---|---|---|---|---|
| 511 Hampton Ln NW Walker, MI | 1.0–2.0 | 1.0 | 763 | $1,519 | $1.99 | 2d | 5 | 1.48mi |
Listing history 33 events
-
2026-06-03statusdays on market $229,900 Pending 5 DOM
-
2026-06-01days on market $229,900 Active 4 DOM
-
2026-05-31days on market $229,900 Active 3 DOM
-
2026-05-28$229,900 Active 975-char remark
Show marketing remark (975 chars)
Discover an affordable opportunity in the desirable Kenowa Hills School district. The main floor features a comfortable living room, two bedrooms, and a full bath, while the remodeled kitchen flows into a dining area with a door that opens to the back deck--perfect for easy indoor-outdoor meals. Upstairs, a third bedroom offers privacy for a guest room, office, or creative space. The basement already includes a fireplace and simply awaits flooring to become an inviting family room or rec area. Outside, a two-stall garage provides ample storage, and the fully fenced yard is ready for pets, play, and summer gatherings. Set in a convenient west-side location near local favorites such as Sobie's Meats, Walker Roadhouse, Alfano's, ice-cream spots, and the trails of Blandford Nature Center, this home delivers everyday ease with sought-after schools. Act quickly as the Seller instructs listing broker to hold all offers until Tuesday June 2nd 2026 10 am. TLFA estimated
-
2026-05-28$229,900 Active
Show marketing remark (975 chars)
Discover an affordable opportunity in the desirable Kenowa Hills School district. The main floor features a comfortable living room, two bedrooms, and a full bath, while the remodeled kitchen flows into a dining area with a door that opens to the back deck--perfect for easy indoor-outdoor meals. Upstairs, a third bedroom offers privacy for a guest room, office, or creative space. The basement already includes a fireplace and simply awaits flooring to become an inviting family room or rec area. Outside, a two-stall garage provides ample storage, and the fully fenced yard is ready for pets, play, and summer gatherings. Set in a convenient west-side location near local favorites such as Sobie's Meats, Walker Roadhouse, Alfano's, ice-cream spots, and the trails of Blandford Nature Center, this home delivers everyday ease with sought-after schools. Act quickly as the Seller instructs listing broker to hold all offers until Tuesday June 2nd 2026 10 am. TLFA estimated
-
2020-01-13soldstatus $146,500
-
2020-01-06soldstatus $146,500
-
2020-01-06soldstatus $146,500 Sold
-
2020-01-06soldstatus $146,500
-
2019-12-06status Pending
-
2019-12-04$139,900
-
2019-12-04$139,900 Active
-
2019-12-04$139,900
-
2015-07-22soldstatus $110,000
-
2015-07-17soldstatus $110,000
-
2015-07-17soldstatus $110,000
-
2015-06-04$104,900
-
2015-06-04$104,900
-
2015-01-09historical
-
2013-10-25soldstatus $69,000
-
2010-04-29soldstatus $67,000
-
2010-04-23soldstatus $67,000
-
2010-04-23soldstatus $67,000
-
2009-10-06$79,900
-
2009-10-06$79,900
-
2008-09-30historical
-
2008-06-11$133,000
-
2008-06-11$133,000
-
1993-10-15soldstatus $42,000
-
1993-10-15soldstatus $42,000
-
1993-08-13$40,150
-
1993-08-13$40,150
ⓘ Source: listings_history table (triggers on properties + properties_extension) + one-shot
backfill from property_details.listing_events for pre-trigger history.
Tax reassessment forecast MI · Partial reset (capped growth)
- Current annual tax
- $1,790 · $149/mo
- Projected year-2 tax
- $2,665 · $222/mo
- Expected delta
- +$875/yr (+$73/mo · 48.9%)
ⓘ Screening estimate from a state-policy table — verify with the county assessor before closing.
Climate risk First Street
- Flood 1/10 Low FEMA zone X (unshaded) · 0% chance over 30 yrs
- Wildfire 1/10 Low
- Heat 2/10 Low 7 d/yr ≥96°F today · 16 d/yr by 30 yrs out
- Wind 2/10 Low
- Air quality 2/10 Low 2 unhealthy d/yr today · 2 by 30 yrs out
Nearby sold comps map
Loading sold comps map…
Walkable amenities ~0.75 mi
Loading nearby amenities…
Taxation est. · year 1
- Rental income
- $25,623
- − Mortgage interest
- −$12,878
- − Property taxes
- −$1,790
- − Insurance
- −$1,150
- − Repairs & maintenance
- −$2,050
- − Management
- −$2,050
- − Depreciation
- −$6,688
- Taxable loss
- −$982
- Est. tax savings @ 24.0%
- +$236
- After-tax cash flow
- $3,071/yr
For passive investors: Depreciation is non-cash, so a rental often shows a tax loss while cash-flowing — sheltering income. Rental losses are passive: they offset passive income freely, and up to $25,000/yr can offset ordinary (W-2) income if you actively participate and your MAGI is under $100k (phasing out to $0 by $150k); unused losses carry forward. On sale, claimed depreciation is recaptured at up to 25%, and gains may owe capital-gains tax (a 1031 exchange can defer both). Figures are a year-1 estimate at your 24.0% rate — not tax advice; consult a CPA.
Schools (NCES district)
- District
- Kenowa Hills Public Schools
- NCES district ID
- 2620280
- Math proficiency
- 33% ▬ 0.00%
- Reading proficiency
- 46% ▼ -6.00%
- Median HH income
- $53,387
- Composite
- 34.36/100
- National rank
- #5221
- State rank
- #205 of 540 in MI
Livability — Walker
- Score
- 74/100
- State rank
- #188
- US rank
- #4765
Category grades
Schools grade is shown separately in the Schools card above.
Census & demographics
- Census place
- Walker, MI
- County
- Kent County · 533,805 people
- City population
- 33,350
- Metro
- Grand Rapids-Kentwood, MI
- Population (ZIP)
- 23,719
- Household income
- $81,657
- Rent vs Own
- Severe rent burden
- 415.0
Population outlook (Kent County) Hauer SSP2
- Today (2025)
- 712,484 people
- By 2030
- 748,618 · +5.1%
- By 2040
- 814,777 · +14.4%
- By 2050
- 868,556 · +21.9%
- By 2075
- 966,487 · +35.7%
- By 2100
- 967,975 · +35.9%
Race, ethnicity, and origin ACS 2023
- Neighborhood character
- Predominantly White (87%)
- Race & ethnicity
- White 87% Two or more races 5% Hispanic / Latino 4% Black 2% Asian 2%
- Common ancestry
- Iranian 20% Romanian 12% Lithuanian 2%
- Foreign-born
- 4% · Canada, China
- Languages at home
- 95% English-only · Spanish 1% Other Indo-European 1% Tagalog/Filipino 1%
Political lean MEDSL · Kent
- 2024 margin
- Lean D (+5.4) · D 51.8% · R 46.5% · Other 1.7%
- 2008→2024 swing
- +4.8pp toward D · 2008: 0.5pp · 2024: 5.4pp
- All cycles
- 2024: D+5.4 2020: D+6.1 2016: R+3.1 2012: R+7.9 2008: D+0.5
Not yet ingested
- Civics
- —
Market trends
- HPI YoY
- ▼ -107.59%
- Current HPI
- 270.866
- Rent YoY
- ▲ 7.87%
- Metro
- Grand Rapids-Kentwood, MI
- State GDP YoY
- ▲ 1.37%
- F500 in state
- 28
Industry mix (Fortune 500 HQ in MI)
| Industry | F500 HQs | Revenue |
|---|---|---|
| Automotive Parts | 3 | $48B |
|
||
| Automotive | 2 | $372B |
|
||
| Chemicals | 1 | $45B |
|
||
| Automotive Retail | 1 | $29B |
|
||
| Healthcare / Medical Devices | 1 | $23B |
|
||
| Automotive Technology | 1 | $20B |
|
||
Price history
+472.6% since first listed30 events — show timeline
- 2026-05-28 Listed $229,900 REALCOMP
- 2026-05-28 Listed $229,900 SW Michigan MLS
- 2026-05-28 Listed $229,900 MiRealSource-MiMLS
- 2020-01-13 Sold (Public Records) $146,500 Public Records
- 2020-01-06 Sold (MLS) $146,500 MiRealSource-MiMLS
- 2020-01-06 Sold (MLS) $146,500 SW Michigan MLS
- 2020-01-06 Sold (MLS) $146,500 REALCOMP
- 2019-12-06 Pending — SW Michigan MLS
- 2019-12-04 Listed $139,900 MiRealSource-MiMLS
- 2019-12-04 Listed $139,900 SW Michigan MLS
- 2019-12-04 Listed $139,900 REALCOMP
- 2015-07-22 Sold (Public Records) $110,000 Public Records
- 2015-07-17 Sold (MLS) $110,000 SW Michigan MLS
- 2015-07-17 Sold (MLS) $110,000 REALCOMP
- 2015-06-04 Listed $104,900 SW Michigan MLS
- 2015-06-04 Listed $104,900 REALCOMP
- 2015-01-09 Listing Removed — SW Michigan MLS
- 2013-10-25 Sold (Public Records) $69,000 Public Records
- 2010-04-29 Sold (Public Records) $67,000 Public Records
- 2010-04-23 Sold (MLS) $67,000 REALCOMP
- 2010-04-23 Sold (MLS) $67,000 SW Michigan MLS
- 2009-10-06 Listed $79,900 REALCOMP
- 2009-10-06 Listed $79,900 SW Michigan MLS
- 2008-09-30 Listing Removed — REALCOMP
- 2008-06-11 Listed $133,000 REALCOMP
- 2008-06-11 Listed $133,000 SW Michigan MLS
- 1993-10-15 Sold (MLS) $42,000 REALCOMP
- 1993-10-15 Sold (MLS) $42,000 SW Michigan MLS
- 1993-08-13 Listed $40,150 REALCOMP
- 1993-08-13 Listed $40,150 SW Michigan MLS
Property tax history
+4.9%/yrLatest (2025): $1,790 · -10.8% YoY. Source: county tax records.
Cash-flow waterfall
monthlySold comps — $/sqft
last 12 mo · ≤1 miLoading sold comps…