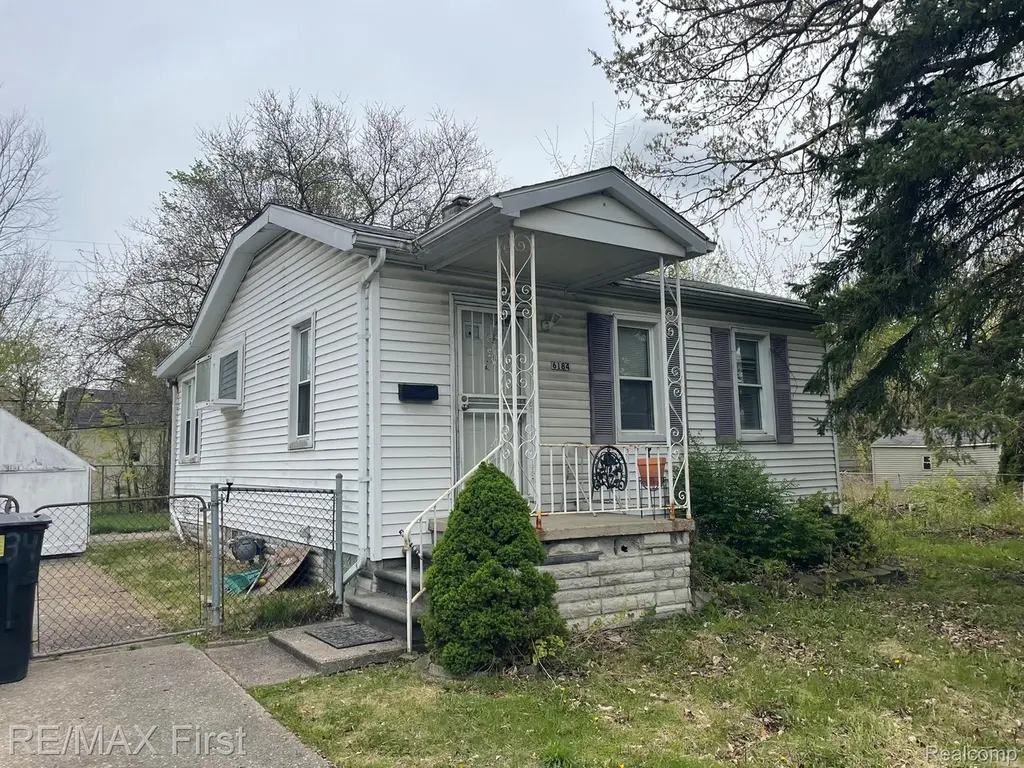
6184 Guilford St · Detroit, MI
Flood risk 1/10 · Minimal
- FEMA flood zone
- X (unshaded)
- Chance of flooding over 30 yrs
- 0.0%
- Est. flood insurance / yr
- $507 – $1,088
Fire risk 1/10 · Minimal
- Est. fire insurance / yr
- $784 – $1,456
Heat risk 3/10 · Minor
- Hot days now (above 96°F)
- 7 days/yr
- Hot days in 30 yrs
- 15 days/yr
Wind risk 2/10 · Minimal
- Chance of severe wind over 30 yrs
- —
Air-quality risk 3/10 · Minor
- Unhealthy air days now
- 3 days/yr
- Unhealthy air days in 30 yrs
- 4 days/yr
Risk factors via First Street. Map © Google.
Why this score? — see what drove the B- grade
The composite is a weighted blend of 9 inputs, each scored 0–100. Each bar is that input's sub-score; the figure is the points it added to the 100-point composite (weight × sub-score).
- Cash flow +30.0/30.0
- 1% rule +10.0/10.0
- DSCR +10.0/10.0
- ARV discount +7.5/15.0
- Livability +3.7/5.0
- Rent growth +2.7/5.0
- Condition / age +2.5/5.0
- Schools +1.3/10.0
- Appreciation +0.0/10.0
$30,000
🖨 Deal sheet 📄 Offer letter ✓ Due diligence
Listing remarks MLS
* * * * * Cash only offers * * * * Investment-ready opportunity: a solid 2-bedroom ranch located close to Ascension Hospital, shopping, and a major expressway for an easy commute, this property sits in a convenient, in-demand area that appeals to renters. Tenant can be removed prior to closing. * * * * * Please do not disturb the tenants. Showings will not be allowed until an offer is accepted, with no exceptions. * * * * * Owner has other rentals properties to sell and this can be bought individually or as a package deal. Other addresses are 3677 Somerset, 4102 Somerset, and 8810 Farmbrook all in Detroit. All information deemed reliable but not guaranteed. Buyers or buyer's agent to verify all information.
Key facts
- Close to shopping
- 5,663 sq ft lot
- Built 1925
Tags
Property features AI
Finance
- Other: Lot approximately 0.13 acres (50 x 114.46); Subdivision: Grosse Pointe Highlands Annex
- Financial info: (No investor or income/expense information provided)
- HOA & community: (No HOA or community information provided)
Exterior
- Parking: No garage
- Security: (No security features provided)
- Utilities: Public water; Public sewer
- Home design: Single-family residence; One level; Ground-level entry with steps; Vinyl siding
- Construction: Block foundation
- Exterior features: Paved road access; Asphalt roof
Interior
- Kitchen: (No specific kitchen appliance list provided)
- Bedrooms: 4 total rooms (includes bedrooms and living areas)
- Flooring: (No flooring information provided)
- Bathrooms: 1 full bathroom
- Heating & cooling: Forced-air heating (natural gas); No cooling
- Interior features: Gas water heater; Unfinished basement
- Laundry & utility: (No specific laundry or utility appliances listed)
Neighborhood map
What this means for you Summary
Snapshot
- This is a 2-bed/1.0-bath single-family listed at $30k.
Deal economics
- At list price, monthly cash flow is $593 ($7k/yr) — positive.
- The deal already cash-flows at list — no discount required.
- Meets the 1% rule at list price ($1k rent vs $30k).
- Recommended offer: $30k (1.5% below list) — sets the bar for market timing.
- Cap rate 30.0% vs local median 10.2% in Detroit — top-decile yield for the area; either an underpriced asset or a hidden risk that comps aren't pricing in. Stress-test before assuming the spread holds.
Location & tenants
- Location reads 73/100 on livability (#218 in MI) — a middle-class / working-renter tenant base. Strengths: amenities A+, commute A+, cost of living A+; Watch: schools F, crime F, employment F.
- Detroit Public Schools Community District (urban): math 10% / reading 24% proficiency, ranked #499 of 540 in MI (top 92%) — low school quality limits family demand, transient renter base, plan for 1-2y turnover; 90% free/reduced lunch — lower-income household profile, screen leases tightly.
- Market conditions: Rents flat; 484 active listings in the ZIP; 15 comparable units currently listed for rent nearby; rentals at typical pace (median 24d on market — plan ~3-4 weeks tenant-placement turnaround); 47% of comp listings sitting > 30 days — soft ceiling on asking rent; lower-income renter base — watch delinquency; 2,639 units permitted in Wayne County in 2024 (1,216 in 5+ unit buildings).
Forward outlook
- Local home prices are declining (-3.0%/yr); year-one equity from $207 of loan paydown is wiped out by about $900 of value loss. Plan a longer hold.
- Wayne County population projected at -17% by 2050 — secular population decline; favor cash flow + early exit over multi-decade hold.
- At projected returns (-3.0% appreciation + 0.7% rent growth), your $8k cash investment doubles in ~2 years — after that, you're playing with house money.
Negotiation context
- It's been on market 28 days — a 2% lower offer ($30k) is reasonable based on typical stale-listing flexibility.
- 4 sale attempts since 23y ago with the ask held roughly flat each time — persistent listings suggest the price (not the market) is what's stuck; bring a comps-based counter.
- Current owner paid $18k; list at $30k implies a 65% gain — meaningful room to come down on a strong offer.
Risks & watch-outs
- Watch-outs: property tax is 2.9% of price; built in 1925 — expect roof / HVAC / electrical / plumbing capex.
Questions for the listing agent
- Built in 1925 — when were the roof, HVAC, electrical panel, plumbing, and water heater last replaced?
- Property tax is high relative to price — has the assessment been appealed recently, and will the sale trigger a re-assessment?
- Is there a deadline driving the sale (1031 exchange, divorce, estate, relocation)? That informs how much negotiation room exists.
- Schools are F-rated, which usually means shorter tenancies and higher turnover. Who's the typical renter profile here, and what's been the actual vacancy rate?
- Crime grade is F in this area — have there been break-ins, vandalism, or insurance claims at this property in the last 3 years? What carrier currently insures it and at what premium?
- What's the average days-on-market for RENTAL listings here right now (not sales)? A rising rental-DOM trend means longer vacancies and softer asking-rent achievability than the comps imply.
- What's the recent tenant-quality profile in this submarket — average credit score on applications, eviction rate, late-payment / NSF rate, and stable-employment percentage? A property-management company in the area should have these aggregated.
- How much new for-sale + rental construction is in the pipeline within 1–3 miles? Heavy new supply typically softens prices + rents 12–24 months out; constrained supply supports both.
Investment metrics
- 1% rule
- 3.53% ✓
- Cap rate
- 30.03%
- Cash-on-cash
- 84.78%
- DSCR
- 4.77
- GRM
- 2.4
CMA / ARV
- ARV (on-the-fly)
- $15,552
- Comps found
- 2
Show comp detail 2 sales within ~0.75 mi
| Address | Dist | Beds/Ba | Sqft | Sold | Price | $/sf | Match |
|---|---|---|---|---|---|---|---|
| 5577 Radnor St | 0.59mi | 1/1.0 (-1) | 566 (-2%) | 23mo | $10,000 | $18 | 45 |
| 5558 Radnor St | 0.62mi | 2/1.0 | 660 (+15%) | 6mo | $18,000 | $27 | 42 |
Match score weights: distance 35% · size 25% · config 20% · recency 20%. Top-matched comps best support the ARV.
Projected returns pro-forma
-3.0% appreciation · 0.73% rent growth · sell at horizon
- IRR
- 82.5%
- Equity multiple
- 4.64×
- Total profit
- $30,610
- Equity at exit
- $4,473
- IRR
- 85.3%
- Equity multiple
- 8.88×
- Total profit
- $66,206
- Equity at exit
- $2,594
Cash invested: $8,400 (down + closing). Projections, not guarantees.
Landlord ↔ Tenant lean methodology
- Overall (STATE)
- 62 Landlord-Friendly
- State Michigan
- 62 Landlord-Friendly · EVEN
- County
- — inherits STATE
- City
- — inherits STATE
ZIP-level market 48224
- Rents YoY
- 0.7%
- Active inventory
- 484
- Price-to-rent
- 2.4×
Monthly cashflow live
- Estimated rent
- $1,059 high interval (Pro) →
- Mortgage (P&I)
- −$157
- Tax from tax record
- −$74 /mo · $883/yr
- Insurance
- −$12
- HOA
- −$0
- Vacancy / Maint / Mgmt
- −$222
- Net cashflow
- $593
Break-even live
UW: 25.0% down · 7.5% · 30yr · 1.5% tax · 5.0% vac · 8.0% maint · 8.0% mgmt
Financing live
Cash to close
- Down payment
- $7,500
- Closing costs
- $900
- Reserves months
- —
- Total cash needed
- —
Loan-product check · same deal, 3 products live
Conventional
25% down · 7.5% · 30yr
- Down + closing
- —
- Monthly P&I
- —
- Monthly cashflow
- —
- DSCR
- —
- Eligible?
- —
Personal DTI + credit; lowest rate.
DSCR
20% down · 8.5% · 30yr
- Down + closing
- —
- Monthly P&I
- —
- Monthly cashflow
- —
- DSCR
- —
- Eligible?
- —
No personal income docs; deal must DSCR.
Hard money
10% down · 12.0% · 12mo
- Down + closing
- —
- Monthly P&I
- —
- Monthly cashflow
- —
- DSCR
- —
- Eligible?
- —
Short-term bridge; refi at stabilization.
Rent comps 15 comps
| Address | Beds | Baths | Sqft | Rent | $/sqft | DOM | Units | Dist |
|---|---|---|---|---|---|---|---|---|
| 16927 Chandler Park Dr Unit 3_ Detroit, MI | 1.0 | 1.0 | 600 | $900 | $1.50 | 14d | 1 | 0.38mi |
| 9140 Whittier Ave Unit 1 Detroit, MI | 1.0 | 1.0 | 550 | $700 | $1.27 | 43d | 1 | 0.59mi |
| 4865 Cadieux Rd Unit 11 Detroit, MI | 2.0 | 1.0 | 630 | $1,200 | $1.90 | 43d | 1 | 0.77mi |
| 21301 Kingsville St Apt 108 Harper Woods, MI | 1.0 | 1.0 | 700 | $900 | $1.29 | 3d | 1 | 0.79mi |
| 4837 Cadieux Rd Unit 9 Detroit, MI | 2.0 | 1.0 | 650 | $1,200 | $1.85 | 43d | 1 | 0.79mi |
| 4811 Cadieux Rd Unit 11 Detroit, MI | 2.0 | 1.0 | 663 | $1,200 | $1.81 | 21d | 1 | 0.81mi |
| 4811 Cadieux Rd Unit 2 Detroit, MI | 1.0 | 1.0 | 600 | $950 | $1.58 | 43d | 1 | 0.81mi |
| 4811 Cadieux Rd Unit 10 Detroit, MI | 2.0 | 1.0 | 663 | $1,200 | $1.81 | 43d | 1 | 0.81mi |
| 11529 Roxbury St Detroit, MI | 2.0 | 1.0 | 720 | $1,200 | $1.67 | 12d | 1 | 0.95mi |
| 5284 Devonshire Rd Detroit, MI | 2.0 | 1.0 | 650 | $1,050 | $1.62 | 24d | 1 | 0.96mi |
| 5284 Devonshire Rd Unit 2 Detroit, MI | 1.0 | 1.0 | 750 | $1,050 | $1.40 | 14d | 1 | 0.96mi |
| 11611 Morang Ave Detroit, MI | 1.0–2.0 | 1.0 | 709 | $1,040 | $1.47 | 43d | 1 | 1.02mi |
| 12201 Morang Ave Unit 8 Detroit, MI | 2.0 | 1.0 | 610 | $875 | $1.43 | 43d | 1 | 1.31mi |
| 17161 Denver St Detroit, MI | 1.0 | 1.0 | 700 | $800 | $1.14 | 12d | 1 | 1.41mi |
| 17161 Denver St Apt 10 Detroit, MI | 1.0 | 1.0 | 700 | $800 | $1.14 | 10d | 1 | 1.41mi |
Listing history 21 events
-
2026-06-18days on market $30,000 Active 28 DOM
-
2026-06-17days on market $30,000 Active 27 DOM
-
2026-06-15days on market $30,000 Active 25 DOM
-
2026-06-13days on market $30,000 Active 23 DOM
-
2026-06-13days on market $30,000 Active 22 DOM
-
2026-06-09days on market $30,000 Active 19 DOM
-
2026-06-08days on market $30,000 Active 18 DOM
-
2026-06-07days on market $30,000 Active 17 DOM
-
2026-06-04days on market $30,000 Active 14 DOM
-
2026-06-03days on market $30,000 Active 13 DOM
-
2026-06-02days on market $30,000 Active 12 DOM
-
2026-06-01days on market $30,000 Active 11 DOM
-
2026-05-31days on market $30,000 Active 10 DOM
-
2026-05-21$30,000 Active
Show marketing remark (732 chars)
* * * * * Cash only offers * * * * Investment-ready opportunity: a solid 2-bedroom ranch located close to Ascension Hospital, shopping, and a major expressway for an easy commute, this property sits in a convenient, in-demand area that appeals to renters. Tenant can be removed prior to closing. * * * * * Please do not disturb the tenants. Showings will not be allowed until an offer is accepted, with no exceptions. * * * * * Owner has other rentals properties to sell and this can be bought individually or as a package deal. Other addresses are 3677 Somerset, 4102 Somerset, and 8810 Farmbrook all in Detroit. All information deemed reliable but not guaranteed. Buyers or buyer's agent to verify all information.
-
2026-05-21$30,000 Active 732-char remark
Show marketing remark (732 chars)
* * * * * Cash only offers * * * * Investment-ready opportunity: a solid 2-bedroom ranch located close to Ascension Hospital, shopping, and a major expressway for an easy commute, this property sits in a convenient, in-demand area that appeals to renters. Tenant can be removed prior to closing. * * * * * Please do not disturb the tenants. Showings will not be allowed until an offer is accepted, with no exceptions. * * * * * Owner has other rentals properties to sell and this can be bought individually or as a package deal. Other addresses are 3677 Somerset, 4102 Somerset, and 8810 Farmbrook all in Detroit. All information deemed reliable but not guaranteed. Buyers or buyer's agent to verify all information.
-
2005-10-24soldstatus $18,187 337-char remark
Show marketing remark (337 chars)
HUD CASE#261-669066 FHA INSURED FINANCING NOT AVAIL. HOME SOLD AS IS. HUD MAKES NO REPAIRS. ELECTRONIC BIDDING VIA PHONE OR INTERNET ONLY! COOP COMM. UP TO 5%. MCB & FUTURE MAKES NO WARRANTY AS TO THE EXISTENCE OF MOLD IN PROP. & IS NOT LIABLE FOR THE POTENTIALLY HARMFUL EFFECTS THEREOF. APPTS MUST BE MADE W/ LISTING OFFICE.
-
2005-07-22$18,000 337-char remark
Show marketing remark (337 chars)
HUD CASE#261-669066 FHA INSURED FINANCING NOT AVAIL. HOME SOLD AS IS. HUD MAKES NO REPAIRS. ELECTRONIC BIDDING VIA PHONE OR INTERNET ONLY! COOP COMM. UP TO 5%. MCB & FUTURE MAKES NO WARRANTY AS TO THE EXISTENCE OF MOLD IN PROP. & IS NOT LIABLE FOR THE POTENTIALLY HARMFUL EFFECTS THEREOF. APPTS MUST BE MADE W/ LISTING OFFICE.
-
2003-09-27historical
-
2003-06-20$55,000
-
1997-11-24soldstatus $35,000
-
1994-11-21soldstatus $2,175,714
ⓘ Source: listings_history table (triggers on properties + properties_extension) + one-shot
backfill from property_details.listing_events for pre-trigger history.
Tax reassessment forecast MI · Partial reset (capped growth)
- Current annual tax
- $883 · $74/mo
- Projected year-2 tax
- $883 · $74/mo
- Expected delta
- $0/yr ($0/mo · 0.0%)
ⓘ Screening estimate from a state-policy table — verify with the county assessor before closing.
Climate risk First Street
- Flood 1/10 Low FEMA zone X (unshaded) · 0% chance over 30 yrs
- Wildfire 1/10 Low
- Heat 3/10 Moderate 7 d/yr ≥96°F today · 15 d/yr by 30 yrs out
- Wind 2/10 Low
- Air quality 3/10 Moderate 3 unhealthy d/yr today · 4 by 30 yrs out
Nearby sold comps map
Loading sold comps map…
Walkable amenities ~0.75 mi
Loading nearby amenities…
Taxation est. · year 1
- Rental income
- $12,712
- − Mortgage interest
- −$1,680
- − Property taxes
- −$883
- − Insurance
- −$150
- − Repairs & maintenance
- −$1,017
- − Management
- −$1,017
- − Depreciation
- −$873
- Taxable income
- $7,092
- Est. tax owed @ 24.0%
- −$1,702
- After-tax cash flow
- $5,420/yr
For passive investors: Depreciation is non-cash, so a rental often shows a tax loss while cash-flowing — sheltering income. Rental losses are passive: they offset passive income freely, and up to $25,000/yr can offset ordinary (W-2) income if you actively participate and your MAGI is under $100k (phasing out to $0 by $150k); unused losses carry forward. On sale, claimed depreciation is recaptured at up to 25%, and gains may owe capital-gains tax (a 1031 exchange can defer both). Figures are a year-1 estimate at your 24.0% rate — not tax advice; consult a CPA.
Schools (NCES district)
- District
- Detroit Public Schools Community District
- NCES district ID
- 2601103
- Math proficiency
- 10% ▼ -2.00%
- Reading proficiency
- 24% ▲ 6.00%
- Median HH income
- $25,815
- Composite
- 13.06/100
- National rank
- #9564
- State rank
- #499 of 540 in MI
Livability — Detroit
- Score
- 73/100
- State rank
- #218
- US rank
- #5427
Category grades
Schools grade is shown separately in the Schools card above.
Census & demographics
- Census place
- Detroit, MI
- County
- Wayne County · 1,562,939 people
- City population
- 572,865
- Metro
- Detroit-Warren-Dearborn, MI
- Population (ZIP)
- 39,668
- Household income
- $44,856
- Rent vs Own
- Severe rent burden
- 2515.0
Population outlook (Wayne County) Hauer SSP2
- Today (2025)
- 1,675,273 people
- By 2030
- 1,620,300 · -3.3%
- By 2040
- 1,502,341 · -10.3%
- By 2050
- 1,384,039 · -17.4%
- By 2075
- 1,124,592 · -32.9%
- By 2100
- 881,193 · -47.4%
Race, ethnicity, and origin ACS 2023
- Neighborhood character
- Predominantly Black (88%)
- Race & ethnicity
- Black 88% White 8% Two or more races 3% Hispanic / Latino 1%
- Common ancestry
- Iranian 1% Romanian 1% Lithuanian 1%
- Foreign-born
- 1%
- Languages at home
- 97% English-only · Spanish 2%
Political lean MEDSL · Wayne
- 2024 margin
- Strong D (+29.0) · D 62.7% · R 33.7% · Other 3.6%
- 2008→2024 swing
- -20.5pp toward R · 2008: 49.5pp · 2024: 29.0pp
- All cycles
- 2024: D+29.0 2020: D+38.1 2016: D+37.3 2012: D+46.9 2008: D+49.5
Not yet ingested
- Civics
- —
Market trends
- HPI YoY
- ▼ -226.38%
- Current HPI
- 161.886
- Rent YoY
- ▲ 0.73%
- Metro
- Detroit-Warren-Dearborn, MI
- State GDP YoY
- ▲ 1.37%
- F500 in state
- 28
Industry mix (Fortune 500 HQ in MI)
| Industry | F500 HQs | Revenue |
|---|---|---|
| Automotive Parts | 3 | $48B |
|
||
| Automotive | 2 | $372B |
|
||
| Chemicals | 1 | $45B |
|
||
| Automotive Retail | 1 | $29B |
|
||
| Healthcare / Medical Devices | 1 | $23B |
|
||
| Automotive Technology | 1 | $20B |
|
||
Price history
-98.6% since first listed8 events — show timeline
- 2026-05-21 Listed $30,000 MiRealSource-MiMLS
- 2026-05-21 Listed $30,000 REALCOMP
- 2005-10-24 Sold (MLS) $18,187 REALCOMP
- 2005-07-22 Listed $18,000 REALCOMP
- 2003-09-27 Listing Removed — REALCOMP
- 2003-06-20 Listed $55,000 REALCOMP
- 1997-11-24 Sold (Public Records) $35,000 Public Records
- 1994-11-21 Sold (Public Records) $2,175,714 Public Records
Property tax history
-4.0%/yrLatest (2025): $883 · -53.6% YoY. Source: county tax records.
Cash-flow waterfall
monthlySold comps — $/sqft
last 12 mo · ≤1 miLoading sold comps…