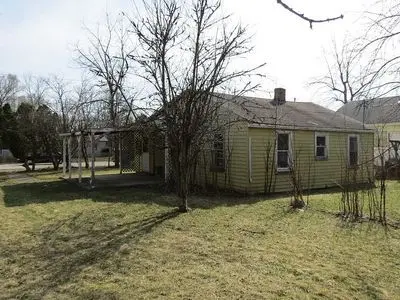
2718 C Ave · New Castle, IN
Flood risk 1/10 · Minimal
- FEMA flood zone
- X (unshaded)
- Chance of flooding over 30 yrs
- 0.0%
- Est. flood insurance / yr
- $507 – $1,088
Fire risk 1/10 · Minimal
- Est. fire insurance / yr
- $717 – $1,331
Heat risk 3/10 · Minor
- Hot days now (above 99°F)
- 7 days/yr
- Hot days in 30 yrs
- 18 days/yr
Wind risk 2/10 · Minimal
- Chance of severe wind over 30 yrs
- 1.0%
Air-quality risk 2/10 · Minimal
- Unhealthy air days now
- 1 days/yr
- Unhealthy air days in 30 yrs
- 2 days/yr
Risk factors via First Street. Map © Google.
Why this score? — see what drove the D+ grade
The composite is a weighted blend of 9 inputs, each scored 0–100. Each bar is that input's sub-score; the figure is the points it added to the 100-point composite (weight × sub-score).
- Cash flow +15.0/30.0
- ARV discount +7.5/15.0
- 1% rule +5.0/10.0
- DSCR +5.0/10.0
- Livability +3.8/5.0
- Rent growth +3.6/5.0
- Schools +2.7/10.0
- Condition / age +2.5/5.0
- Appreciation +0.0/10.0
$9,900
🖨 Deal sheet 📄 Offer letter ✓ Due diligence
Listing remarks
2 bedrooms and 1.0 bathrooms with 0.24 Acres. It is located at 2718 C Ave New Castle, Indiana. House currently is not livable and needs work. Owner is flexible with terms or price.
Key facts
- Built 1900
- Listed 23 days
Neighborhood map
What this means for you Summary
Snapshot
- This is a 2-bed/1.0-bath single-family listed at $10k.
Deal economics
- At list price, monthly cash flow is $642 ($8k/yr) — positive.
- The deal already cash-flows at list — no discount required.
- Meets the 1% rule at list price ($899 rent vs $10k).
- Recommended offer: $10k (1.5% below list) — sets the bar for market timing.
- Cap rate 84.1% vs local median 4.8% in New Castle — top-decile yield for the area; either an underpriced asset or a hidden risk that comps aren't pricing in. Stress-test before assuming the spread holds.
Location & tenants
- Location reads 75/100 on livability (#64 in IN, #4,219 nationally) — a middle-class / working-renter tenant base. Strengths: crime A+, cost of living A+, housing A+; Watch: schools D+, amenities F, commute F.
- New Castle Community School Corporation (town): math 30% / reading 35% proficiency, ranked #229 of 301 in IN (top 76%) — families likely to look elsewhere, expect single-tenant / working-renter base with shorter leases.
- Market conditions: Rents rising fast (+4.6%/yr); 214 active listings in the ZIP; 6 comparable units currently listed for rent nearby; rentals at typical pace (median 15d on market — plan ~3-4 weeks tenant-placement turnaround); 47 units permitted in Henry County in 2024 (0 in 5+ unit buildings).
- This rent is only 18% of the median local income ($60k/yr) — well below the 30% rent-burden line; pricing power to push rent on renewal without tenant pushback.
Forward outlook
- Local home prices are declining (-3.0%/yr); year-one equity from $68 of loan paydown is wiped out by about $297 of value loss. Plan a longer hold.
- Henry County population projected at -12% by 2050 — secular population decline; favor cash flow + early exit over multi-decade hold.
- At projected returns (-3.0% appreciation + 4.6% rent growth), your $3k cash investment doubles in ~1 year — after that, you're playing with house money.
Negotiation context
- It's been on market 24 days — a 2% lower offer ($10k) is reasonable based on typical stale-listing flexibility.
- 2 sale attempts since 12y ago with the ask held roughly flat each time — persistent listings suggest the price (not the market) is what's stuck; bring a comps-based counter.
Risks & watch-outs
- Watch-outs: built in 1900 — expect roof / HVAC / electrical / plumbing capex.
Questions for the listing agent
- Built in 1900 — when were the roof, HVAC, electrical panel, plumbing, and water heater last replaced?
- Is there a deadline driving the sale (1031 exchange, divorce, estate, relocation)? That informs how much negotiation room exists.
- Schools are D-rated, which usually means shorter tenancies and higher turnover. Who's the typical renter profile here, and what's been the actual vacancy rate?
- The area grade is low — what's the realistic commute time and amenity access for the typical tenant pool here? Any planned neighborhood developments (good or bad) we should know about?
- What's the average days-on-market for RENTAL listings here right now (not sales)? A rising rental-DOM trend means longer vacancies and softer asking-rent achievability than the comps imply.
- What's the recent tenant-quality profile in this submarket — average credit score on applications, eviction rate, late-payment / NSF rate, and stable-employment percentage? A property-management company in the area should have these aggregated.
- How much new for-sale + rental construction is in the pipeline within 1–3 miles? Heavy new supply typically softens prices + rents 12–24 months out; constrained supply supports both.
Investment metrics
- 1% rule
- 9.09% ✓
- Cap rate
- 84.13%
- Cash-on-cash
- 277.99%
- DSCR
- 13.37
- GRM
- 0.9
CMA / ARV
- ARV (on-the-fly)
- $96,356
- Comps found
- 12
Show comp detail 12 sales within ~0.75 mi
| Address | Dist | Beds/Ba | Sqft | Sold | Price | $/sf | Match |
|---|---|---|---|---|---|---|---|
| 2128 Grand Ave | 0.41mi | 2/1.0 | 861 (-3%) | 0mo | $93,000 | $108 | 76 |
| 1302 S 23rd St | 0.39mi | 2/1.0 | 898 (+2%) | 16mo | $52,000 | $58 | 66 |
| 1318 S 22nd St | 0.45mi | 2/1.0 | 780 (-12%) | 2mo | $140,000 | $179 | 58 |
| 1217 S 23rd St | 0.39mi | 3/1.0 (+1) | 912 (+3%) | 16mo | $45,000 | $49 | 58 |
| 1328 S 20th St | 0.57mi | 2/1.0 | 936 (+6%) | 11mo | $126,000 | $135 | 55 |
| 318 S 25th St | 0.33mi | 3/1.0 (+1) | 960 (+9%) | 14mo | $139,900 | $146 | 54 |
| 1418 S 20th St | 0.59mi | 2/1.0 | 825 (-7%) | 13mo | $85,400 | $104 | 51 |
| 1725 Hunter Ave | 0.50mi | 3/1.0 (+1) | 1,007 (+14%) | 1mo | $110,000 | $109 | 48 |
| 1016 S 19th St | 0.57mi | 2/1.0 | 1,008 (+14%) | 6mo | $114,900 | $114 | 45 |
| 2005 Cottage Ave | 0.64mi | 3/1.0 (+1) | 950 (+8%) | 13mo | $22,000 | $23 | 42 |
| 1516 S 20th St | 0.62mi | 2/1.0 | 756 (-14%) | 7mo | $106,000 | $140 | 41 |
| 2519 Spring St | 0.74mi | 1/1.0 (-1) | 936 (+6%) | 15mo | $83,000 | $89 | 38 |
Match score weights: distance 35% · size 25% · config 20% · recency 20%. Top-matched comps best support the ARV.
Projected returns pro-forma
-3.0% appreciation · 4.59% rent growth · sell at horizon
- IRR
- —
- Equity multiple
- 15.71×
- Total profit
- $40,770
- Equity at exit
- $1,476
- IRR
- —
- Equity multiple
- 35.06×
- Total profit
- $94,416
- Equity at exit
- $856
Cash invested: $2,772 (down + closing). Projections, not guarantees.
Landlord ↔ Tenant lean methodology
- Overall (STATE)
- 90 Strongly Landlord-Friendly
- State Indiana
- 90 Strongly Landlord-Friendly · R+11
- County
- — inherits STATE
- City
- — inherits STATE
ZIP-level market 47362
- Home prices YoY
- -16.0%
- Rents YoY
- 4.6%
- Active inventory
- 214
- Price-to-rent
- 0.9×
Monthly cashflow live
- Estimated rent
- $899 high interval (Pro) →
- Mortgage (P&I)
- −$52
- Tax est. 1.5%
- −$12 /mo · $148/yr
- Insurance
- −$4
- HOA
- −$0
- Vacancy / Maint / Mgmt
- −$189
- Net cashflow
- $642
Break-even live
UW: 25.0% down · 7.5% · 30yr · 1.5% tax · 5.0% vac · 8.0% maint · 8.0% mgmt
Financing live
Cash to close
- Down payment
- $2,475
- Closing costs
- $297
- Reserves months
- —
- Total cash needed
- —
Loan-product check · same deal, 3 products live
Conventional
25% down · 7.5% · 30yr
- Down + closing
- —
- Monthly P&I
- —
- Monthly cashflow
- —
- DSCR
- —
- Eligible?
- —
Personal DTI + credit; lowest rate.
DSCR
20% down · 8.5% · 30yr
- Down + closing
- —
- Monthly P&I
- —
- Monthly cashflow
- —
- DSCR
- —
- Eligible?
- —
No personal income docs; deal must DSCR.
Hard money
10% down · 12.0% · 12mo
- Down + closing
- —
- Monthly P&I
- —
- Monthly cashflow
- —
- DSCR
- —
- Eligible?
- —
Short-term bridge; refi at stabilization.
Rent comps 6 comps
| Address | Beds | Baths | Sqft | Rent | $/sqft | DOM | Units | Dist |
|---|---|---|---|---|---|---|---|---|
| 1216 S 19th St New Castle, IN | 2.0 | 1.0 | 824 | $1,000 | $1.21 | 23d | 1 | 0.58mi |
| 940 S 15th St New Castle, IN | 1.0–2.0 | 1.0–1.5 | 816 | $1,075 | $1.32 | 1d | 2 | 0.84mi |
| 701 S 14th St Unit 4A New Castle, IN | 1.0 | 1.0 | 600 | $615 | $1.02 | 12d | 1 | 1.00mi |
| 1618 P Ave New Castle, IN | 3.0 | 1.5 | 1064 | $950 | $0.89 | 1d | 1 | 1.08mi |
| 417 S 12th St Unit D New Castle, IN | 1.0 | 1.0 | 525 | $685 | $1.30 | 14d | 1 | 1.19mi |
| 1104 Thornburg St New Castle, IN | 2.0 | 1.0 | 645 | $685 | $1.06 | 43d | 1 | 1.43mi |
Listing history 18 events
-
2026-06-19days on market $9,900 Active 24 DOM
-
2026-06-18days on market $9,900 Active 23 DOM
-
2026-06-17days on market $9,900 Active 22 DOM
-
2026-06-16days on market $9,900 Active 21 DOM
-
2026-06-15days on market $9,900 Active 20 DOM
-
2026-06-14days on market $9,900 Active 18 DOM
-
2026-06-12days on market $9,900 Active 17 DOM
-
2026-06-09days on market $9,900 Active 14 DOM
-
2026-06-08days on market $9,900 Active 13 DOM
-
2026-06-07days on market $9,900 Active 12 DOM
-
2026-06-05days on market $9,900 Active 9 DOM
-
2026-06-03days on market $9,900 Active 8 DOM
-
2026-06-02days on market $9,900 Active 7 DOM
-
2026-06-01days on market $9,900 Active 6 DOM
-
2026-05-31days on market $9,900 Active 5 DOM
-
2026-05-30days on market $9,900 Active 4 DOM
-
2026-05-26$9,900 Active
-
2014-03-05$9,900
ⓘ Source: listings_history table (triggers on properties + properties_extension) + one-shot
backfill from property_details.listing_events for pre-trigger history.
Climate risk First Street
- Flood 1/10 Low FEMA zone X (unshaded) · 0% chance over 30 yrs
- Wildfire 1/10 Low
- Heat 3/10 Moderate 7 d/yr ≥99°F today · 18 d/yr by 30 yrs out
- Wind 2/10 Low 100% chance of damaging wind over 30 yrs
- Air quality 2/10 Low 1 unhealthy d/yr today · 2 by 30 yrs out
Nearby sold comps map
Loading sold comps map…
Walkable amenities ~0.75 mi
Loading nearby amenities…
Taxation est. · year 1
- Rental income
- $10,793
- − Mortgage interest
- −$555
- − Property taxes
- −$148
- − Insurance
- −$50
- − Repairs & maintenance
- −$863
- − Management
- −$863
- − Depreciation
- −$288
- Taxable income
- $8,026
- Est. tax owed @ 24.0%
- −$1,926
- After-tax cash flow
- $5,780/yr
For passive investors: Depreciation is non-cash, so a rental often shows a tax loss while cash-flowing — sheltering income. Rental losses are passive: they offset passive income freely, and up to $25,000/yr can offset ordinary (W-2) income if you actively participate and your MAGI is under $100k (phasing out to $0 by $150k); unused losses carry forward. On sale, claimed depreciation is recaptured at up to 25%, and gains may owe capital-gains tax (a 1031 exchange can defer both). Figures are a year-1 estimate at your 24.0% rate — not tax advice; consult a CPA.
Schools (NCES district)
- District
- New Castle Community School Corporation
- NCES district ID
- 1807440
- Math proficiency
- 30% ▼ -13.00%
- Reading proficiency
- 35% ▼ -9.00%
- Median HH income
- $36,717
- Composite
- 26.99/100
- National rank
- #7067
- State rank
- #229 of 301 in IN
Livability — New Castle
- Score
- 75/100
- State rank
- #64
- US rank
- #4219
Category grades
Schools grade is shown separately in the Schools card above.
Census & demographics
- Census place
- New Castle, IN
- County
- Henry County · 29,337 people
- City population
- 29,337
- Metro
- New Castle, IN
- Population (ZIP)
- 29,337
- Household income
- $60,258
- Rent vs Own
- Severe rent burden
- 545.0
Population outlook (Henry County) Hauer SSP2
- Today (2025)
- 48,028 people
- By 2030
- 47,125 · -1.9%
- By 2040
- 44,820 · -6.7%
- By 2050
- 42,207 · -12.1%
- By 2075
- 35,814 · -25.4%
- By 2100
- 26,779 · -44.2%
Race, ethnicity, and origin ACS 2023
- Neighborhood character
- Predominantly White (90%)
- Race & ethnicity
- White 90% Two or more races 3% Black 3% Hispanic / Latino 3%
- Common ancestry
- Italian 2% Slovak 1% Lithuanian 1%
- Foreign-born
- 2% · Canada
- Languages at home
- 97% English-only · Spanish 2%
Political lean MEDSL · Henry
- 2024 margin
- Solid R (+47.7) · D 25.3% · R 73.0% · Other 1.7%
- 2008→2024 swing
- -43.8pp toward R · 2008: -3.9pp · 2024: -47.7pp
- All cycles
- 2024: R+47.7 2020: R+45.2 2016: R+43.7 2012: R+17.0 2008: R+3.9
Not yet ingested
- Civics
- —
Market trends
- HPI YoY
- ▼ -43.70%
- Current HPI
- 228.8885
- Rent YoY
- ▲ 4.59%
- Metro
- New Castle, IN
- State GDP YoY
- ▲ 2.90%
- F500 in state
- 18
Industry mix (Fortune 500 HQ in IN)
| Industry | F500 HQs | Revenue |
|---|---|---|
| Industrial Machinery | 2 | $37B |
|
||
| Healthcare | 1 | $177B |
|
||
| Pharmaceuticals | 1 | $45B |
|
||
| Metals / Steel | 1 | $18B |
|
||
| Agriculture | 1 | $17B |
|
||
| Packaging | 1 | $12B |
|
||
Price history
+0.0% since first listed2 events — show timeline
- 2026-05-26 Listed $9,900 FSBO.com
- 2014-03-05 Listed $9,900 MIBOR as Distributed by MLS Grid
Property tax history
-5.5%/yrLatest (2024): $696 · +9.1% YoY. Source: county tax records.
Cash-flow waterfall
monthlySold comps — $/sqft
last 12 mo · ≤1 miLoading sold comps…