565 Piedmont L · Delray Beach, FL
Flood risk 4/10 · Minor
- FEMA flood zone
- X (unshaded)
- Chance of flooding over 30 yrs
- 0.2%
- Est. flood insurance / yr
- $507 – $1,088
Fire risk 1/10 · Minimal
- Est. fire insurance / yr
- $947 – $1,759
Heat risk 9/10 · Severe
- Hot days now (above 107°F)
- 7 days/yr
- Hot days in 30 yrs
- 26 days/yr
Wind risk 10/10 · Severe
- Chance of severe wind over 30 yrs
- 99.0%
Air-quality risk 3/10 · Minor
- Unhealthy air days now
- 2 days/yr
- Unhealthy air days in 30 yrs
- 3 days/yr
Risk factors via First Street. Map © Google.
Why this score? — see what drove the D- grade
The composite is a weighted blend of 9 inputs, each scored 0–100. Each bar is that input's sub-score; the figure is the points it added to the 100-point composite (weight × sub-score).
- Cash flow +8.8/30.0
- ARV discount +7.5/15.0
- 1% rule +6.9/10.0
- Schools +4.3/10.0
- Livability +3.9/5.0
- Rent growth +3.6/5.0
- Condition / age +2.5/5.0
- DSCR +2.4/10.0
- Appreciation +0.0/10.0
$167,000
🖨 Deal sheet 📄 Offer letter ✓ Due diligence
Listing remarks
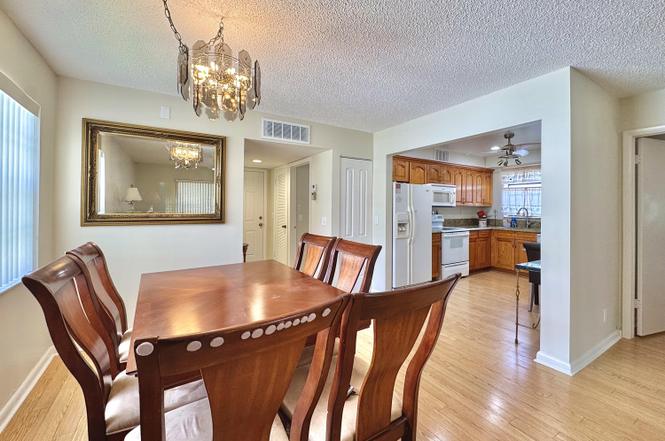
Rare and desirable layout in Kings Point's sought after Piedmont section. This well maintained 2 bed 2 bath condo offers rare privacy with bedrooms positioned on opposite sides of the unit and only one small back wall shared with a neighbor. This gives an ultimate feel of privacy and extra windows providing ample natural light on all sides and rooms. Features include wood flooring, granite countertops and real wood cabinetry. The unique floor plan lives larger than most 2 BR units and includes an oversized enclosed patio with serene golf course views. Conveniently located close proximity to a real elevator, not a lift. Enjoy Kings Point's Resort Style Amenities including clubhouses, restaur
Key facts
- Wood flooring
- Real wood cabinetry
- Granite countertops
Tags
Property features AI
Finance
- Other: Pets not allowed
- HOA & community: Community association with amenities; Monthly HOA fee; Association covers insurance, grounds maintenance, pest control, common areas and recreation facilities; Community amenities include clubhouse, fitness center, indoor pool, outdoor pool, sauna, spa/hot tub, tennis courts, billiard room, game room, workshop area, business center, cafe/restaurant, courtesy bus, library and street lights; Senior community
Exterior
- Parking: Assigned parking; Guest parking
- Security: Gated community with guard; Security patrol
- Utilities: Public water; Public sewer; Sewer and water available
- Home design: Condominium; Multi/split levels; 2-story building; North-facing
- Construction: Built with CBS construction
- Exterior features: Not waterfront
Interior
- Kitchen: Dishwasher; Electric range; Microwave; Refrigerator; Disposal; Electric water heater
- Bedrooms: 2 bedrooms on the main level
- Flooring: Laminate
- Bathrooms: 2 full bathrooms (main level)
- Heating & cooling: Central heating; Central air; Ceiling fans
- Interior features: Walk-in closets; Split bedroom layout; Partially furnished
- Laundry & utility: Laundry inside the unit
Neighborhood map
What this means for you Summary
Snapshot
- This is a 2-bed/2.0-bath condo listed at $167k.
Deal economics
- At list price, monthly cash flow is $-136 ($-2k/yr) — negative.
- To cash-flow at today's rent, offer at most $143k (14.4% below list).
- Meets the 1% rule at list price ($2k rent vs $167k).
- Recommended offer: $143k (14.4% below list) — sets the bar for cash-flow.
- Cap rate 5.3% vs local median 4.3% in Delray Beach — meaningfully above typical; check what's discounted (condition, days-on-market, listing class) to confirm the premium yield is real.
Location & tenants
- Location reads 77/100 on livability (#202 in FL, #3,160 nationally) — a middle-class / working-renter tenant base. Strengths: housing A+, health & safety A+, commute A-; Watch: cost of living C-, crime D-, amenities F.
- Palm Beach (suburban): math 46% / reading 53% proficiency, ranked #34 of 73 in FL (top 47%) — families likely to look elsewhere, expect single-tenant / working-renter base with shorter leases.
- Zoned schools: Orchard View Elementary School (math 48% / reading 47%, grade D, #1,182 of 2,144 statewide, top 55%, 596 students, 76% FRL); Spanish River Community High School (math 64% / reading 74%, grade B, #63 of 667 statewide, top 10%, 2,578 students, 25% FRL) — zoned schools at 50% FRL track the district average.
- Market conditions: Rents rising fast (+4.3%/yr); 546 active listings in the ZIP; 40 comparable units currently listed for rent nearby; rentals at typical pace (median 25d on market — plan ~3-4 weeks tenant-placement turnaround); 3,974 units permitted in Palm Beach County in 2024 (1,012 in 5+ unit buildings).
- This rent runs 38% of the median local income ($62k/yr) — at the standard rent-burdened threshold; future hikes will face affordability resistance.
Forward outlook
- Local home prices are declining (-3.0%/yr); year-one equity from $1k of loan paydown is wiped out by about $5k of value loss. Plan a longer hold.
- Palm Beach County population projected at +30% by 2050 — long-run rental-demand tailwind backs the buy-and-hold thesis.
Negotiation context
- It's been on market 125 days — a 12% lower offer ($147k) is reasonable based on typical stale-listing flexibility.
- Current owner paid $72k; list at $167k implies a 130% gain — meaningful room to come down on a strong offer.
Risks & watch-outs
- Watch-outs: HOA is 36% of rent.
- Climate carrying-cost: severe wind risk, 99% chance of damaging wind over 30y; extreme-heat days projected 7→26/yr by 2055 (HVAC capex compounding) — expect insurance premiums to compound above CPI over the hold.
Questions for the listing agent
- What do current leases actually rent for vs. the listed asking? Can we see a recent rent roll and the last 12 months of T-12 income?
- It's been on market 125 days. Have you received any prior offers? Is the seller open to a 14% concession, seller financing, or rate buy-down credit?
- What does the HOA fee cover, when was the last increase, and are there any pending special assessments or reserve-fund shortfalls?
- Any open or pending special assessments — roof, HVAC, plumbing, elevator, façade? What's the per-unit balance and payoff schedule, and is the seller paying it off at close or rolling it to the buyer?
- Why hasn't it sold? Are there any deal-killer items the seller is aware of (foundation, flood, title, zoning, code violations)?
- Is there a deadline driving the sale (1031 exchange, divorce, estate, relocation)? That informs how much negotiation room exists.
- Schools are B-rated — typically a magnet for longer-tenancy family renters. What's the average tenant stay here, and is there a school-zone premium baked into asking?
- Crime grade is D in this area — have there been break-ins, vandalism, or insurance claims at this property in the last 3 years? What carrier currently insures it and at what premium?
- The area grade is low — what's the realistic commute time and amenity access for the typical tenant pool here? Any planned neighborhood developments (good or bad) we should know about?
- What's the average days-on-market for RENTAL listings here right now (not sales)? A rising rental-DOM trend means longer vacancies and softer asking-rent achievability than the comps imply.
- What's the recent tenant-quality profile in this submarket — average credit score on applications, eviction rate, late-payment / NSF rate, and stable-employment percentage? A property-management company in the area should have these aggregated.
- How much new apartment / multifamily construction is in the pipeline within 1–3 miles? Heavy new supply (>2% of stock underway) typically softens rents 12–24 months out; light construction supports rent growth.
Investment metrics
- 1% rule
- 1.19% ✓
- Cap rate
- 5.31%
- Cash-on-cash
- -3.50%
- DSCR
- 0.84
- GRM
- 7.0
CMA / ARV
No comps found within radius.
Projected returns pro-forma
-3.0% appreciation · 4.28% rent growth · sell at horizon
- IRR
- -19.7%
- Equity multiple
- 0.30×
- Total profit
- $-32,776
- Equity at exit
- $24,900
- IRR
- -8.6%
- Equity multiple
- 0.42×
- Total profit
- $-27,266
- Equity at exit
- $14,439
Cash invested: $46,760 (down + closing). Projections, not guarantees.
Landlord ↔ Tenant lean methodology
- Overall (STATE)
- 87 Strongly Landlord-Friendly
- State Florida
- 87 Strongly Landlord-Friendly · R+3
- County
- — inherits STATE
- City
- — inherits STATE
ZIP-level market 33484
- Rents YoY
- 4.3%
- Active inventory
- 546
- Price-to-rent
- 7.0×
Monthly cashflow live
- Estimated rent
- $1,993 high interval (Pro) →
- Mortgage (P&I)
- −$876
- Tax from tax record
- −$38 /mo · $461/yr
- Insurance
- −$70
- HOA
- −$727
- Vacancy / Maint / Mgmt
- −$419
- Net cashflow
- $-136
Break-even live
UW: 25.0% down · 7.5% · 30yr · 1.5% tax · 5.0% vac · 8.0% maint · 8.0% mgmt
Financing live
Cash to close
- Down payment
- $41,750
- Closing costs
- $5,010
- Reserves months
- —
- Total cash needed
- —
Loan-product check · same deal, 3 products live
Conventional
25% down · 7.5% · 30yr
- Down + closing
- —
- Monthly P&I
- —
- Monthly cashflow
- —
- DSCR
- —
- Eligible?
- —
Personal DTI + credit; lowest rate.
DSCR
20% down · 8.5% · 30yr
- Down + closing
- —
- Monthly P&I
- —
- Monthly cashflow
- —
- DSCR
- —
- Eligible?
- —
No personal income docs; deal must DSCR.
Hard money
10% down · 12.0% · 12mo
- Down + closing
- —
- Monthly P&I
- —
- Monthly cashflow
- —
- DSCR
- —
- Eligible?
- —
Short-term bridge; refi at stabilization.
Rent comps 40 comps
| Address | Beds | Baths | Sqft | Rent | $/sqft | DOM | Units | Dist |
|---|---|---|---|---|---|---|---|---|
| 523 Piedmont E Unit 523 Delray Beach, FL | 2.0 | 2.0 | 1044 | $1,750 | $1.68 | 24d | 1 | 0.05mi |
| 166 Piedmont Way Delray Beach, FL | 2.0 | 2.0 | 910 | $1,600 | $1.76 | 24d | 1 | 0.06mi |
| 137 Piedmont Way Unit 137 Delray Beach, FL | 2.0 | 2.0 | 1040 | $2,300 | $2.21 | 11d | 1 | 0.06mi |
| 344 Piedmont Trl Delray Beach, FL | 2.0 | 2.0 | 910 | $1,600 | $1.76 | 24d | 1 | 0.09mi |
| 176 Piedmont D Delray Beach, FL | 2.0 | 2.0 | 910 | $1,600 | $1.76 | 24d | 1 | 0.09mi |
| 499 Piedmont K Delray Beach, FL | 2.0 | 2.0 | 907 | $2,800 | $3.09 | 24d | 1 | 0.09mi |
| 341 Piedmont H Unit H Delray Beach, FL | 2.0 | 2.0 | 907 | $1,650 | $1.82 | 14d | 1 | 0.09mi |
| 224 Piedmont F #224 Delray Beach, FL | 1.0 | 1.5 | 760 | $1,200 | $1.58 | 24d | 1 | 0.09mi |
| 322 Piedmont G Delray Beach, FL | 2.0 | 2.0 | 910 | $1,800 | $1.98 | 8d | 1 | 0.10mi |
| 322 Piedmont G Delray Beach, FL | 2.0 | 2.0 | 910 | $2,000 | $2.20 | 14d | 1 | 0.10mi |
| 514 Piedmont K Unit k Delray Beach, FL | 1.0 | 1.5 | 792 | $1,690 | $2.13 | 3d | 1 | 0.12mi |
| 514 Piedmont K Delray Beach, FL | 1.0 | 1.5 | 792 | $1,690 | $2.13 | 24d | 1 | 0.12mi |
| 457 Flanders Dr Unit 457 Delray Beach, FL | 1.0 | 1.5 | 760 | $2,800 | $3.68 | 24d | 1 | 0.13mi |
| 173 Flanders Dr Unit 173 Delray Beach, FL | 2.0 | 2.0 | 920 | $2,400 | $2.61 | 24d | 1 | 0.13mi |
| 278 Flanders Dr Unit 278 Delray Beach, FL | 1.0 | 1.5 | 828 | $1,290 | $1.56 | 24d | 1 | 0.13mi |
| 697 Flanders O Delray Beach, FL | 1.0 | 1.5 | 760 | $1,400 | $1.84 | 2d | 1 | 0.13mi |
| 177 Flanders Dr Unit 177 Delray Beach, FL | 2.0 | 2.0 | 920 | $1,600 | $1.74 | 24d | 1 | 0.13mi |
| 370 Piedmont Trl Unit 370 Delray Beach, FL | 1.0 | 2.0 | 760 | $1,700 | $2.24 | 24d | 1 | 0.14mi |
| 719 Flanders O Delray Beach, FL | 2.0 | 2.0 | 920 | $1,800 | $1.96 | 24d | 1 | 0.14mi |
| 370 Piedmont H Delray Beach, FL | 1.0 | 1.5 | 760 | $1,600 | $2.11 | 24d | 1 | 0.15mi |
| 492 Piedmont Ct Delray Beach, FL | 2.0 | 2.0 | 1040 | $2,200 | $2.12 | 24d | 1 | 0.15mi |
| 368 Piedmont H Unit H Delray Beach, FL | 2.0 | 2.0 | 910 | $1,850 | $2.03 | 24d | 1 | 0.15mi |
| 205 Flanders Dr Unit 205 Delray Beach, FL | 2.0 | 2.0 | 883 | $1,750 | $1.98 | 24d | 1 | 0.16mi |
| 177 Flanders D Delray Beach, FL | 2.0 | 2.0 | 920 | $1,600 | $1.74 | 24d | 1 | 0.17mi |
| 7 Piedmont a Delray Beach, FL | 2.0 | 2.0 | 910 | $2,200 | $2.42 | 3d | 1 | 0.20mi |
| 811 Flanders Q Delray Beach, FL | 2.0 | 2.0 | 920 | $1,700 | $1.85 | 3d | 1 | 0.23mi |
| 811 Flanders Q Delray Beach, FL | 2.0 | 2.0 | 920 | $1,700 | $1.85 | 14d | 1 | 0.23mi |
| 127 Flanders C Delray Beach, FL | 1.0 | 1.5 | 760 | $1,550 | $2.04 | 24d | 1 | 0.24mi |
| 29 Flanders a Delray Beach, FL | 2.0 | 2.0 | 760 | $1,900 | $2.50 | 24d | 1 | 0.25mi |
| 23 Flanders a Delray Beach, FL | 1.0 | 1.5 | 760 | $1,500 | $1.97 | 24d | 1 | 0.27mi |
| 960 Flanders T Delray Beach, FL | 1.0 | 1.5 | 760 | $1,500 | $1.97 | 24d | 1 | 0.28mi |
| 586 Normandy Ln #586 Delray Beach, FL | 2.0 | 2.0 | 907 | $1,750 | $1.93 | 24d | 1 | 0.29mi |
| 559 Normandy Ln #559 Delray Beach, FL | 2.0 | 2.0 | 907 | $1,650 | $1.82 | 24d | 1 | 0.29mi |
| 244 Normandy Ln Delray Beach, FL | 2.0 | 2.0 | 907 | $2,400 | $2.65 | 11d | 1 | 0.29mi |
| 729 Normandy P Delray Beach, FL | 2.0 | 2.0 | 907 | $1,600 | $1.76 | 24d | 1 | 0.29mi |
| 825 Normandy R Delray Beach, FL | 2.0 | 2.0 | 905 | $3,350 | $3.70 | 18d | 1 | 0.29mi |
| 708 Normandy O Delray Beach, FL | 2.0 | 2.0 | 907 | $3,000 | $3.31 | 24d | 1 | 0.29mi |
| 185 Normandy D Delray Beach, FL | 1.0 | 1.5 | 760 | $1,499 | $1.97 | 14d | 1 | 0.29mi |
| 705 Normandy Ln Unit 705 Delray Beach, FL | 2.0 | 2.0 | 907 | $2,600 | $2.87 | 24d | 1 | 0.29mi |
| 394 Normandy I Delray Beach, FL | 2.0 | 2.0 | 907 | $1,600 | $1.76 | 24d | 1 | 0.29mi |
HOA detail condo
- Monthly dues
- $727 · $8,724/yr
- Assessments
- None detected in remarks — confirm with the listing agent.
Listing history 14 events
-
2026-06-18days on market $167,000 Active 125 DOM
-
2026-06-17days on market $167,000 Active 124 DOM
-
2026-06-16days on market $167,000 Active 123 DOM
-
2026-06-15days on market $167,000 Active 122 DOM
-
2026-06-13days on market $167,000 Active 120 DOM
-
2026-06-09days on market $167,000 Active 116 DOM
-
2026-06-07days on market $167,000 Active 114 DOM
-
2026-06-04days on market $167,000 Active 111 DOM
-
2026-06-03days on market $167,000 Active 110 DOM
-
2026-06-01days on market $167,000 Active 108 DOM
-
2026-05-31days on market $167,000 Active 107 DOM
-
2026-03-03price $167,000
-
2026-02-11$175,000 Active
-
1994-01-24soldstatus $72,500
ⓘ Source: listings_history table (triggers on properties + properties_extension) + one-shot
backfill from property_details.listing_events for pre-trigger history.
Tax reassessment forecast FL · Resets to sale price
- Current annual tax
- $461 · $38/mo
- Projected year-2 tax
- $1,386 · $116/mo
- Expected delta
- +$925/yr (+$77/mo · 200.7%)
ⓘ Screening estimate from a state-policy table — verify with the county assessor before closing.
Climate risk First Street
- Flood 4/10 Moderate FEMA zone X (unshaded) · 20% chance over 30 yrs
- Wildfire 1/10 Low
- Heat 9/10 Extreme 7 d/yr ≥107°F today · 26 d/yr by 30 yrs out
- Wind 10/10 Extreme 99% chance of damaging wind over 30 yrs
- Air quality 3/10 Moderate 2 unhealthy d/yr today · 3 by 30 yrs out
Nearby sold comps map
Loading sold comps map…
Walkable amenities ~0.75 mi
Loading nearby amenities…
Taxation est. · year 1
- Rental income
- $23,915
- − Mortgage interest
- −$9,355
- − Property taxes
- −$461
- − Insurance
- −$835
- − Repairs & maintenance
- −$1,913
- − Management
- −$1,913
- − HOA
- −$8,724
- − Depreciation
- −$4,858
- Taxable loss
- −$4,144
- Est. tax savings @ 24.0%
- +$995
- After-tax cash flow
- $-642/yr
For passive investors: Depreciation is non-cash, so a rental often shows a tax loss while cash-flowing — sheltering income. Rental losses are passive: they offset passive income freely, and up to $25,000/yr can offset ordinary (W-2) income if you actively participate and your MAGI is under $100k (phasing out to $0 by $150k); unused losses carry forward. On sale, claimed depreciation is recaptured at up to 25%, and gains may owe capital-gains tax (a 1031 exchange can defer both). Figures are a year-1 estimate at your 24.0% rate — not tax advice; consult a CPA.
Schools (NCES district)
- District
- Palm Beach
- NCES district ID
- 1201500
- Math proficiency
- 46% ▼ -16.00%
- Reading proficiency
- 53% ▼ -4.00%
- Median HH income
- $53,943
- Composite
- 42.72/100
- National rank
- #3160
- State rank
- #34 of 73 in FL
Livability — Delray Beach
- Score
- 77/100
- State rank
- #202
- US rank
- #3160
Category grades
Schools grade is shown separately in the Schools card above.
Census & demographics
- County
- Palm Beach County · 1,438,312 people
- City population
- 123,167
- Metro
- Miami-Fort Lauderdale-Pompano Beach, FL
- Population (ZIP)
- 26,208
- Household income
- $62,151
- Rent vs Own
- Severe rent burden
- 991.0
Population outlook (Palm Beach County) Hauer SSP2
- Today (2025)
- 1,637,487 people
- By 2030
- 1,743,255 · +6.5%
- By 2040
- 1,948,712 · +19.0%
- By 2050
- 2,132,979 · +30.3%
- By 2075
- 2,530,027 · +54.5%
- By 2100
- 2,706,979 · +65.3%
Race, ethnicity, and origin ACS 2023
- Neighborhood character
- Predominantly White (74%)
- Race & ethnicity
- White 74% Hispanic / Latino 14% Two or more races 10% Black 5% Asian 2%
- Hispanic origin (detail)
- Puerto Rican 2% Cuban 2%
- Common ancestry
- Scotch-Irish 7% Romanian 6% Italian 2%
- Foreign-born
- 23% · Canada, Jamaica, China
- Languages at home
- 76% English-only · Spanish 13% Russian/Polish/Slavic 3% French/Haitian/Cajun 3%
Political lean MEDSL · Palm Beach
- 2024 margin
- Toss-up / Even · D 50.0% · R 49.2%
- 2008→2024 swing
- -22.1pp toward R · 2008: 22.9pp · 2024: 0.8pp
- All cycles
- 2024: D+0.8 2020: D+12.8 2016: D+15.3 2012: D+17.0 2008: D+22.9
Not yet ingested
- Civics
- —
Market trends
- HPI YoY
- ▼ -232.73%
- Current HPI
- 254.5016
- Rent YoY
- ▲ 4.28%
- Metro
- Miami-Fort Lauderdale-Pompano Beach, FL
- State GDP YoY
- ▲ 3.28%
- F500 in state
- 36
Industry mix (Fortune 500 HQ in FL)
| Industry | F500 HQs | Revenue |
|---|---|---|
| Industrial Technology | 2 | $29B |
|
||
| Insurance | 2 | $17B |
|
||
| Retail | 1 | $60B |
|
||
| Technology Distribution | 1 | $58B |
|
||
| Homebuilding | 1 | $35B |
|
||
| Technology Manufacturing | 1 | $35B |
|
||
Price history
+130.3% since first listed3 events — show timeline
- 2026-03-03 Price Changed $167,000 Beaches MLS
- 2026-02-11 Listed $175,000 Beaches MLS
- 1994-01-24 Sold (Public Records) $72,500 Public Records
Property tax history
+1.8%/yrLatest (2025): $461 · +4.4% YoY. Source: county tax records.
Cash-flow waterfall
monthlySold comps — $/sqft
last 12 mo · ≤1 miLoading sold comps…