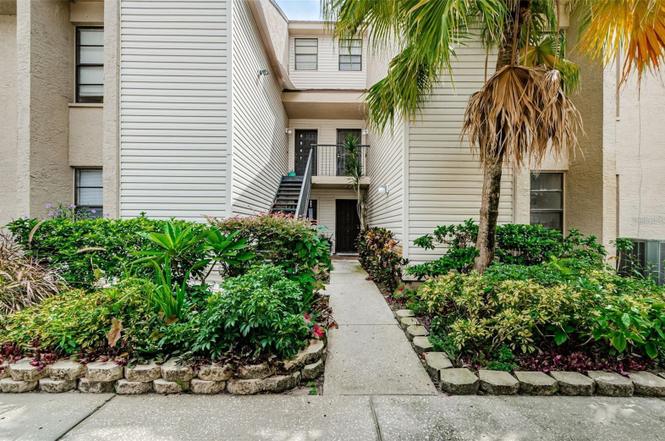
4909 Puritan Cir #2202 · East Lake-Orient Park, FL
Flood risk 1/10 · Minimal
- FEMA flood zone
- X (unshaded)
- Chance of flooding over 30 yrs
- 0.0%
- Est. flood insurance / yr
- $507 – $1,088
Fire risk 1/10 · Minimal
- Est. fire insurance / yr
- $947 – $1,759
Heat risk 10/10 · Severe
- Hot days now (above 109°F)
- 7 days/yr
- Hot days in 30 yrs
- 26 days/yr
Wind risk 9/10 · Severe
- Chance of severe wind over 30 yrs
- 99.0%
Air-quality risk 3/10 · Minor
- Unhealthy air days now
- 3 days/yr
- Unhealthy air days in 30 yrs
- 4 days/yr
Risk factors via First Street. Map © Google.
Why this score? — see what drove the C+ grade
The composite is a weighted blend of 9 inputs, each scored 0–100. Each bar is that input's sub-score; the figure is the points it added to the 100-point composite (weight × sub-score).
- Cash flow +25.2/30.0
- 1% rule +10.0/10.0
- DSCR +8.3/10.0
- ARV discount +7.5/15.0
- Schools +4.2/10.0
- Livability +2.5/5.0
- Condition / age +2.5/5.0
- Rent growth +2.4/5.0
- Appreciation +0.0/10.0
$101,600
🖨 Deal sheet (PDF) 📄 Offer letter ✓ Due diligence
Listing remarks
Under contract-accepting backup offers. Short Sale. Investment opportunity! This two bedroom, two bath condo in Puritan Circle is ready for a makeover! This community is guard gated with a beautiful community pool located near Temple Terrace. The home is in need of a complete rehab project but resales in the area for a ground floor 2/2 go for over $200,000. This is priced into consideration due to mold remediation through 3/4 of the property. All buyers and agents are to sign a hold harmless prior to entering the property and wearing a protective mask is recommended.
Key facts
- Community pool
- Guard gated
- $427 HOA
Tags
Neighborhood map
What this means for you Summary
Snapshot
- This is a 2-bed/2.0-bath condo listed at $102k.
Deal economics
- At list price, monthly cash flow is $229 ($3k/yr) — positive.
- The deal already cash-flows at list — no discount required.
- Meets the 1% rule at list price ($2k rent vs $102k).
- Recommended offer: $99k (3.0% below list) — sets the bar for market timing.
Location & tenants
- Location reads: area grade C — affects rentability + tenant quality, not the cash-flow math above.
- Hillsborough (suburban): math 47% / reading 50% proficiency, ranked #41 of 73 in FL (top 56%) — families likely to look elsewhere, expect single-tenant / working-renter base with shorter leases.
- Market conditions: Rents soft (-0.3%/yr); 284 active listings in the ZIP; 40 comparable units currently listed for rent nearby; rentals at typical pace (median 25d on market — plan ~3-4 weeks tenant-placement turnaround); 9,053 units permitted in Hillsborough County in 2024 (4,555 in 5+ unit buildings).
- This rent runs 40% of the median local income ($51k/yr) — at the standard rent-burdened threshold; future hikes will face affordability resistance.
Forward outlook
- Local home prices are declining (-3.0%/yr); year-one equity from $702 of loan paydown is wiped out by about $3k of value loss. Plan a longer hold.
- Hillsborough County population projected at +37% by 2050 — long-run rental-demand tailwind backs the buy-and-hold thesis.
Negotiation context
- It's been on market 59 days — a 3% lower offer ($99k) is reasonable based on typical stale-listing flexibility.
- 2 sale attempts; this cycle's ask is 13% above the opening price — seller raised mid-cycle; expect resistance to lowballs.
- Current owner paid $47k; list at $102k implies a 116% gain — meaningful room to come down on a strong offer.
Risks & watch-outs
- Watch-outs: HOA is 25% of rent.
- Climate carrying-cost: severe wind risk, 99% chance of damaging wind over 30y; extreme-heat days projected 7→26/yr by 2055 (HVAC capex compounding) — expect insurance premiums to compound above CPI over the hold.
Questions for the listing agent
- It's been on market 59 days. Have you received any prior offers? Is the seller open to a 3% concession, seller financing, or rate buy-down credit?
- What does the HOA fee cover, when was the last increase, and are there any pending special assessments or reserve-fund shortfalls?
- Any open or pending special assessments — roof, HVAC, plumbing, elevator, façade? What's the per-unit balance and payoff schedule, and is the seller paying it off at close or rolling it to the buyer?
- Is there a deadline driving the sale (1031 exchange, divorce, estate, relocation)? That informs how much negotiation room exists.
- What's the average days-on-market for RENTAL listings here right now (not sales)? A rising rental-DOM trend means longer vacancies and softer asking-rent achievability than the comps imply.
- What's the recent tenant-quality profile in this submarket — average credit score on applications, eviction rate, late-payment / NSF rate, and stable-employment percentage? A property-management company in the area should have these aggregated.
- How much new apartment / multifamily construction is in the pipeline within 1–3 miles? Heavy new supply (>2% of stock underway) typically softens rents 12–24 months out; light construction supports rent growth.
Investment metrics
- 1% rule
- 1.69% ✓
- Cap rate
- 9.00%
- Cash-on-cash
- 9.66%
- DSCR
- 1.43
- GRM
- 4.9
CMA / ARV
No comps found within radius.
Projected returns pro-forma
-3.0% appreciation · 0.0% rent growth · sell at horizon
- IRR
- -6.6%
- Equity multiple
- 0.77×
- Total profit
- $-6,627
- Equity at exit
- $15,149
- IRR
- -3.5%
- Equity multiple
- 0.81×
- Total profit
- $-5,287
- Equity at exit
- $8,785
Cash invested: $28,448 (down + closing). Projections, not guarantees.
Landlord ↔ Tenant lean methodology
- Overall (STATE)
- 87 Strongly Landlord-Friendly
- State Florida
- 87 Strongly Landlord-Friendly · R+3
- County
- — inherits STATE
- City
- — inherits STATE
ZIP-level market 33617
- Rents YoY
- -0.3%
- Active inventory
- 284
- Price-to-rent
- 4.9×
Monthly cashflow live
- Estimated rent
- $1,719 high interval (Pro) →
- Mortgage (P&I)
- −$533
- Tax est. 1.5%
- −$127 /mo · $1,524/yr
- Insurance
- −$42
- HOA
- −$427
- Vacancy / Maint / Mgmt
- −$361
- Net cashflow
- $229
Break-even live
Sensitivity live
| Price | -10% $299 | -5% $264 | +0% $229 | +5% $194 | +10% $159 |
|---|---|---|---|---|---|
| Rent | -10% $93 | -5% $161 | +0% $229 | +5% $297 | +10% $365 |
| Rate | -1.0pp $280 | -0.5pp $255 | base $229 | +0.5pp $203 | +1.0pp $176 |
UW: 25.0% down · 7.5% · 30yr · 1.5% tax · 5.0% vac · 8.0% maint · 8.0% mgmt
Financing live
Cash to close
- Down payment
- $25,400
- Closing costs
- $3,048
- Reserves months
- —
- Total cash needed
- —
Loan-product check · same deal, 3 products live
Conventional
25% down · 7.5% · 30yr
- Down + closing
- —
- Monthly P&I
- —
- Monthly cashflow
- —
- DSCR
- —
- Eligible?
- —
Personal DTI + credit; lowest rate.
DSCR
20% down · 8.5% · 30yr
- Down + closing
- —
- Monthly P&I
- —
- Monthly cashflow
- —
- DSCR
- —
- Eligible?
- —
No personal income docs; deal must DSCR.
Hard money
10% down · 12.0% · 12mo
- Down + closing
- —
- Monthly P&I
- —
- Monthly cashflow
- —
- DSCR
- —
- Eligible?
- —
Short-term bridge; refi at stabilization.
Rent comps 40 comps
| Address | Beds | Baths | Sqft | Rent | $/sqft | DOM | Units | Dist |
|---|---|---|---|---|---|---|---|---|
| 5125 Puritan Cir #1103 Tampa, FL | 2.0 | 2.0 | 1191 | $1,850 | $1.55 | 11d | 1 | 0.10mi |
| 4991 Puritan Cir #522 Tampa, FL | 2.0 | 2.0 | 906 | $1,599 | $1.76 | 25d | 1 | 0.14mi |
| 4418 Porpoise Dr Tampa, FL | 3.0 | 2.0 | 975 | $2,100 | $2.15 | 13d | 1 | 0.14mi |
| 7134 N 50th St Tampa, FL | 3.0 | 1.0 | 915 | $1,650 | $1.80 | 25d | 1 | 0.19mi |
| 5003 Puritan Rd Tampa, FL | 3.0 | 2.0 | 1469 | $2,000 | $1.36 | 6d | 1 | 0.26mi |
| 7113 N 50th St Tampa, FL | 3.0 | 2.0 | 1338 | $2,050 | $1.53 | 21d | 1 | 0.29mi |
| 4122 Waterside Island Ct Tampa, FL | 3.0 | 2.5 | 1364 | $1,800 | $1.32 | 25d | 1 | 0.40mi |
| 4105 Waterside Island Ct Tampa, FL | 3.0 | 2.5 | 1364 | $1,995 | $1.46 | 6d | 1 | 0.42mi |
| 4105 Waterside Island Ct Tampa, FL | 3.0 | 2.5 | 1364 | $2,195 | $1.61 | 25d | 1 | 0.42mi |
| 7402 E Bank Dr #7402 Tampa, FL | 3.0 | 2.5 | 1364 | $2,800 | $2.05 | 25d | 1 | 0.45mi |
| 4113 Gradstone Pl Tampa, FL | 3.0 | 2.5 | 1364 | $1,590 | $1.17 | 15d | 1 | 0.46mi |
| 4119 Gradstone Pl Tampa, FL | 3.0 | 2.0 | 1364 | $1,650 | $1.21 | 15d | 1 | 0.46mi |
| 7107 N 53rd St Unit B Tampa, FL | 1.0 | 1.0 | 850 | $1,500 | $1.76 | 25d | 1 | 0.50mi |
| 7195 E Bank Dr #206 Tampa, FL | 2.0 | 1.5 | 864 | $1,700 | $1.97 | 3d | 1 | 0.51mi |
| 7517 Lakeshore Dr Unit A Tampa, FL | 2.0 | 1.0 | 710 | $1,500 | $2.11 | 25d | 1 | 0.60mi |
| 5013 E Sligh Ave Tampa, FL | 2.0 | 1.0–1.5 | 939 | $1,412 | $1.50 | 0d | 7 | 0.60mi |
| 4102 Oak Knoll Ct Tampa, FL | 1.0–3.0 | 1.0–2.0 | 912 | $1,375 | $1.51 | 4d | 56 | 0.62mi |
| 4102 Oak Knoll Ct Tampa, FL | 3.0 | 2.0 | 1134 | $1,550 | $1.37 | 25d | 1 | 0.62mi |
| 4102 Oak Knoll Ct Unit 01 020 Tampa, FL | 2.0 | 2.0 | 890 | $1,500 | $1.69 | 25d | 1 | 0.62mi |
| 7606 Abbey Ln #208 Tampa, FL | 2.0 | 1.5 | 936 | $1,500 | $1.60 | 25d | 1 | 0.63mi |
| 5508 Pokeweed Ct #146 Tampa, FL | 1.0 | 1.0 | 783 | $1,350 | $1.72 | 13d | 1 | 0.63mi |
| 7505 Pitch Pine Cir #122 Tampa, FL | 2.0 | 1.5 | 1074 | $1,600 | $1.49 | 25d | 1 | 0.64mi |
| 7506 Presley Pl Tampa, FL | 2.0 | 2.0 | 975 | $1,300 | $1.33 | 25d | 1 | 0.64mi |
| 7510 Presley Pl Unit 98-A Tampa, FL | 1.0 | 1.0 | 783 | $1,300 | $1.66 | 3d | 1 | 0.65mi |
| 7607 Abbey Ln Tampa, FL | 2.0 | 1.5 | 1400 | $1,500 | $1.07 | 25d | 1 | 0.67mi |
| 7516 Needle Leaf Pl #44 Tampa, FL | 2.0 | 1.5 | 1074 | $1,600 | $1.49 | 25d | 1 | 0.68mi |
| 5008 Sierra Pl Tampa, FL | 3.0 | 2.0 | 1461 | $2,161 | $1.48 | 15d | 1 | 0.68mi |
| 5008 Sierra Pl Tampa, FL | 1.0 | 1.0 | 827 | $1,510 | $1.83 | 23d | 1 | 0.68mi |
| 5008 Sierra Pl Tampa, FL | 2.0 | 2.0 | 1122 | $1,615 | $1.44 | 21d | 1 | 0.68mi |
| 7506 Needle Leaf Pl #56 Tampa, FL | 1.0 | 1.0 | 747 | $1,400 | $1.87 | 11d | 1 | 0.69mi |
| 8412 Rio Bravo Ct Tampa, FL | 1.0–3.0 | 1.0–2.5 | 1014 | $1,384 | $1.36 | 25d | 1 | 0.69mi |
| 8501 N 50th St Tampa, FL | 1.0–2.0 | 1.0–2.0 | 730 | $1,710 | $2.34 | 25d | 1 | 0.73mi |
| 3826 Lakeshore Dr Tampa, FL | 2.0 | 1.0 | 812 | $1,100 | $1.35 | 25d | 1 | 0.80mi |
| 5659 Del Prado Dr Tampa, FL | 1.0–3.0 | 1.0–2.0 | 1229 | $1,550 | $1.26 | 0d | 4 | 0.81mi |
| 7011 San Ramon Pl Tampa, FL | 2.0 | 1.0–2.0 | 1050 | $1,475 | $1.40 | 14d | 5 | 0.83mi |
| 4207 S Sandalwood Cir Tampa, FL | 3.0 | 1.0 | 840 | $1,827 | $2.17 | 25d | 1 | 0.83mi |
| 3906 E Bird St Unit B Tampa, FL | 2.0 | 1.0 | 812 | $1,300 | $1.60 | 15d | 1 | 0.83mi |
| 4007 E Pocahontas Ave Tampa, FL | 3.0 | 1.0 | 1100 | $2,100 | $1.91 | 25d | 1 | 0.85mi |
| 4406 Mango Ter Unit B Tampa, FL | 2.0 | 1.0 | 840 | $1,400 | $1.67 | 25d | 1 | 0.88mi |
| 8720 N 48th St Tampa, FL | 2.0 | 1.0 | 1000 | $1,249 | $1.25 | 3d | 1 | 0.88mi |
HOA detail condo
- Monthly dues
- $427 · $5,124/yr
- Likely covers
- poolsecurity
- Assessments
- None detected in remarks — confirm with the listing agent.
Listing history 8 events
-
2025-11-04status Pending
-
2025-10-08status Active
-
2025-10-08price $101,600
-
2025-09-15status Pending
-
2025-08-14$89,900 Active
-
2001-02-15soldstatus $47,000
-
2001-02-15soldstatus $47,000
-
1984-09-01soldstatus $52,500
ⓘ Source: listings_history table (triggers on properties + properties_extension) + one-shot
backfill from property_details.listing_events for pre-trigger history.
Climate risk First Street
- Flood 1/10 Low FEMA zone X (unshaded) · 0% chance over 30 yrs
- Wildfire 1/10 Low
- Heat 10/10 Extreme 7 d/yr ≥109°F today · 26 d/yr by 30 yrs out
- Wind 9/10 Extreme 99% chance of damaging wind over 30 yrs
- Air quality 3/10 Moderate 3 unhealthy d/yr today · 4 by 30 yrs out
Nearby sold comps map
Loading sold comps map…
Walkable amenities ~0.75 mi
Loading nearby amenities…
Taxation est. · year 1
- Rental income
- $20,630
- − Mortgage interest
- −$5,691
- − Property taxes
- −$1,524
- − Insurance
- −$508
- − Repairs & maintenance
- −$1,650
- − Management
- −$1,650
- − HOA
- −$5,124
- − Depreciation
- −$2,956
- Taxable income
- $1,527
- Est. tax owed @ 24.0%
- −$366
- After-tax cash flow
- $2,382/yr
For passive investors: Depreciation is non-cash, so a rental often shows a tax loss while cash-flowing — sheltering income. Rental losses are passive: they offset passive income freely, and up to $25,000/yr can offset ordinary (W-2) income if you actively participate and your MAGI is under $100k (phasing out to $0 by $150k); unused losses carry forward. On sale, claimed depreciation is recaptured at up to 25%, and gains may owe capital-gains tax (a 1031 exchange can defer both). Figures are a year-1 estimate at your 24.0% rate — not tax advice; consult a CPA.
Schools (NCES district)
- District
- Hillsborough
- NCES district ID
- 1200870
- Math proficiency
- 47% ▼ -8.00%
- Reading proficiency
- 50% ▼ -4.00%
- Median HH income
- $50,622
- Composite
- 41.6/100
- National rank
- #3435
- State rank
- #41 of 73 in FL
Livability — East Lake-Orient Park
No livability data for this city. (Only ~50 U.S. cities are tracked.)
Census & demographics
- Census place
- East Lake-Orient Park, FL
- County
- Hillsborough County · 1,540,968 people
- City population
- 45,396
- Metro
- Tampa-St. Petersburg-Clearwater, FL
- Population (ZIP)
- 47,851
- Household income
- $50,948
- Rent vs Own
- Severe rent burden
- 3295.0
Population outlook (Hillsborough County) Hauer SSP2
- Today (2025)
- 1,607,022 people
- By 2030
- 1,733,968 · +7.9%
- By 2040
- 1,979,565 · +23.2%
- By 2050
- 2,203,427 · +37.1%
- By 2075
- 2,667,893 · +66.0%
- By 2100
- 2,891,558 · +79.9%
Race, ethnicity, and origin ACS 2023
- Neighborhood character
- Highly diverse neighborhood (Simpson 0.71)
- Race & ethnicity
- Black 36% White 33% Hispanic / Latino 23% Two or more races 14% Asian 5%
- Hispanic origin (detail)
- Mexican 2% Puerto Rican 7% Cuban 4% Dominican 2%
- Common ancestry
- Hispanic 3% Lithuanian 1% Romanian 1%
- Foreign-born
- 17% · Canada, Vietnam, Jamaica
- Languages at home
- 74% English-only · Spanish 15% Arabic 3% French/Haitian/Cajun 3%
Political lean MEDSL · Hillsborough
- 2024 margin
- Toss-up / Even · D 47.8% · R 50.9% · Other 1.3%
- 2008→2024 swing
- -10.2pp toward R · 2008: 7.1pp · 2024: -3.1pp
- All cycles
- 2024: R+3.1 2020: D+6.9 2016: D+6.8 2012: D+6.7 2008: D+7.1
Not yet ingested
- Civics
- —
Market trends
- HPI YoY
- ▼ -243.20%
- Current HPI
- 352.4572
- Rent YoY
- ▼ -0.33%
- Metro
- Tampa-St. Petersburg-Clearwater, FL
- State GDP YoY
- ▲ 3.28%
- F500 in state
- 36
Industry mix (Fortune 500 HQ in FL)
| Industry | F500 HQs | Revenue |
|---|---|---|
| Industrial Technology | 2 | $29B |
|
||
| Insurance | 2 | $17B |
|
||
| Retail | 1 | $60B |
|
||
| Technology Distribution | 1 | $58B |
|
||
| Homebuilding | 1 | $35B |
|
||
| Technology Manufacturing | 1 | $35B |
|
||
Price history
+93.5% since first listed8 events — show timeline
- 2025-11-04 Pending — Stellar MLS as Distributed by MLS Grid
- 2025-10-08 Relisted — Stellar MLS as Distributed by MLS Grid
- 2025-10-08 Price Changed $101,600 Stellar MLS as Distributed by MLS Grid
- 2025-09-15 Pending — Stellar MLS as Distributed by MLS Grid
- 2025-08-14 Listed $89,900 Stellar MLS as Distributed by MLS Grid
- 2001-02-15 Sold (Public Records) $47,000 Public Records
- 2001-02-15 Sold (Public Records) $47,000 Public Records
- 1984-09-01 Sold (Public Records) $52,500 Public Records
Property tax history
-6.1%/yrLatest (2025): $29 · +0.0% YoY. Source: county tax records.
Cash-flow waterfall
monthlySold comps — $/sqft
last 12 mo · ≤1 miLoading sold comps…