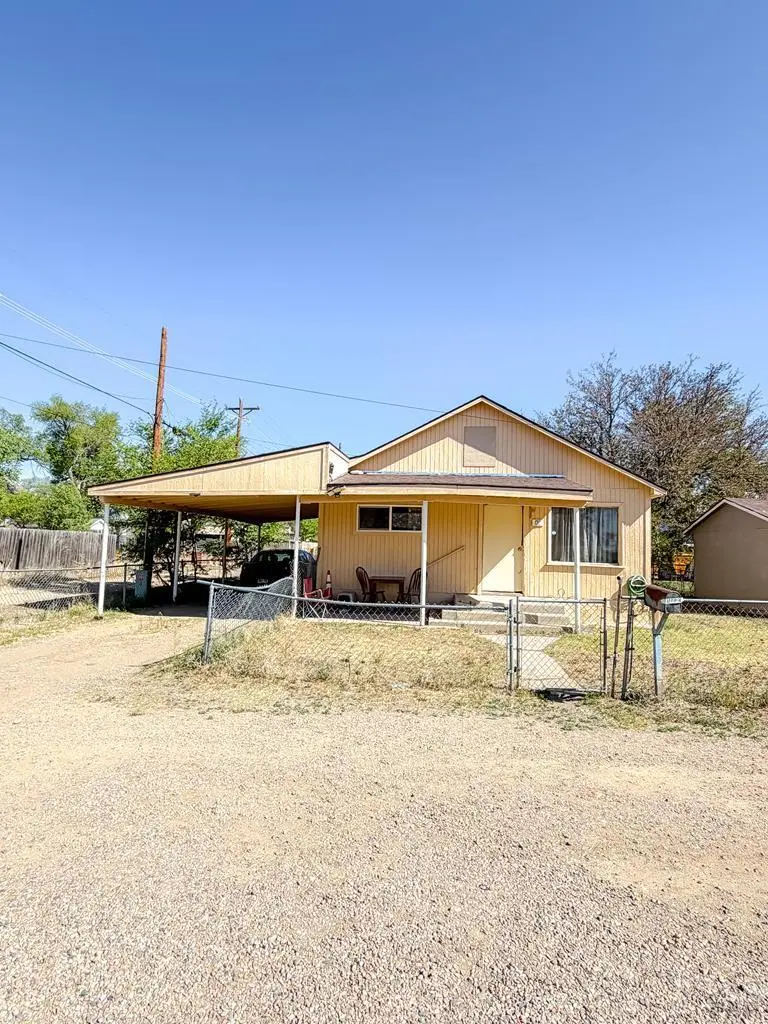
40 E Sixth St · Las Animas, CO
Flood risk No data
- FEMA flood zone
- —
- Chance of flooding over 30 yrs
- —
- Est. flood insurance / yr
- —
Fire risk No data
- Est. fire insurance / yr
- —
Heat risk No data
- Hot days now (above threshold)
- —
- Hot days in 30 yrs
- —
Wind risk No data
- Chance of severe wind over 30 yrs
- —
Air-quality risk No data
- Unhealthy air days now
- —
- Unhealthy air days in 30 yrs
- —
Risk factors via First Street. Map © Google.
Why this score? — see what drove the C+ grade
The composite is a weighted blend of 9 inputs, each scored 0–100. Each bar is that input's sub-score; the figure is the points it added to the 100-point composite (weight × sub-score).
- Cash flow +28.0/30.0
- ARV discount +10.1/15.0
- DSCR +9.9/10.0
- 1% rule +6.3/10.0
- Livability +3.5/5.0
- Rent growth +2.5/5.0
- Condition / age +2.5/5.0
- Schools +1.8/10.0
- Appreciation +0.0/10.0
$95,000
🖨 Deal sheet (PDF) 📄 Offer letter ✓ Due diligence
Listing remarks
3-bedroom home with 1 bath, hardwood flooring, and a comfortable layout. Some updates are needed, making it a good opportunity for improvement. Fenced yard provides outdoor space, and the attached 2-car garage offers added storage and parking. Call for your tour.
Key facts
- Hardwood flooring
- Fenced yard
- Attached garage
Tags
Property features AI
Finance
- HOA & community: No association amenities
Exterior
- Parking: Attached carport (no enclosed garage)
- Utilities: Public water; Public sewer
- Home design: Single-family residential; Irregular lot
- Construction: Frame construction with wood siding; Composition roof; Above-grade finished living area
- Exterior features: Covered patio/porch; Shed(s)
Interior
- Kitchen: Range; Oven; Refrigerator
- Bedrooms: 3 main-level bedrooms
- Flooring: Hardwood; Wood; Vinyl
- Bathrooms: 1 full bathroom on the main level
- Heating & cooling: Natural gas forced-air heating; Evaporative cooling; Window AC unit(s)
- Interior features: Master bedroom on the main level; Crawl space basement
- Laundry & utility: Laundry on the main level
Neighborhood map
What this means for you Summary
Snapshot
- This is a 3-bed/1.0-bath single-family listed at $95k.
Deal economics
- At list price, monthly cash flow is $296 ($4k/yr) — positive.
- The deal already cash-flows at list — no discount required.
- Meets the 1% rule at list price ($1k rent vs $95k).
- Recommended offer: $92k (3.0% below list) — sets the bar for market timing.
- Cap rate 10.0% vs local median 5.4% in Las Animas — top-decile yield for the area; either an underpriced asset or a hidden risk that comps aren't pricing in. Stress-test before assuming the spread holds.
Location & tenants
- Location reads 70/100 on livability (#89 in CO) — a middle-class / working-renter tenant base. Strengths: commute A+, cost of living A+, housing A; Watch: health & safety C-, amenities F, employment F.
- Las Animas School District No. Re-1 (town): math 14% / reading 30% proficiency, ranked #76 of 86 in CO (top 88%) — low school quality limits family demand, transient renter base, plan for 1-2y turnover; 69% free/reduced lunch — lower-income household profile, screen leases tightly.
- Zoned schools: Las Animas Elementary School (math 27% / reading 32%, grade F, #512 of 966 statewide, top 55%, 246 students, 68% FRL); Las Animas Junior High School (math 24% / reading 30%, grade F, #150 of 270 statewide, top 57%, 90 students, 69% FRL); Las Animas High School (math 30% / reading 50%, grade F, #167 of 381 statewide, top 46%, 118 students, 58% FRL) — zoned schools at 65% FRL track the district average.
- Market conditions: 37 active listings in the ZIP; 6 units permitted in Bent County in 2024 (0 in 5+ unit buildings).
Forward outlook
- Local home prices are declining (-3.0%/yr); year-one equity from $657 of loan paydown is wiped out by about $3k of value loss. Plan a longer hold.
- Bent County population projected at -20% by 2050 — secular population decline; favor cash flow + early exit over multi-decade hold.
- At projected returns (-3.0% appreciation + 3.0% rent growth), your $27k cash investment doubles in ~9 years — after that, you're playing with house money.
Negotiation context
- It's been on market 56 days — a 3% lower offer ($92k) is reasonable based on typical stale-listing flexibility.
- Current owner paid $67k; 42% above their basis — modest negotiation headroom, anchor on the comps not their cost.
Risks & watch-outs
- Watch-outs: built in 1946 — expect roof / HVAC / electrical / plumbing capex.
Questions for the listing agent
- It's been on market 56 days. Have you received any prior offers? Is the seller open to a 3% concession, seller financing, or rate buy-down credit?
- Built in 1946 — when were the roof, HVAC, electrical panel, plumbing, and water heater last replaced?
- Is there a deadline driving the sale (1031 exchange, divorce, estate, relocation)? That informs how much negotiation room exists.
- Schools are D-rated, which usually means shorter tenancies and higher turnover. Who's the typical renter profile here, and what's been the actual vacancy rate?
- What's the average days-on-market for RENTAL listings here right now (not sales)? A rising rental-DOM trend means longer vacancies and softer asking-rent achievability than the comps imply.
- What's the recent tenant-quality profile in this submarket — average credit score on applications, eviction rate, late-payment / NSF rate, and stable-employment percentage? A property-management company in the area should have these aggregated.
- How much new for-sale + rental construction is in the pipeline within 1–3 miles? Heavy new supply typically softens prices + rents 12–24 months out; constrained supply supports both.
Investment metrics
- 1% rule
- 1.13% ✓
- Cap rate
- 10.03%
- Cash-on-cash
- 13.33%
- DSCR
- 1.59
- GRM
- 7.3
CMA / ARV
- ARV (on-the-fly)
- $100,828
- Comps found
- 9
Show comp detail 9 sales within ~0.75 mi
| Address | Dist | Beds/Ba | Sqft | Sold | Price | $/sf | Match |
|---|---|---|---|---|---|---|---|
| 204 St. Vrain Ave | 0.35mi | 3/1.0 | 1,073 (-3%) | 14mo | $152,000 | $142 | 67 |
| 350 Vigil Ave | 0.25mi | 2/1.0 (-1) | 1,140 (+3%) | 14mo | $130,500 | $114 | 67 |
| 509 5th St | 0.43mi | 2/1.0 (-1) | 1,024 (-8%) | 3mo | $93,000 | $91 | 60 |
| 647 Garfield Ave | 0.08mi | 3/2.0 | 1,214 (+10%) | 21mo | $148,500 | $122 | 59 |
| 710 5th St | 0.59mi | 3/1.0 | 1,162 (+5%) | 10mo | $44,000 | $38 | 56 |
| 120 Elm Ave | 0.56mi | 3/1.0 | 1,200 (+8%) | 9mo | $70,000 | $58 | 52 |
| 722 Locust Ave | 0.48mi | 2/2.0 (-1) | 1,076 (-3%) | 22mo | $195,000 | $181 | 45 |
| 243 Elm Ave | 0.52mi | 2/1.0 (-1) | 1,252 (+13%) | 6mo | $62,500 | $50 | 45 |
| 307 Maple Ave | 0.69mi | 2/1.0 (-1) | 970 (-12%) | 14mo | $70,000 | $72 | 31 |
Match score weights: distance 35% · size 25% · config 20% · recency 20%. Top-matched comps best support the ARV.
Projected returns pro-forma
-3.0% appreciation · 3.0% rent growth · sell at horizon
- IRR
- 3.3%
- Equity multiple
- 1.13×
- Total profit
- $3,382
- Equity at exit
- $14,165
- IRR
- 12.8%
- Equity multiple
- 2.01×
- Total profit
- $26,996
- Equity at exit
- $8,214
Cash invested: $26,600 (down + closing). Projections, not guarantees.
Landlord ↔ Tenant lean methodology
- Overall (STATE)
- 38 Tenant-Leaning
- State Colorado
- 38 Tenant-Leaning · D+4
- County
- — inherits STATE
- City
- — inherits STATE
ZIP-level market 81054
- Home prices YoY
- -14.1%
- Active inventory
- 37
- Price-to-rent
- 7.3×
Monthly cashflow live
- Estimated rent
- $1,077 medium interval (Pro) →
- Mortgage (P&I)
- −$498
- Tax from tax record
- −$18 /mo · $213/yr
- Insurance
- −$40
- HOA
- −$0
- Lot rent
- −$0
- Vacancy / Maint / Mgmt
- −$226
- Net cashflow
- $296
Break-even live
Sensitivity live
| Price | -10% $349 | -5% $322 | +0% $296 | +5% $269 | +10% $242 |
|---|---|---|---|---|---|
| Rent | -10% $210 | -5% $253 | +0% $296 | +5% $338 | +10% $381 |
| Rate | -1.0pp $343 | -0.5pp $320 | base $296 | +0.5pp $271 | +1.0pp $246 |
UW: 25.0% down · 7.5% · 30yr · 1.5% tax · 5.0% vac · 8.0% maint · 8.0% mgmt
Financing live
Cash to close
- Down payment
- $23,750
- Closing costs
- $2,850
- Reserves months
- —
- Total cash needed
- —
Loan-product check · same deal, 3 products live
Conventional
25% down · 7.5% · 30yr
- Down + closing
- —
- Monthly P&I
- —
- Monthly cashflow
- —
- DSCR
- —
- Eligible?
- —
Personal DTI + credit; lowest rate.
DSCR
20% down · 8.5% · 30yr
- Down + closing
- —
- Monthly P&I
- —
- Monthly cashflow
- —
- DSCR
- —
- Eligible?
- —
No personal income docs; deal must DSCR.
Hard money
10% down · 12.0% · 12mo
- Down + closing
- —
- Monthly P&I
- —
- Monthly cashflow
- —
- DSCR
- —
- Eligible?
- —
Short-term bridge; refi at stabilization.
Listing history 22 events
-
2026-06-22days on market $95,000 Active 56 DOM
-
2026-06-21days on market $95,000 Active 55 DOM
-
2026-06-21days on market $95,000 Active 54 DOM
-
2026-06-18days on market $95,000 Active 52 DOM
-
2026-06-17days on market $95,000 Active 51 DOM
-
2026-06-16days on market $95,000 Active 50 DOM
-
2026-06-15days on market $95,000 Active 49 DOM
-
2026-06-13days on market $95,000 Active 47 DOM
-
2026-06-12days on market $95,000 Active 46 DOM
-
2026-06-09days on market $95,000 Active 43 DOM
-
2026-06-08days on market $95,000 Active 42 DOM
-
2026-06-07days on market $95,000 Active 41 DOM
-
2026-06-05days on market $95,000 Active 39 DOM
-
2026-06-04days on market $95,000 Active 37 DOM
-
2026-06-02days on market $95,000 Active 36 DOM
-
2026-06-01days on market $95,000 Active 35 DOM
-
2026-05-31days on market $95,000 Active 34 DOM
-
2026-05-31days on market $95,000 Active 33 DOM
-
2026-04-28$95,000 Active
-
2008-12-17soldstatus $67,000
-
1991-09-12soldstatus $6,250
-
1984-06-19soldstatus $20,000
ⓘ Source: listings_history table (triggers on properties + properties_extension) + one-shot
backfill from property_details.listing_events for pre-trigger history.
Tax reassessment forecast CO · Resets to sale price
- Current annual tax
- $213 · $18/mo
- Projected year-2 tax
- $522 · $44/mo
- Expected delta
- +$310/yr (+$26/mo · 145.9%)
ⓘ Screening estimate from a state-policy table — verify with the county assessor before closing.
Nearby sold comps map
Loading sold comps map…
Walkable amenities ~0.75 mi
Loading nearby amenities…
Taxation est. · year 1
- Rental income
- $12,927
- − Mortgage interest
- −$5,321
- − Property taxes
- −$213
- − Insurance
- −$475
- − Repairs & maintenance
- −$1,034
- − Management
- −$1,034
- − Depreciation
- −$2,764
- Taxable income
- $2,086
- Est. tax owed @ 24.0%
- −$501
- After-tax cash flow
- $3,046/yr
For passive investors: Depreciation is non-cash, so a rental often shows a tax loss while cash-flowing — sheltering income. Rental losses are passive: they offset passive income freely, and up to $25,000/yr can offset ordinary (W-2) income if you actively participate and your MAGI is under $100k (phasing out to $0 by $150k); unused losses carry forward. On sale, claimed depreciation is recaptured at up to 25%, and gains may owe capital-gains tax (a 1031 exchange can defer both). Figures are a year-1 estimate at your 24.0% rate — not tax advice; consult a CPA.
Schools (NCES district)
- District
- Las Animas School District No. Re-1
- NCES district ID
- 0805250
- Math proficiency
- 14% ▲ 3.00%
- Reading proficiency
- 30% ▲ 8.00%
- Median HH income
- $33,597
- Composite
- 17.94/100
- National rank
- #8993
- State rank
- #76 of 86 in CO
Livability — Las Animas
- Score
- 70/100
- State rank
- #89
- US rank
- #7896
Category grades
Schools grade is shown separately in the Schools card above.
Census & demographics
- Census place
- Las Animas, CO
- Population (ZIP)
- 4,760
Population outlook (Bent County) Hauer SSP2
- Today (2025)
- 5,223 people
- By 2030
- 4,985 · -4.6%
- By 2040
- 4,592 · -12.1%
- By 2050
- 4,207 · -19.5%
- By 2075
- 3,216 · -38.4%
- By 2100
- 2,347 · -55.1%
Race, ethnicity, and origin ACS 2023
- Neighborhood character
- Diverse neighborhood (Simpson 0.62)
- Race & ethnicity
- White 51% Hispanic / Latino 35% Two or more races 15% Black 4% Native American 3%
- Hispanic origin (detail)
- Mexican 21%
- Common ancestry
- Slovak 3% Italian 1% Portuguese 1%
- Foreign-born
- 3% · Canada
- Languages at home
- 91% English-only · Spanish 8% French/Haitian/Cajun 1%
Political lean MEDSL · Bent
- 2024 margin
- Solid R (+38.9) · D 29.5% · R 68.3% · Other 2.2%
- 2008→2024 swing
- -24.4pp toward R · 2008: -14.5pp · 2024: -38.9pp
- All cycles
- 2024: R+38.9 2020: R+33.9 2016: R+30.9 2012: R+14.6 2008: R+14.5
Not yet ingested
- Civics
- —
Market trends
- HPI YoY
- ▼ -35.76%
- Current HPI
- 218.1482
- Rent YoY
- —
- Metro
- —
- State GDP YoY
- ▲ 1.95%
- F500 in state
- 14
Industry mix (Fortune 500 HQ in CO)
| Industry | F500 HQs | Revenue |
|---|---|---|
| Technology Distribution | 1 | $31B |
|
||
| Food / Agriculture | 1 | $18B |
|
||
| Packaging | 1 | $14B |
|
||
| Healthcare | 1 | $13B |
|
||
| Energy | 1 | $10B |
|
||
| Technology | 1 | $4B |
|
||
Price history
+375.0% since first listed4 events — show timeline
- 2026-04-28 Listed $95,000 PARMLS
- 2008-12-17 Sold (Public Records) $67,000 Public Records
- 1991-09-12 Sold (Public Records) $6,250 Public Records
- 1984-06-19 Sold (Public Records) $20,000 Public Records
Property tax history
+3.1%/yrLatest (2025): $213 · +87.5% YoY. Source: county tax records.
Cash-flow waterfall
monthlySold comps — $/sqft
last 12 mo · ≤1 miLoading sold comps…